

Key Insights
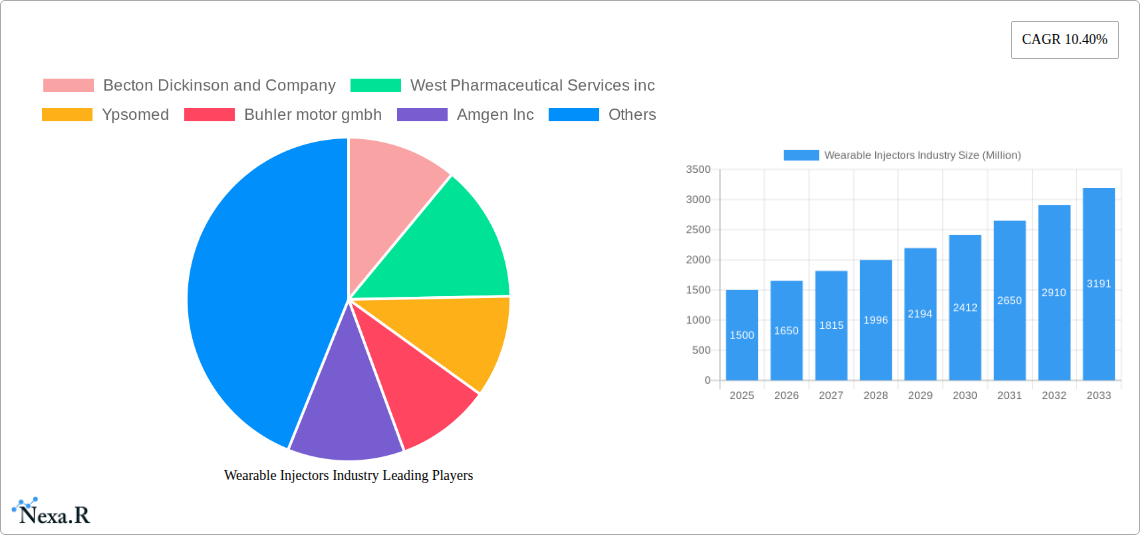
The wearable injectors market is experiencing robust growth, driven by the increasing prevalence of chronic diseases requiring frequent injections, the rising demand for convenient and user-friendly drug delivery systems, and advancements in miniaturization and automation technologies. The market's Compound Annual Growth Rate (CAGR) of 10.40% from 2019-2033 indicates significant potential. On-body injectors, offering discreet and continuous drug delivery, are projected to dominate the therapy segments, particularly oncology, autoimmune diseases, and diabetes, due to improved patient compliance and reduced injection-related stress. Hospitals and clinics currently represent the largest end-user segment, however, the home care segment is poised for substantial growth fueled by an aging population and a preference for in-home healthcare. Major market players, including Becton Dickinson, West Pharmaceutical Services, and Ypsomed, are actively engaged in research and development, focusing on innovative designs, enhanced safety features, and improved drug compatibility to maintain a competitive edge. Geographic expansion is also a major factor driving growth, with North America and Europe currently holding significant market share, but the Asia-Pacific region is expected to witness the fastest growth rate due to rising disposable incomes and increased healthcare expenditure.
Technological advancements, such as smart injectors with data logging and remote monitoring capabilities, contribute significantly to the market's upward trajectory. These features enable improved medication adherence tracking and personalized treatment plans. However, high initial costs of wearable injectors, potential concerns regarding device malfunctions, and stringent regulatory approvals in various regions pose some challenges to market expansion. Despite these constraints, the overall market outlook remains positive, with the continued focus on developing more sophisticated and patient-centric devices expected to propel market growth throughout the forecast period (2025-2033). The increasing adoption of personalized medicine and the development of novel therapies for chronic diseases will further contribute to the market’s expansion. This suggests that the wearable injectors market is well-positioned for considerable future expansion and investment.
Wearable Injectors Market: A Comprehensive Report (2019-2033)
This comprehensive report provides an in-depth analysis of the Wearable Injectors market, encompassing market dynamics, growth trends, regional segmentation, product landscape, key players, and future outlook. The study period covers 2019-2033, with 2025 as the base year and a forecast period of 2025-2033. This report is essential for industry professionals, investors, and researchers seeking a detailed understanding of this rapidly evolving market.
Wearable Injectors Industry Market Dynamics & Structure
The Wearable Injectors market, a sub-segment of the larger drug delivery systems market, is experiencing significant growth driven by technological advancements and increasing demand for convenient and self-administered therapies. Market concentration is moderate, with several key players competing fiercely. Technological innovation, primarily focused on improving device miniaturization, usability, and drug delivery precision, is a major driver. Stringent regulatory frameworks, particularly concerning safety and efficacy, influence market dynamics. Competitive product substitutes, such as traditional injection methods, pose a challenge, although the convenience and patient compliance benefits of wearable injectors are driving market penetration. M&A activity in this space has been significant, with an estimated xx million units of deals completed in the historical period (2019-2024), primarily focused on acquiring smaller innovative companies with specialized technologies. End-user demographics are shifting towards an older population with chronic conditions, increasing the demand for convenient and effective drug delivery solutions.
- Market Concentration: Moderate, with top 5 players holding xx% market share in 2024.
- Technological Innovation: Focus on miniaturization, improved usability, and wireless connectivity.
- Regulatory Landscape: Stringent FDA and other global regulatory approvals required.
- Competitive Substitutes: Traditional injection methods, oral medications.
- M&A Activity: xx million units in deals completed between 2019-2024, indicative of industry consolidation.
- End-User Demographics: Aging population with increased prevalence of chronic diseases.
Wearable Injectors Industry Growth Trends & Insights
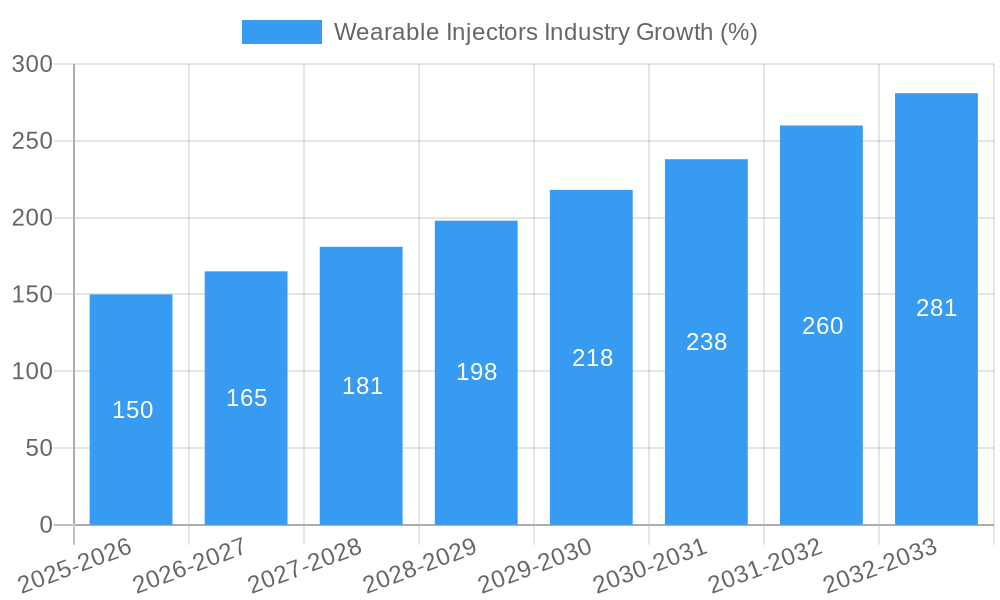
The Wearable Injectors market is projected to witness robust growth during the forecast period (2025-2033). The market size, valued at xx million units in 2024, is anticipated to reach xx million units by 2033, exhibiting a CAGR of xx%. This growth is primarily fueled by the increasing prevalence of chronic diseases such as diabetes, autoimmune disorders, and cardiovascular diseases, which require regular medication administration. The rising adoption of wearable injectors among patients seeking convenient and discreet drug delivery methods is also a significant contributor. Technological disruptions, such as the incorporation of smart sensors and wireless connectivity, are enhancing patient compliance and enabling remote monitoring of therapy. Consumer behavior is shifting towards greater acceptance and preference for self-administered therapies, bolstering market growth. Furthermore, increasing investment in research and development by major players is accelerating innovation and expanding the application of wearable injectors across various therapeutic areas.
Dominant Regions, Countries, or Segments in Wearable Injectors Industry
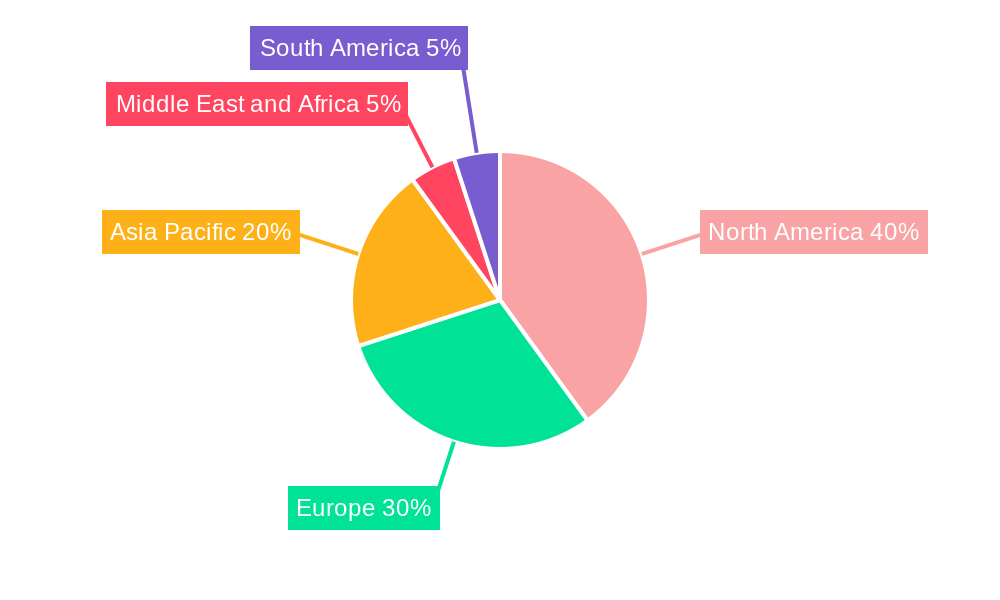
North America currently dominates the Wearable Injectors market, holding the largest market share in 2024 at xx%, driven by high healthcare expenditure, robust regulatory frameworks, and a large patient population with chronic diseases. However, the Asia-Pacific region is expected to witness the fastest growth during the forecast period, with a CAGR of xx%, fueled by rising healthcare awareness, increasing disposable incomes, and growing adoption of advanced medical technologies. Within the segment breakdown, the On-Body Injectors segment is expected to retain its dominance throughout the forecast period due to the inherent convenience it offers patients. Similarly, the Diabetes therapy segment accounts for the largest market share due to the high prevalence of this disease globally. Within the end-user segment, home care is anticipated to witness substantial growth as patients increasingly opt for convenient self-administration at home.
- North America: High healthcare expenditure, established regulatory framework, large patient population.
- Asia-Pacific: Rapid growth driven by rising healthcare awareness and disposable incomes.
- On-Body Injectors: Dominant segment due to patient convenience.
- Diabetes Therapy: Largest therapy segment due to high prevalence.
- Home Care: Fastest-growing end-user segment due to patient preference for self-administration.
Wearable Injectors Industry Product Landscape
Wearable injectors are continuously evolving, with innovations focused on enhancing usability, minimizing discomfort, and improving drug delivery accuracy. Products are categorized into on-body and off-body injectors, each tailored to specific therapeutic needs and patient preferences. Key features include automatic dosing, reduced needle size, improved ergonomics, and smart device integration for data monitoring and medication reminders. The incorporation of advanced materials and micro-fluidic technologies enhances delivery precision and reduces the risk of complications. Unique selling propositions often emphasize ease of use, portability, and improved patient compliance compared to traditional injection methods.
Key Drivers, Barriers & Challenges in Wearable Injectors Industry
Key Drivers:
- Increasing prevalence of chronic diseases requiring regular injections.
- Growing preference for self-administered therapies, enhancing patient compliance.
- Technological advancements leading to improved device design and functionality.
- Favorable regulatory landscape encouraging innovation and market entry.
Challenges & Restraints:
- High initial investment costs for device development and manufacturing.
- Stringent regulatory approvals posing barriers to market entry.
- Potential for technical malfunctions and safety concerns impacting adoption.
- Competition from established drug delivery methods.
- Supply chain disruptions and material shortages impacting production.
Emerging Opportunities in Wearable Injectors Industry
Emerging opportunities lie in expanding into untapped markets, particularly in developing countries with increasing healthcare access. The development of next-generation wearable injectors with advanced features such as AI-powered dosing and integrated health monitoring capabilities presents significant potential. There is also growing interest in integrating wearable injectors with other healthcare technologies, such as telemedicine platforms, to provide comprehensive patient care. Personalized medicine applications, tailoring drug delivery to individual patient needs, represent a promising avenue for future growth.
Growth Accelerators in the Wearable Injectors Industry Industry
Technological advancements, such as the integration of smart sensors, improved micro-fluidic technology, and advanced materials, are driving innovation and enhancing device performance. Strategic partnerships between pharmaceutical companies and device manufacturers are accelerating product development and market access. Market expansion strategies targeting emerging markets with high prevalence of chronic diseases offer significant growth potential. Furthermore, advancements in biocompatible materials are improving patient safety and comfort, enhancing device acceptance.
Key Players Shaping the Wearable Injectors Industry Market
- Becton Dickinson and Company
- West Pharmaceutical Services inc
- Ypsomed
- Buhler motor gmbh
- Amgen Inc
- Sensile Medical
- Dexcom Inc
- Insulet Corporation
- Tandem Diabetes Care Inc
- Eitan Medical
- Stevanato Group
- Enable Injections
- United Therapeutics (Steadymed Therapeutics)
Notable Milestones in Wearable Injectors Industry Sector
- June 2022: AbbVie received US FDA approval for SKYRIZI (risankizumab-rzaa), utilizing an On-Body Injector (OBI), marking a significant advancement in Crohn's disease treatment.
- February 2022: Enable Injections secured USD 215 million in funding to develop its enFuse subcutaneous drug delivery system, demonstrating investor confidence in the technology.
In-Depth Wearable Injectors Industry Market Outlook
The Wearable Injectors market is poised for substantial growth, driven by continuous technological advancements, rising prevalence of chronic diseases, and growing demand for patient-centric solutions. The focus on improving device usability, safety, and efficacy will further drive market penetration. Strategic collaborations and mergers and acquisitions will reshape the competitive landscape, creating opportunities for innovation and expansion. The increasing integration of wearable injectors with smart health technologies will enhance patient monitoring and create new revenue streams for market players. The long-term outlook remains positive, with significant potential for growth across various therapeutic areas and geographical regions.
Wearable Injectors Industry Segmentation
-
1. Type
- 1.1. On-Body Injectors
- 1.2. Off-Body Injectors
-
2. Therapy
- 2.1. Oncology
- 2.2. Autoimmune Disease
- 2.3. Diabetes
- 2.4. Cardiovascular Disease
- 2.5. Others
-
3. End User
- 3.1. Hospitals and Clinics
- 3.2. Home Care
- 3.3. Others
Wearable Injectors Industry Segmentation By Geography
-
1. North America
- 1.1. United States
- 1.2. Canada
- 1.3. Mexico
-
2. Europe
- 2.1. Germany
- 2.2. United Kingdom
- 2.3. France
- 2.4. Italy
- 2.5. Spain
- 2.6. Rest of Europe
-
3. Asia Pacific
- 3.1. China
- 3.2. Japan
- 3.3. India
- 3.4. Australia
- 3.5. South Korea
- 3.6. Rest of Asia Pacific
-
4. Middle East and Africa
- 4.1. GCC
- 4.2. South Africa
- 4.3. Rest of Middle East and Africa
-
5. South America
- 5.1. Brazil
- 5.2. Argentina
- 5.3. Rest of South America
Wearable Injectors Industry REPORT HIGHLIGHTS
| Aspects | Details |
|---|---|
| Study Period | 2019-2033 |
| Base Year | 2024 |
| Estimated Year | 2025 |
| Forecast Period | 2025-2033 |
| Historical Period | 2019-2024 |
| Growth Rate | CAGR of 10.40% from 2019-2033 |
| Segmentation |
|
Table of Contents
- 1. Introduction
- 1.1. Research Scope
- 1.2. Market Segmentation
- 1.3. Research Methodology
- 1.4. Definitions and Assumptions
- 2. Executive Summary
- 2.1. Introduction
- 3. Market Dynamics
- 3.1. Introduction
- 3.2. Market Drivers
- 3.2.1. Growing Prevalence of Chronic Diseases; Technological Advancements; Increasing Concern over the Hazards and Limitations Related to Needle stick
- 3.3. Market Restrains
- 3.3.1. Preference for Alternative Drug Delivery Modes; Unfavorable Reimbursement Structure in Developing Countries
- 3.4. Market Trends
- 3.4.1. Oncology Segment is Expected to Hold Significant Market Share Over the Forecast Period
- 4. Market Factor Analysis
- 4.1. Porters Five Forces
- 4.2. Supply/Value Chain
- 4.3. PESTEL analysis
- 4.4. Market Entropy
- 4.5. Patent/Trademark Analysis
- 5. Global Wearable Injectors Industry Analysis, Insights and Forecast, 2019-2031
- 5.1. Market Analysis, Insights and Forecast - by Type
- 5.1.1. On-Body Injectors
- 5.1.2. Off-Body Injectors
- 5.2. Market Analysis, Insights and Forecast - by Therapy
- 5.2.1. Oncology
- 5.2.2. Autoimmune Disease
- 5.2.3. Diabetes
- 5.2.4. Cardiovascular Disease
- 5.2.5. Others
- 5.3. Market Analysis, Insights and Forecast - by End User
- 5.3.1. Hospitals and Clinics
- 5.3.2. Home Care
- 5.3.3. Others
- 5.4. Market Analysis, Insights and Forecast - by Region
- 5.4.1. North America
- 5.4.2. Europe
- 5.4.3. Asia Pacific
- 5.4.4. Middle East and Africa
- 5.4.5. South America
- 5.1. Market Analysis, Insights and Forecast - by Type
- 6. North America Wearable Injectors Industry Analysis, Insights and Forecast, 2019-2031
- 6.1. Market Analysis, Insights and Forecast - by Type
- 6.1.1. On-Body Injectors
- 6.1.2. Off-Body Injectors
- 6.2. Market Analysis, Insights and Forecast - by Therapy
- 6.2.1. Oncology
- 6.2.2. Autoimmune Disease
- 6.2.3. Diabetes
- 6.2.4. Cardiovascular Disease
- 6.2.5. Others
- 6.3. Market Analysis, Insights and Forecast - by End User
- 6.3.1. Hospitals and Clinics
- 6.3.2. Home Care
- 6.3.3. Others
- 6.1. Market Analysis, Insights and Forecast - by Type
- 7. Europe Wearable Injectors Industry Analysis, Insights and Forecast, 2019-2031
- 7.1. Market Analysis, Insights and Forecast - by Type
- 7.1.1. On-Body Injectors
- 7.1.2. Off-Body Injectors
- 7.2. Market Analysis, Insights and Forecast - by Therapy
- 7.2.1. Oncology
- 7.2.2. Autoimmune Disease
- 7.2.3. Diabetes
- 7.2.4. Cardiovascular Disease
- 7.2.5. Others
- 7.3. Market Analysis, Insights and Forecast - by End User
- 7.3.1. Hospitals and Clinics
- 7.3.2. Home Care
- 7.3.3. Others
- 7.1. Market Analysis, Insights and Forecast - by Type
- 8. Asia Pacific Wearable Injectors Industry Analysis, Insights and Forecast, 2019-2031
- 8.1. Market Analysis, Insights and Forecast - by Type
- 8.1.1. On-Body Injectors
- 8.1.2. Off-Body Injectors
- 8.2. Market Analysis, Insights and Forecast - by Therapy
- 8.2.1. Oncology
- 8.2.2. Autoimmune Disease
- 8.2.3. Diabetes
- 8.2.4. Cardiovascular Disease
- 8.2.5. Others
- 8.3. Market Analysis, Insights and Forecast - by End User
- 8.3.1. Hospitals and Clinics
- 8.3.2. Home Care
- 8.3.3. Others
- 8.1. Market Analysis, Insights and Forecast - by Type
- 9. Middle East and Africa Wearable Injectors Industry Analysis, Insights and Forecast, 2019-2031
- 9.1. Market Analysis, Insights and Forecast - by Type
- 9.1.1. On-Body Injectors
- 9.1.2. Off-Body Injectors
- 9.2. Market Analysis, Insights and Forecast - by Therapy
- 9.2.1. Oncology
- 9.2.2. Autoimmune Disease
- 9.2.3. Diabetes
- 9.2.4. Cardiovascular Disease
- 9.2.5. Others
- 9.3. Market Analysis, Insights and Forecast - by End User
- 9.3.1. Hospitals and Clinics
- 9.3.2. Home Care
- 9.3.3. Others
- 9.1. Market Analysis, Insights and Forecast - by Type
- 10. South America Wearable Injectors Industry Analysis, Insights and Forecast, 2019-2031
- 10.1. Market Analysis, Insights and Forecast - by Type
- 10.1.1. On-Body Injectors
- 10.1.2. Off-Body Injectors
- 10.2. Market Analysis, Insights and Forecast - by Therapy
- 10.2.1. Oncology
- 10.2.2. Autoimmune Disease
- 10.2.3. Diabetes
- 10.2.4. Cardiovascular Disease
- 10.2.5. Others
- 10.3. Market Analysis, Insights and Forecast - by End User
- 10.3.1. Hospitals and Clinics
- 10.3.2. Home Care
- 10.3.3. Others
- 10.1. Market Analysis, Insights and Forecast - by Type
- 11. North America Wearable Injectors Industry Analysis, Insights and Forecast, 2019-2031
- 11.1. Market Analysis, Insights and Forecast - By Country/Sub-region
- 11.1.1 United States
- 11.1.2 Canada
- 11.1.3 Mexico
- 12. Europe Wearable Injectors Industry Analysis, Insights and Forecast, 2019-2031
- 12.1. Market Analysis, Insights and Forecast - By Country/Sub-region
- 12.1.1 Germany
- 12.1.2 United Kingdom
- 12.1.3 France
- 12.1.4 Italy
- 12.1.5 Spain
- 12.1.6 Rest of Europe
- 13. Asia Pacific Wearable Injectors Industry Analysis, Insights and Forecast, 2019-2031
- 13.1. Market Analysis, Insights and Forecast - By Country/Sub-region
- 13.1.1 China
- 13.1.2 Japan
- 13.1.3 India
- 13.1.4 Australia
- 13.1.5 South Korea
- 13.1.6 Rest of Asia Pacific
- 14. Middle East and Africa Wearable Injectors Industry Analysis, Insights and Forecast, 2019-2031
- 14.1. Market Analysis, Insights and Forecast - By Country/Sub-region
- 14.1.1 GCC
- 14.1.2 South Africa
- 14.1.3 Rest of Middle East and Africa
- 15. South America Wearable Injectors Industry Analysis, Insights and Forecast, 2019-2031
- 15.1. Market Analysis, Insights and Forecast - By Country/Sub-region
- 15.1.1 Brazil
- 15.1.2 Argentina
- 15.1.3 Rest of South America
- 16. Competitive Analysis
- 16.1. Global Market Share Analysis 2024
- 16.2. Company Profiles
- 16.2.1 Becton Dickinson and Company
- 16.2.1.1. Overview
- 16.2.1.2. Products
- 16.2.1.3. SWOT Analysis
- 16.2.1.4. Recent Developments
- 16.2.1.5. Financials (Based on Availability)
- 16.2.2 West Pharmaceutical Services inc
- 16.2.2.1. Overview
- 16.2.2.2. Products
- 16.2.2.3. SWOT Analysis
- 16.2.2.4. Recent Developments
- 16.2.2.5. Financials (Based on Availability)
- 16.2.3 Ypsomed
- 16.2.3.1. Overview
- 16.2.3.2. Products
- 16.2.3.3. SWOT Analysis
- 16.2.3.4. Recent Developments
- 16.2.3.5. Financials (Based on Availability)
- 16.2.4 Buhler motor gmbh
- 16.2.4.1. Overview
- 16.2.4.2. Products
- 16.2.4.3. SWOT Analysis
- 16.2.4.4. Recent Developments
- 16.2.4.5. Financials (Based on Availability)
- 16.2.5 Amgen Inc
- 16.2.5.1. Overview
- 16.2.5.2. Products
- 16.2.5.3. SWOT Analysis
- 16.2.5.4. Recent Developments
- 16.2.5.5. Financials (Based on Availability)
- 16.2.6 Sensile Medical
- 16.2.6.1. Overview
- 16.2.6.2. Products
- 16.2.6.3. SWOT Analysis
- 16.2.6.4. Recent Developments
- 16.2.6.5. Financials (Based on Availability)
- 16.2.7 Dexcom Inc
- 16.2.7.1. Overview
- 16.2.7.2. Products
- 16.2.7.3. SWOT Analysis
- 16.2.7.4. Recent Developments
- 16.2.7.5. Financials (Based on Availability)
- 16.2.8 Insulet Corporation
- 16.2.8.1. Overview
- 16.2.8.2. Products
- 16.2.8.3. SWOT Analysis
- 16.2.8.4. Recent Developments
- 16.2.8.5. Financials (Based on Availability)
- 16.2.9 Tandem Diabetes Care Inc
- 16.2.9.1. Overview
- 16.2.9.2. Products
- 16.2.9.3. SWOT Analysis
- 16.2.9.4. Recent Developments
- 16.2.9.5. Financials (Based on Availability)
- 16.2.10 Eitan Medical
- 16.2.10.1. Overview
- 16.2.10.2. Products
- 16.2.10.3. SWOT Analysis
- 16.2.10.4. Recent Developments
- 16.2.10.5. Financials (Based on Availability)
- 16.2.11 Stevanato Group
- 16.2.11.1. Overview
- 16.2.11.2. Products
- 16.2.11.3. SWOT Analysis
- 16.2.11.4. Recent Developments
- 16.2.11.5. Financials (Based on Availability)
- 16.2.12 Enable Injections
- 16.2.12.1. Overview
- 16.2.12.2. Products
- 16.2.12.3. SWOT Analysis
- 16.2.12.4. Recent Developments
- 16.2.12.5. Financials (Based on Availability)
- 16.2.13 United Therapeutics (Steadymed Therapeutics)
- 16.2.13.1. Overview
- 16.2.13.2. Products
- 16.2.13.3. SWOT Analysis
- 16.2.13.4. Recent Developments
- 16.2.13.5. Financials (Based on Availability)
- 16.2.1 Becton Dickinson and Company
List of Figures
- Figure 1: Global Wearable Injectors Industry Revenue Breakdown (Million, %) by Region 2024 & 2032
- Figure 2: Global Wearable Injectors Industry Volume Breakdown (K Unit, %) by Region 2024 & 2032
- Figure 3: North America Wearable Injectors Industry Revenue (Million), by Country 2024 & 2032
- Figure 4: North America Wearable Injectors Industry Volume (K Unit), by Country 2024 & 2032
- Figure 5: North America Wearable Injectors Industry Revenue Share (%), by Country 2024 & 2032
- Figure 6: North America Wearable Injectors Industry Volume Share (%), by Country 2024 & 2032
- Figure 7: Europe Wearable Injectors Industry Revenue (Million), by Country 2024 & 2032
- Figure 8: Europe Wearable Injectors Industry Volume (K Unit), by Country 2024 & 2032
- Figure 9: Europe Wearable Injectors Industry Revenue Share (%), by Country 2024 & 2032
- Figure 10: Europe Wearable Injectors Industry Volume Share (%), by Country 2024 & 2032
- Figure 11: Asia Pacific Wearable Injectors Industry Revenue (Million), by Country 2024 & 2032
- Figure 12: Asia Pacific Wearable Injectors Industry Volume (K Unit), by Country 2024 & 2032
- Figure 13: Asia Pacific Wearable Injectors Industry Revenue Share (%), by Country 2024 & 2032
- Figure 14: Asia Pacific Wearable Injectors Industry Volume Share (%), by Country 2024 & 2032
- Figure 15: Middle East and Africa Wearable Injectors Industry Revenue (Million), by Country 2024 & 2032
- Figure 16: Middle East and Africa Wearable Injectors Industry Volume (K Unit), by Country 2024 & 2032
- Figure 17: Middle East and Africa Wearable Injectors Industry Revenue Share (%), by Country 2024 & 2032
- Figure 18: Middle East and Africa Wearable Injectors Industry Volume Share (%), by Country 2024 & 2032
- Figure 19: South America Wearable Injectors Industry Revenue (Million), by Country 2024 & 2032
- Figure 20: South America Wearable Injectors Industry Volume (K Unit), by Country 2024 & 2032
- Figure 21: South America Wearable Injectors Industry Revenue Share (%), by Country 2024 & 2032
- Figure 22: South America Wearable Injectors Industry Volume Share (%), by Country 2024 & 2032
- Figure 23: North America Wearable Injectors Industry Revenue (Million), by Type 2024 & 2032
- Figure 24: North America Wearable Injectors Industry Volume (K Unit), by Type 2024 & 2032
- Figure 25: North America Wearable Injectors Industry Revenue Share (%), by Type 2024 & 2032
- Figure 26: North America Wearable Injectors Industry Volume Share (%), by Type 2024 & 2032
- Figure 27: North America Wearable Injectors Industry Revenue (Million), by Therapy 2024 & 2032
- Figure 28: North America Wearable Injectors Industry Volume (K Unit), by Therapy 2024 & 2032
- Figure 29: North America Wearable Injectors Industry Revenue Share (%), by Therapy 2024 & 2032
- Figure 30: North America Wearable Injectors Industry Volume Share (%), by Therapy 2024 & 2032
- Figure 31: North America Wearable Injectors Industry Revenue (Million), by End User 2024 & 2032
- Figure 32: North America Wearable Injectors Industry Volume (K Unit), by End User 2024 & 2032
- Figure 33: North America Wearable Injectors Industry Revenue Share (%), by End User 2024 & 2032
- Figure 34: North America Wearable Injectors Industry Volume Share (%), by End User 2024 & 2032
- Figure 35: North America Wearable Injectors Industry Revenue (Million), by Country 2024 & 2032
- Figure 36: North America Wearable Injectors Industry Volume (K Unit), by Country 2024 & 2032
- Figure 37: North America Wearable Injectors Industry Revenue Share (%), by Country 2024 & 2032
- Figure 38: North America Wearable Injectors Industry Volume Share (%), by Country 2024 & 2032
- Figure 39: Europe Wearable Injectors Industry Revenue (Million), by Type 2024 & 2032
- Figure 40: Europe Wearable Injectors Industry Volume (K Unit), by Type 2024 & 2032
- Figure 41: Europe Wearable Injectors Industry Revenue Share (%), by Type 2024 & 2032
- Figure 42: Europe Wearable Injectors Industry Volume Share (%), by Type 2024 & 2032
- Figure 43: Europe Wearable Injectors Industry Revenue (Million), by Therapy 2024 & 2032
- Figure 44: Europe Wearable Injectors Industry Volume (K Unit), by Therapy 2024 & 2032
- Figure 45: Europe Wearable Injectors Industry Revenue Share (%), by Therapy 2024 & 2032
- Figure 46: Europe Wearable Injectors Industry Volume Share (%), by Therapy 2024 & 2032
- Figure 47: Europe Wearable Injectors Industry Revenue (Million), by End User 2024 & 2032
- Figure 48: Europe Wearable Injectors Industry Volume (K Unit), by End User 2024 & 2032
- Figure 49: Europe Wearable Injectors Industry Revenue Share (%), by End User 2024 & 2032
- Figure 50: Europe Wearable Injectors Industry Volume Share (%), by End User 2024 & 2032
- Figure 51: Europe Wearable Injectors Industry Revenue (Million), by Country 2024 & 2032
- Figure 52: Europe Wearable Injectors Industry Volume (K Unit), by Country 2024 & 2032
- Figure 53: Europe Wearable Injectors Industry Revenue Share (%), by Country 2024 & 2032
- Figure 54: Europe Wearable Injectors Industry Volume Share (%), by Country 2024 & 2032
- Figure 55: Asia Pacific Wearable Injectors Industry Revenue (Million), by Type 2024 & 2032
- Figure 56: Asia Pacific Wearable Injectors Industry Volume (K Unit), by Type 2024 & 2032
- Figure 57: Asia Pacific Wearable Injectors Industry Revenue Share (%), by Type 2024 & 2032
- Figure 58: Asia Pacific Wearable Injectors Industry Volume Share (%), by Type 2024 & 2032
- Figure 59: Asia Pacific Wearable Injectors Industry Revenue (Million), by Therapy 2024 & 2032
- Figure 60: Asia Pacific Wearable Injectors Industry Volume (K Unit), by Therapy 2024 & 2032
- Figure 61: Asia Pacific Wearable Injectors Industry Revenue Share (%), by Therapy 2024 & 2032
- Figure 62: Asia Pacific Wearable Injectors Industry Volume Share (%), by Therapy 2024 & 2032
- Figure 63: Asia Pacific Wearable Injectors Industry Revenue (Million), by End User 2024 & 2032
- Figure 64: Asia Pacific Wearable Injectors Industry Volume (K Unit), by End User 2024 & 2032
- Figure 65: Asia Pacific Wearable Injectors Industry Revenue Share (%), by End User 2024 & 2032
- Figure 66: Asia Pacific Wearable Injectors Industry Volume Share (%), by End User 2024 & 2032
- Figure 67: Asia Pacific Wearable Injectors Industry Revenue (Million), by Country 2024 & 2032
- Figure 68: Asia Pacific Wearable Injectors Industry Volume (K Unit), by Country 2024 & 2032
- Figure 69: Asia Pacific Wearable Injectors Industry Revenue Share (%), by Country 2024 & 2032
- Figure 70: Asia Pacific Wearable Injectors Industry Volume Share (%), by Country 2024 & 2032
- Figure 71: Middle East and Africa Wearable Injectors Industry Revenue (Million), by Type 2024 & 2032
- Figure 72: Middle East and Africa Wearable Injectors Industry Volume (K Unit), by Type 2024 & 2032
- Figure 73: Middle East and Africa Wearable Injectors Industry Revenue Share (%), by Type 2024 & 2032
- Figure 74: Middle East and Africa Wearable Injectors Industry Volume Share (%), by Type 2024 & 2032
- Figure 75: Middle East and Africa Wearable Injectors Industry Revenue (Million), by Therapy 2024 & 2032
- Figure 76: Middle East and Africa Wearable Injectors Industry Volume (K Unit), by Therapy 2024 & 2032
- Figure 77: Middle East and Africa Wearable Injectors Industry Revenue Share (%), by Therapy 2024 & 2032
- Figure 78: Middle East and Africa Wearable Injectors Industry Volume Share (%), by Therapy 2024 & 2032
- Figure 79: Middle East and Africa Wearable Injectors Industry Revenue (Million), by End User 2024 & 2032
- Figure 80: Middle East and Africa Wearable Injectors Industry Volume (K Unit), by End User 2024 & 2032
- Figure 81: Middle East and Africa Wearable Injectors Industry Revenue Share (%), by End User 2024 & 2032
- Figure 82: Middle East and Africa Wearable Injectors Industry Volume Share (%), by End User 2024 & 2032
- Figure 83: Middle East and Africa Wearable Injectors Industry Revenue (Million), by Country 2024 & 2032
- Figure 84: Middle East and Africa Wearable Injectors Industry Volume (K Unit), by Country 2024 & 2032
- Figure 85: Middle East and Africa Wearable Injectors Industry Revenue Share (%), by Country 2024 & 2032
- Figure 86: Middle East and Africa Wearable Injectors Industry Volume Share (%), by Country 2024 & 2032
- Figure 87: South America Wearable Injectors Industry Revenue (Million), by Type 2024 & 2032
- Figure 88: South America Wearable Injectors Industry Volume (K Unit), by Type 2024 & 2032
- Figure 89: South America Wearable Injectors Industry Revenue Share (%), by Type 2024 & 2032
- Figure 90: South America Wearable Injectors Industry Volume Share (%), by Type 2024 & 2032
- Figure 91: South America Wearable Injectors Industry Revenue (Million), by Therapy 2024 & 2032
- Figure 92: South America Wearable Injectors Industry Volume (K Unit), by Therapy 2024 & 2032
- Figure 93: South America Wearable Injectors Industry Revenue Share (%), by Therapy 2024 & 2032
- Figure 94: South America Wearable Injectors Industry Volume Share (%), by Therapy 2024 & 2032
- Figure 95: South America Wearable Injectors Industry Revenue (Million), by End User 2024 & 2032
- Figure 96: South America Wearable Injectors Industry Volume (K Unit), by End User 2024 & 2032
- Figure 97: South America Wearable Injectors Industry Revenue Share (%), by End User 2024 & 2032
- Figure 98: South America Wearable Injectors Industry Volume Share (%), by End User 2024 & 2032
- Figure 99: South America Wearable Injectors Industry Revenue (Million), by Country 2024 & 2032
- Figure 100: South America Wearable Injectors Industry Volume (K Unit), by Country 2024 & 2032
- Figure 101: South America Wearable Injectors Industry Revenue Share (%), by Country 2024 & 2032
- Figure 102: South America Wearable Injectors Industry Volume Share (%), by Country 2024 & 2032
List of Tables
- Table 1: Global Wearable Injectors Industry Revenue Million Forecast, by Region 2019 & 2032
- Table 2: Global Wearable Injectors Industry Volume K Unit Forecast, by Region 2019 & 2032
- Table 3: Global Wearable Injectors Industry Revenue Million Forecast, by Type 2019 & 2032
- Table 4: Global Wearable Injectors Industry Volume K Unit Forecast, by Type 2019 & 2032
- Table 5: Global Wearable Injectors Industry Revenue Million Forecast, by Therapy 2019 & 2032
- Table 6: Global Wearable Injectors Industry Volume K Unit Forecast, by Therapy 2019 & 2032
- Table 7: Global Wearable Injectors Industry Revenue Million Forecast, by End User 2019 & 2032
- Table 8: Global Wearable Injectors Industry Volume K Unit Forecast, by End User 2019 & 2032
- Table 9: Global Wearable Injectors Industry Revenue Million Forecast, by Region 2019 & 2032
- Table 10: Global Wearable Injectors Industry Volume K Unit Forecast, by Region 2019 & 2032
- Table 11: Global Wearable Injectors Industry Revenue Million Forecast, by Country 2019 & 2032
- Table 12: Global Wearable Injectors Industry Volume K Unit Forecast, by Country 2019 & 2032
- Table 13: United States Wearable Injectors Industry Revenue (Million) Forecast, by Application 2019 & 2032
- Table 14: United States Wearable Injectors Industry Volume (K Unit) Forecast, by Application 2019 & 2032
- Table 15: Canada Wearable Injectors Industry Revenue (Million) Forecast, by Application 2019 & 2032
- Table 16: Canada Wearable Injectors Industry Volume (K Unit) Forecast, by Application 2019 & 2032
- Table 17: Mexico Wearable Injectors Industry Revenue (Million) Forecast, by Application 2019 & 2032
- Table 18: Mexico Wearable Injectors Industry Volume (K Unit) Forecast, by Application 2019 & 2032
- Table 19: Global Wearable Injectors Industry Revenue Million Forecast, by Country 2019 & 2032
- Table 20: Global Wearable Injectors Industry Volume K Unit Forecast, by Country 2019 & 2032
- Table 21: Germany Wearable Injectors Industry Revenue (Million) Forecast, by Application 2019 & 2032
- Table 22: Germany Wearable Injectors Industry Volume (K Unit) Forecast, by Application 2019 & 2032
- Table 23: United Kingdom Wearable Injectors Industry Revenue (Million) Forecast, by Application 2019 & 2032
- Table 24: United Kingdom Wearable Injectors Industry Volume (K Unit) Forecast, by Application 2019 & 2032
- Table 25: France Wearable Injectors Industry Revenue (Million) Forecast, by Application 2019 & 2032
- Table 26: France Wearable Injectors Industry Volume (K Unit) Forecast, by Application 2019 & 2032
- Table 27: Italy Wearable Injectors Industry Revenue (Million) Forecast, by Application 2019 & 2032
- Table 28: Italy Wearable Injectors Industry Volume (K Unit) Forecast, by Application 2019 & 2032
- Table 29: Spain Wearable Injectors Industry Revenue (Million) Forecast, by Application 2019 & 2032
- Table 30: Spain Wearable Injectors Industry Volume (K Unit) Forecast, by Application 2019 & 2032
- Table 31: Rest of Europe Wearable Injectors Industry Revenue (Million) Forecast, by Application 2019 & 2032
- Table 32: Rest of Europe Wearable Injectors Industry Volume (K Unit) Forecast, by Application 2019 & 2032
- Table 33: Global Wearable Injectors Industry Revenue Million Forecast, by Country 2019 & 2032
- Table 34: Global Wearable Injectors Industry Volume K Unit Forecast, by Country 2019 & 2032
- Table 35: China Wearable Injectors Industry Revenue (Million) Forecast, by Application 2019 & 2032
- Table 36: China Wearable Injectors Industry Volume (K Unit) Forecast, by Application 2019 & 2032
- Table 37: Japan Wearable Injectors Industry Revenue (Million) Forecast, by Application 2019 & 2032
- Table 38: Japan Wearable Injectors Industry Volume (K Unit) Forecast, by Application 2019 & 2032
- Table 39: India Wearable Injectors Industry Revenue (Million) Forecast, by Application 2019 & 2032
- Table 40: India Wearable Injectors Industry Volume (K Unit) Forecast, by Application 2019 & 2032
- Table 41: Australia Wearable Injectors Industry Revenue (Million) Forecast, by Application 2019 & 2032
- Table 42: Australia Wearable Injectors Industry Volume (K Unit) Forecast, by Application 2019 & 2032
- Table 43: South Korea Wearable Injectors Industry Revenue (Million) Forecast, by Application 2019 & 2032
- Table 44: South Korea Wearable Injectors Industry Volume (K Unit) Forecast, by Application 2019 & 2032
- Table 45: Rest of Asia Pacific Wearable Injectors Industry Revenue (Million) Forecast, by Application 2019 & 2032
- Table 46: Rest of Asia Pacific Wearable Injectors Industry Volume (K Unit) Forecast, by Application 2019 & 2032
- Table 47: Global Wearable Injectors Industry Revenue Million Forecast, by Country 2019 & 2032
- Table 48: Global Wearable Injectors Industry Volume K Unit Forecast, by Country 2019 & 2032
- Table 49: GCC Wearable Injectors Industry Revenue (Million) Forecast, by Application 2019 & 2032
- Table 50: GCC Wearable Injectors Industry Volume (K Unit) Forecast, by Application 2019 & 2032
- Table 51: South Africa Wearable Injectors Industry Revenue (Million) Forecast, by Application 2019 & 2032
- Table 52: South Africa Wearable Injectors Industry Volume (K Unit) Forecast, by Application 2019 & 2032
- Table 53: Rest of Middle East and Africa Wearable Injectors Industry Revenue (Million) Forecast, by Application 2019 & 2032
- Table 54: Rest of Middle East and Africa Wearable Injectors Industry Volume (K Unit) Forecast, by Application 2019 & 2032
- Table 55: Global Wearable Injectors Industry Revenue Million Forecast, by Country 2019 & 2032
- Table 56: Global Wearable Injectors Industry Volume K Unit Forecast, by Country 2019 & 2032
- Table 57: Brazil Wearable Injectors Industry Revenue (Million) Forecast, by Application 2019 & 2032
- Table 58: Brazil Wearable Injectors Industry Volume (K Unit) Forecast, by Application 2019 & 2032
- Table 59: Argentina Wearable Injectors Industry Revenue (Million) Forecast, by Application 2019 & 2032
- Table 60: Argentina Wearable Injectors Industry Volume (K Unit) Forecast, by Application 2019 & 2032
- Table 61: Rest of South America Wearable Injectors Industry Revenue (Million) Forecast, by Application 2019 & 2032
- Table 62: Rest of South America Wearable Injectors Industry Volume (K Unit) Forecast, by Application 2019 & 2032
- Table 63: Global Wearable Injectors Industry Revenue Million Forecast, by Type 2019 & 2032
- Table 64: Global Wearable Injectors Industry Volume K Unit Forecast, by Type 2019 & 2032
- Table 65: Global Wearable Injectors Industry Revenue Million Forecast, by Therapy 2019 & 2032
- Table 66: Global Wearable Injectors Industry Volume K Unit Forecast, by Therapy 2019 & 2032
- Table 67: Global Wearable Injectors Industry Revenue Million Forecast, by End User 2019 & 2032
- Table 68: Global Wearable Injectors Industry Volume K Unit Forecast, by End User 2019 & 2032
- Table 69: Global Wearable Injectors Industry Revenue Million Forecast, by Country 2019 & 2032
- Table 70: Global Wearable Injectors Industry Volume K Unit Forecast, by Country 2019 & 2032
- Table 71: United States Wearable Injectors Industry Revenue (Million) Forecast, by Application 2019 & 2032
- Table 72: United States Wearable Injectors Industry Volume (K Unit) Forecast, by Application 2019 & 2032
- Table 73: Canada Wearable Injectors Industry Revenue (Million) Forecast, by Application 2019 & 2032
- Table 74: Canada Wearable Injectors Industry Volume (K Unit) Forecast, by Application 2019 & 2032
- Table 75: Mexico Wearable Injectors Industry Revenue (Million) Forecast, by Application 2019 & 2032
- Table 76: Mexico Wearable Injectors Industry Volume (K Unit) Forecast, by Application 2019 & 2032
- Table 77: Global Wearable Injectors Industry Revenue Million Forecast, by Type 2019 & 2032
- Table 78: Global Wearable Injectors Industry Volume K Unit Forecast, by Type 2019 & 2032
- Table 79: Global Wearable Injectors Industry Revenue Million Forecast, by Therapy 2019 & 2032
- Table 80: Global Wearable Injectors Industry Volume K Unit Forecast, by Therapy 2019 & 2032
- Table 81: Global Wearable Injectors Industry Revenue Million Forecast, by End User 2019 & 2032
- Table 82: Global Wearable Injectors Industry Volume K Unit Forecast, by End User 2019 & 2032
- Table 83: Global Wearable Injectors Industry Revenue Million Forecast, by Country 2019 & 2032
- Table 84: Global Wearable Injectors Industry Volume K Unit Forecast, by Country 2019 & 2032
- Table 85: Germany Wearable Injectors Industry Revenue (Million) Forecast, by Application 2019 & 2032
- Table 86: Germany Wearable Injectors Industry Volume (K Unit) Forecast, by Application 2019 & 2032
- Table 87: United Kingdom Wearable Injectors Industry Revenue (Million) Forecast, by Application 2019 & 2032
- Table 88: United Kingdom Wearable Injectors Industry Volume (K Unit) Forecast, by Application 2019 & 2032
- Table 89: France Wearable Injectors Industry Revenue (Million) Forecast, by Application 2019 & 2032
- Table 90: France Wearable Injectors Industry Volume (K Unit) Forecast, by Application 2019 & 2032
- Table 91: Italy Wearable Injectors Industry Revenue (Million) Forecast, by Application 2019 & 2032
- Table 92: Italy Wearable Injectors Industry Volume (K Unit) Forecast, by Application 2019 & 2032
- Table 93: Spain Wearable Injectors Industry Revenue (Million) Forecast, by Application 2019 & 2032
- Table 94: Spain Wearable Injectors Industry Volume (K Unit) Forecast, by Application 2019 & 2032
- Table 95: Rest of Europe Wearable Injectors Industry Revenue (Million) Forecast, by Application 2019 & 2032
- Table 96: Rest of Europe Wearable Injectors Industry Volume (K Unit) Forecast, by Application 2019 & 2032
- Table 97: Global Wearable Injectors Industry Revenue Million Forecast, by Type 2019 & 2032
- Table 98: Global Wearable Injectors Industry Volume K Unit Forecast, by Type 2019 & 2032
- Table 99: Global Wearable Injectors Industry Revenue Million Forecast, by Therapy 2019 & 2032
- Table 100: Global Wearable Injectors Industry Volume K Unit Forecast, by Therapy 2019 & 2032
- Table 101: Global Wearable Injectors Industry Revenue Million Forecast, by End User 2019 & 2032
- Table 102: Global Wearable Injectors Industry Volume K Unit Forecast, by End User 2019 & 2032
- Table 103: Global Wearable Injectors Industry Revenue Million Forecast, by Country 2019 & 2032
- Table 104: Global Wearable Injectors Industry Volume K Unit Forecast, by Country 2019 & 2032
- Table 105: China Wearable Injectors Industry Revenue (Million) Forecast, by Application 2019 & 2032
- Table 106: China Wearable Injectors Industry Volume (K Unit) Forecast, by Application 2019 & 2032
- Table 107: Japan Wearable Injectors Industry Revenue (Million) Forecast, by Application 2019 & 2032
- Table 108: Japan Wearable Injectors Industry Volume (K Unit) Forecast, by Application 2019 & 2032
- Table 109: India Wearable Injectors Industry Revenue (Million) Forecast, by Application 2019 & 2032
- Table 110: India Wearable Injectors Industry Volume (K Unit) Forecast, by Application 2019 & 2032
- Table 111: Australia Wearable Injectors Industry Revenue (Million) Forecast, by Application 2019 & 2032
- Table 112: Australia Wearable Injectors Industry Volume (K Unit) Forecast, by Application 2019 & 2032
- Table 113: South Korea Wearable Injectors Industry Revenue (Million) Forecast, by Application 2019 & 2032
- Table 114: South Korea Wearable Injectors Industry Volume (K Unit) Forecast, by Application 2019 & 2032
- Table 115: Rest of Asia Pacific Wearable Injectors Industry Revenue (Million) Forecast, by Application 2019 & 2032
- Table 116: Rest of Asia Pacific Wearable Injectors Industry Volume (K Unit) Forecast, by Application 2019 & 2032
- Table 117: Global Wearable Injectors Industry Revenue Million Forecast, by Type 2019 & 2032
- Table 118: Global Wearable Injectors Industry Volume K Unit Forecast, by Type 2019 & 2032
- Table 119: Global Wearable Injectors Industry Revenue Million Forecast, by Therapy 2019 & 2032
- Table 120: Global Wearable Injectors Industry Volume K Unit Forecast, by Therapy 2019 & 2032
- Table 121: Global Wearable Injectors Industry Revenue Million Forecast, by End User 2019 & 2032
- Table 122: Global Wearable Injectors Industry Volume K Unit Forecast, by End User 2019 & 2032
- Table 123: Global Wearable Injectors Industry Revenue Million Forecast, by Country 2019 & 2032
- Table 124: Global Wearable Injectors Industry Volume K Unit Forecast, by Country 2019 & 2032
- Table 125: GCC Wearable Injectors Industry Revenue (Million) Forecast, by Application 2019 & 2032
- Table 126: GCC Wearable Injectors Industry Volume (K Unit) Forecast, by Application 2019 & 2032
- Table 127: South Africa Wearable Injectors Industry Revenue (Million) Forecast, by Application 2019 & 2032
- Table 128: South Africa Wearable Injectors Industry Volume (K Unit) Forecast, by Application 2019 & 2032
- Table 129: Rest of Middle East and Africa Wearable Injectors Industry Revenue (Million) Forecast, by Application 2019 & 2032
- Table 130: Rest of Middle East and Africa Wearable Injectors Industry Volume (K Unit) Forecast, by Application 2019 & 2032
- Table 131: Global Wearable Injectors Industry Revenue Million Forecast, by Type 2019 & 2032
- Table 132: Global Wearable Injectors Industry Volume K Unit Forecast, by Type 2019 & 2032
- Table 133: Global Wearable Injectors Industry Revenue Million Forecast, by Therapy 2019 & 2032
- Table 134: Global Wearable Injectors Industry Volume K Unit Forecast, by Therapy 2019 & 2032
- Table 135: Global Wearable Injectors Industry Revenue Million Forecast, by End User 2019 & 2032
- Table 136: Global Wearable Injectors Industry Volume K Unit Forecast, by End User 2019 & 2032
- Table 137: Global Wearable Injectors Industry Revenue Million Forecast, by Country 2019 & 2032
- Table 138: Global Wearable Injectors Industry Volume K Unit Forecast, by Country 2019 & 2032
- Table 139: Brazil Wearable Injectors Industry Revenue (Million) Forecast, by Application 2019 & 2032
- Table 140: Brazil Wearable Injectors Industry Volume (K Unit) Forecast, by Application 2019 & 2032
- Table 141: Argentina Wearable Injectors Industry Revenue (Million) Forecast, by Application 2019 & 2032
- Table 142: Argentina Wearable Injectors Industry Volume (K Unit) Forecast, by Application 2019 & 2032
- Table 143: Rest of South America Wearable Injectors Industry Revenue (Million) Forecast, by Application 2019 & 2032
- Table 144: Rest of South America Wearable Injectors Industry Volume (K Unit) Forecast, by Application 2019 & 2032
Frequently Asked Questions
1. What is the projected Compound Annual Growth Rate (CAGR) of the Wearable Injectors Industry?
The projected CAGR is approximately 10.40%.
2. Which companies are prominent players in the Wearable Injectors Industry?
Key companies in the market include Becton Dickinson and Company, West Pharmaceutical Services inc, Ypsomed, Buhler motor gmbh, Amgen Inc, Sensile Medical, Dexcom Inc, Insulet Corporation, Tandem Diabetes Care Inc, Eitan Medical, Stevanato Group, Enable Injections, United Therapeutics (Steadymed Therapeutics).
3. What are the main segments of the Wearable Injectors Industry?
The market segments include Type, Therapy, End User.
4. Can you provide details about the market size?
The market size is estimated to be USD XX Million as of 2022.
5. What are some drivers contributing to market growth?
Growing Prevalence of Chronic Diseases; Technological Advancements; Increasing Concern over the Hazards and Limitations Related to Needle stick.
6. What are the notable trends driving market growth?
Oncology Segment is Expected to Hold Significant Market Share Over the Forecast Period.
7. Are there any restraints impacting market growth?
Preference for Alternative Drug Delivery Modes; Unfavorable Reimbursement Structure in Developing Countries.
8. Can you provide examples of recent developments in the market?
June 2022: AbbVie received US FDA approval for SKYRIZI (risankizumab-rzaa) as the first and only specific interleukin-23 (IL-23) inhibitor for the treatment of adults with moderately to severely active Crohn's disease (CD). It can be self-administered by Subcutaneous Injection (SC) with an On-Body Injector (OBI).
9. What pricing options are available for accessing the report?
Pricing options include single-user, multi-user, and enterprise licenses priced at USD 4750, USD 5250, and USD 8750 respectively.
10. Is the market size provided in terms of value or volume?
The market size is provided in terms of value, measured in Million and volume, measured in K Unit.
11. Are there any specific market keywords associated with the report?
Yes, the market keyword associated with the report is "Wearable Injectors Industry," which aids in identifying and referencing the specific market segment covered.
12. How do I determine which pricing option suits my needs best?
The pricing options vary based on user requirements and access needs. Individual users may opt for single-user licenses, while businesses requiring broader access may choose multi-user or enterprise licenses for cost-effective access to the report.
13. Are there any additional resources or data provided in the Wearable Injectors Industry report?
While the report offers comprehensive insights, it's advisable to review the specific contents or supplementary materials provided to ascertain if additional resources or data are available.
14. How can I stay updated on further developments or reports in the Wearable Injectors Industry?
To stay informed about further developments, trends, and reports in the Wearable Injectors Industry, consider subscribing to industry newsletters, following relevant companies and organizations, or regularly checking reputable industry news sources and publications.
Methodology
Step 1 - Identification of Relevant Samples Size from Population Database


Step 2 - Approaches for Defining Global Market Size (Value, Volume* & Price*)

Note*: In applicable scenarios
Step 3 - Data Sources
Primary Research
- Web Analytics
- Survey Reports
- Research Institute
- Latest Research Reports
- Opinion Leaders
Secondary Research
- Annual Reports
- White Paper
- Latest Press Release
- Industry Association
- Paid Database
- Investor Presentations

Step 4 - Data Triangulation
Involves using different sources of information in order to increase the validity of a study
These sources are likely to be stakeholders in a program - participants, other researchers, program staff, other community members, and so on.
Then we put all data in single framework & apply various statistical tools to find out the dynamic on the market.
During the analysis stage, feedback from the stakeholder groups would be compared to determine areas of agreement as well as areas of divergence
