

Key Insights
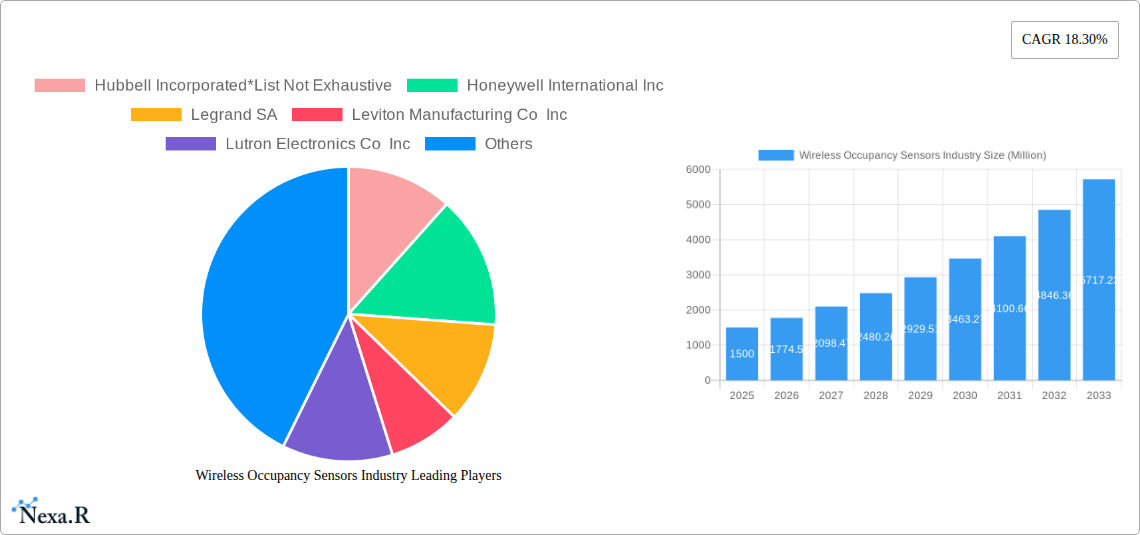
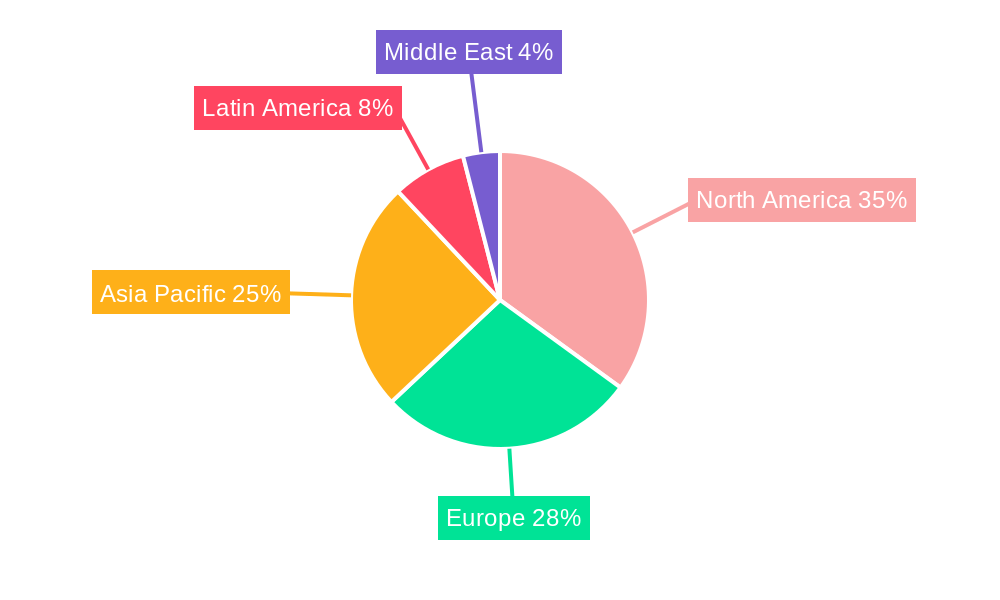
The Wireless Occupancy Sensors market is experiencing robust growth, projected to reach a significant market size by 2033. Driven by increasing energy efficiency mandates, smart building initiatives, and a rising focus on reducing operational costs, the market exhibits a compound annual growth rate (CAGR) of 18.30%. Key application segments include lighting control, HVAC (Heating, Ventilation, and Air Conditioning) systems, and security surveillance, with commercial buildings currently dominating the market share due to higher adoption rates of sophisticated building management systems. However, residential building applications are showing strong growth potential, fueled by the increasing affordability and accessibility of smart home technologies. The North American market, particularly the United States, holds a significant share due to advanced technological infrastructure and early adoption of smart building solutions. Europe and Asia Pacific are also key regions contributing to overall market growth, with Asia Pacific expected to witness substantial expansion driven by rapid urbanization and infrastructure development. While technological advancements and government regulations are propelling growth, challenges such as high initial investment costs and concerns about data security and privacy remain. Leading market players, including Hubbell Incorporated, Honeywell International Inc., Legrand SA, and others, are focusing on product innovation, strategic partnerships, and geographic expansion to maintain their market positions.
The diverse end-user industries – industrial, aerospace & defense, healthcare, and consumer electronics – present further avenues for growth. The industrial sector is particularly promising given the potential for optimizing energy consumption in large-scale facilities. Healthcare facilities are increasingly deploying wireless occupancy sensors for infection control and improved patient care. The continued integration of these sensors into Internet of Things (IoT) platforms and smart building management systems will significantly impact market expansion. Competitive landscape analysis reveals a mixture of established players and emerging companies, leading to innovative product offerings and competitive pricing, further driving market penetration. Future growth will be significantly impacted by the advancement of sensor technology, improved data analytics capabilities, and the integration of artificial intelligence for enhanced efficiency and functionality.
This comprehensive report provides a detailed analysis of the Wireless Occupancy Sensors market, encompassing market dynamics, growth trends, regional insights, product landscape, key players, and future outlook. The study period covers 2019-2033, with 2025 as the base and estimated year. This report is crucial for industry professionals, investors, and strategists seeking to understand and capitalize on the opportunities within this rapidly evolving sector. The market is segmented by application (lighting control, HVAC, security surveillance), building type (residential, commercial), and end-user industry (industrial, aerospace & defense, healthcare, consumer electronics, others). The total market size is projected to reach xx Million units by 2033.
Wireless Occupancy Sensors Industry Market Dynamics & Structure
The wireless occupancy sensor market exhibits a moderately concentrated structure, with key players like Hubbell Incorporated, Honeywell International Inc, Legrand SA, and others holding significant market share. Technological innovation, particularly in areas such as low-power consumption, improved accuracy, and enhanced connectivity (e.g., IoT integration), are major drivers. Stringent energy efficiency regulations globally are also fostering market growth. Competitive pressures stem from both established players and emerging entrants offering cost-effective solutions. Product substitutes, like traditional wired sensors, are losing market share due to the advantages of wireless technologies. The market is witnessing increased M&A activity, driven by the need for expansion into new markets and technologies.
- Market Concentration: Moderately concentrated, with top 5 players holding approximately xx% market share in 2025.
- Technological Innovation: Focus on low-power Bluetooth, Zigbee, and Z-Wave technologies; advancements in sensor accuracy and data analytics are key drivers.
- Regulatory Frameworks: Energy efficiency standards (e.g., LEED certifications) are driving demand.
- Competitive Substitutes: Traditional wired sensors are facing declining adoption rates.
- M&A Trends: Increased activity, primarily driven by strategic acquisitions of smaller, specialized firms. An estimated xx M&A deals occurred between 2019 and 2024.
- End-User Demographics: Growing adoption in both residential and commercial sectors, particularly in developed economies.
Wireless Occupancy Sensors Industry Growth Trends & Insights
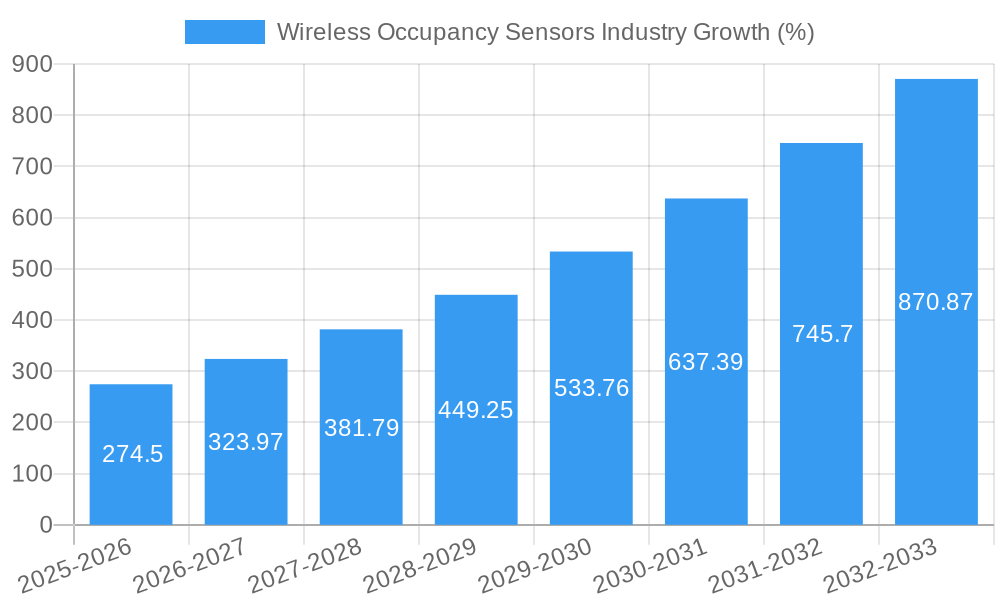
The wireless occupancy sensor market experienced significant growth between 2019 and 2024, driven primarily by increasing energy efficiency concerns and the rising adoption of smart building technologies. This trend is expected to continue throughout the forecast period (2025-2033), with a projected CAGR of xx%. Market penetration in the commercial sector is higher compared to the residential sector, although residential adoption is increasing rapidly. Technological advancements, such as the integration of AI and machine learning for improved accuracy and energy management, are further accelerating market growth. Shifting consumer preferences towards smart homes and buildings are fueling demand.
- Market Size Evolution: The market size grew from xx Million units in 2019 to xx Million units in 2024, and is projected to reach xx Million units by 2033.
- Adoption Rates: High adoption rate in commercial buildings, with residential adoption growing rapidly. Penetration rate in 2025 is estimated to be xx% in commercial buildings and xx% in residential buildings.
- Technological Disruptions: IoT integration, AI-powered functionalities, and improved energy efficiency are significant disruptive forces.
- Consumer Behavior Shifts: Increasing demand for smart home and building automation solutions.
Dominant Regions, Countries, or Segments in Wireless Occupancy Sensors Industry
North America currently holds the largest market share in the wireless occupancy sensor market, followed by Europe and Asia-Pacific. The dominance of North America is attributable to early adoption of smart building technologies and stringent energy efficiency regulations. Within the application segments, lighting control holds the largest share, driven by energy savings potential. Commercial buildings dominate the building type segment due to higher adoption rates and larger-scale installations. The industrial end-user industry exhibits high growth potential due to rising demand for automation and energy optimization in industrial settings.
- Key Drivers: Stringent energy efficiency regulations, government incentives, rising construction activity.
- Dominance Factors: North America's leadership is driven by early adoption and regulatory push.
- Growth Potential: Asia-Pacific presents significant growth opportunities due to increasing urbanization and infrastructure development.
- Market Share: North America holds xx% market share in 2025, followed by Europe (xx%) and Asia-Pacific (xx%).
Wireless Occupancy Sensors Industry Product Landscape
Wireless occupancy sensors are available in a variety of forms, including ultrasonic, infrared, and microwave sensors, each with unique strengths and weaknesses in terms of accuracy, range, and power consumption. Recent innovations focus on improving accuracy, extending battery life, and enhancing data analytics capabilities through IoT integration. Unique selling propositions include features such as advanced motion detection algorithms, integration with smart home ecosystems, and sophisticated data logging capabilities.
Key Drivers, Barriers & Challenges in Wireless Occupancy Sensors Industry
Key Drivers:
- Increasing demand for energy-efficient building solutions.
- Growing adoption of smart building technologies and IoT.
- Stringent government regulations promoting energy conservation.
Key Challenges & Restraints:
- High initial investment costs for large-scale deployments.
- Concerns regarding data security and privacy.
- Potential interference from other wireless devices.
- Supply chain disruptions impacting component availability and pricing. This has contributed to a xx% increase in sensor costs in 2024.
Emerging Opportunities in Wireless Occupancy Sensors Industry
- Expanding applications in healthcare and elderly care facilities.
- Integration with advanced building management systems (BMS).
- Development of more robust and energy-efficient sensor technologies.
- Growing demand for smart lighting solutions in commercial and residential buildings.
Growth Accelerators in the Wireless Occupancy Sensors Industry
Technological breakthroughs in low-power consumption and enhanced sensor accuracy are key growth accelerators. Strategic partnerships between sensor manufacturers and building automation companies are fostering wider adoption. Market expansion into emerging economies with significant growth potential is also playing a significant role in long-term growth.
Key Players Shaping the Wireless Occupancy Sensors Industry Market
- Hubbell Incorporated
- Honeywell International Inc
- Legrand SA
- Leviton Manufacturing Co Inc
- Lutron Electronics Co Inc
- Eaton Corporation PLC
- Johnson Controls Inc
- Koninklijke Philips NV
- Schneider Electric
- Acuity Brands Inc
- General Electric Company
Notable Milestones in Wireless Occupancy Sensors Industry Sector
- 2020: Launch of several low-power, long-range wireless occupancy sensors by leading manufacturers.
- 2021: Increased focus on integration with cloud-based building management systems.
- 2022: Significant investments in R&D for AI-powered sensor technologies.
- 2023: Several key mergers and acquisitions within the industry.
- 2024: Introduction of sensors with advanced motion detection algorithms and improved accuracy.
In-Depth Wireless Occupancy Sensors Industry Market Outlook
The wireless occupancy sensor market is poised for continued robust growth in the coming years, driven by ongoing technological advancements, increasing energy efficiency concerns, and expanding adoption across various sectors. Strategic partnerships, market expansion into emerging economies, and the development of innovative sensor technologies will further drive market expansion and create lucrative opportunities for players across the value chain.
Wireless Occupancy Sensors Industry Segmentation
-
1. Application
- 1.1. Lighting Control
- 1.2. HVAC
- 1.3. Security Surveillance
-
2. Building Type
- 2.1. Residential Buildings
- 2.2. Commercial Buildings
-
3. End-user Industry
- 3.1. Industrial
- 3.2. Aerospace & Defence
- 3.3. Healthcare
- 3.4. Consumer Electronics
- 3.5. Other End-user Industries
Wireless Occupancy Sensors Industry Segmentation By Geography
-
1. North America
- 1.1. United States
- 1.2. Canada
-
2. Europe
- 2.1. United Kingdom
- 2.2. France
- 2.3. Germany
- 2.4. Russia
- 2.5. Rest of Europe
-
3. Asia Pacific
- 3.1. China
- 3.2. Japan
- 3.3. India
- 3.4. Rest of Asia Pacific
-
4. Latin America
- 4.1. Brazil
- 4.2. Argentina
- 4.3. Maxico
- 4.4. Rest of Latin America
- 5. Middle East
-
6. Saudi Arabia
- 6.1. United Arab Emirates
- 6.2. South Africa
- 6.3. Rest of Middle East
Wireless Occupancy Sensors Industry REPORT HIGHLIGHTS
| Aspects | Details |
|---|---|
| Study Period | 2019-2033 |
| Base Year | 2024 |
| Estimated Year | 2025 |
| Forecast Period | 2025-2033 |
| Historical Period | 2019-2024 |
| Growth Rate | CAGR of 18.30% from 2019-2033 |
| Segmentation |
|
Table of Contents
- 1. Introduction
- 1.1. Research Scope
- 1.2. Market Segmentation
- 1.3. Research Methodology
- 1.4. Definitions and Assumptions
- 2. Executive Summary
- 2.1. Introduction
- 3. Market Dynamics
- 3.1. Introduction
- 3.2. Market Drivers
- 3.2.1. ; Growing Demand for Green Energy; Growing Demmand for Easily Installable and Interoperable devices
- 3.3. Market Restrains
- 3.3.1. ; False Triggering of Switches
- 3.4. Market Trends
- 3.4.1. Smart City Initiatives to Stimulate the Growth of Wireless Occupancy Sensor Market
- 4. Market Factor Analysis
- 4.1. Porters Five Forces
- 4.2. Supply/Value Chain
- 4.3. PESTEL analysis
- 4.4. Market Entropy
- 4.5. Patent/Trademark Analysis
- 5. Global Wireless Occupancy Sensors Industry Analysis, Insights and Forecast, 2019-2031
- 5.1. Market Analysis, Insights and Forecast - by Application
- 5.1.1. Lighting Control
- 5.1.2. HVAC
- 5.1.3. Security Surveillance
- 5.2. Market Analysis, Insights and Forecast - by Building Type
- 5.2.1. Residential Buildings
- 5.2.2. Commercial Buildings
- 5.3. Market Analysis, Insights and Forecast - by End-user Industry
- 5.3.1. Industrial
- 5.3.2. Aerospace & Defence
- 5.3.3. Healthcare
- 5.3.4. Consumer Electronics
- 5.3.5. Other End-user Industries
- 5.4. Market Analysis, Insights and Forecast - by Region
- 5.4.1. North America
- 5.4.2. Europe
- 5.4.3. Asia Pacific
- 5.4.4. Latin America
- 5.4.5. Middle East
- 5.4.6. Saudi Arabia
- 5.1. Market Analysis, Insights and Forecast - by Application
- 6. North America Wireless Occupancy Sensors Industry Analysis, Insights and Forecast, 2019-2031
- 6.1. Market Analysis, Insights and Forecast - by Application
- 6.1.1. Lighting Control
- 6.1.2. HVAC
- 6.1.3. Security Surveillance
- 6.2. Market Analysis, Insights and Forecast - by Building Type
- 6.2.1. Residential Buildings
- 6.2.2. Commercial Buildings
- 6.3. Market Analysis, Insights and Forecast - by End-user Industry
- 6.3.1. Industrial
- 6.3.2. Aerospace & Defence
- 6.3.3. Healthcare
- 6.3.4. Consumer Electronics
- 6.3.5. Other End-user Industries
- 6.1. Market Analysis, Insights and Forecast - by Application
- 7. Europe Wireless Occupancy Sensors Industry Analysis, Insights and Forecast, 2019-2031
- 7.1. Market Analysis, Insights and Forecast - by Application
- 7.1.1. Lighting Control
- 7.1.2. HVAC
- 7.1.3. Security Surveillance
- 7.2. Market Analysis, Insights and Forecast - by Building Type
- 7.2.1. Residential Buildings
- 7.2.2. Commercial Buildings
- 7.3. Market Analysis, Insights and Forecast - by End-user Industry
- 7.3.1. Industrial
- 7.3.2. Aerospace & Defence
- 7.3.3. Healthcare
- 7.3.4. Consumer Electronics
- 7.3.5. Other End-user Industries
- 7.1. Market Analysis, Insights and Forecast - by Application
- 8. Asia Pacific Wireless Occupancy Sensors Industry Analysis, Insights and Forecast, 2019-2031
- 8.1. Market Analysis, Insights and Forecast - by Application
- 8.1.1. Lighting Control
- 8.1.2. HVAC
- 8.1.3. Security Surveillance
- 8.2. Market Analysis, Insights and Forecast - by Building Type
- 8.2.1. Residential Buildings
- 8.2.2. Commercial Buildings
- 8.3. Market Analysis, Insights and Forecast - by End-user Industry
- 8.3.1. Industrial
- 8.3.2. Aerospace & Defence
- 8.3.3. Healthcare
- 8.3.4. Consumer Electronics
- 8.3.5. Other End-user Industries
- 8.1. Market Analysis, Insights and Forecast - by Application
- 9. Latin America Wireless Occupancy Sensors Industry Analysis, Insights and Forecast, 2019-2031
- 9.1. Market Analysis, Insights and Forecast - by Application
- 9.1.1. Lighting Control
- 9.1.2. HVAC
- 9.1.3. Security Surveillance
- 9.2. Market Analysis, Insights and Forecast - by Building Type
- 9.2.1. Residential Buildings
- 9.2.2. Commercial Buildings
- 9.3. Market Analysis, Insights and Forecast - by End-user Industry
- 9.3.1. Industrial
- 9.3.2. Aerospace & Defence
- 9.3.3. Healthcare
- 9.3.4. Consumer Electronics
- 9.3.5. Other End-user Industries
- 9.1. Market Analysis, Insights and Forecast - by Application
- 10. Middle East Wireless Occupancy Sensors Industry Analysis, Insights and Forecast, 2019-2031
- 10.1. Market Analysis, Insights and Forecast - by Application
- 10.1.1. Lighting Control
- 10.1.2. HVAC
- 10.1.3. Security Surveillance
- 10.2. Market Analysis, Insights and Forecast - by Building Type
- 10.2.1. Residential Buildings
- 10.2.2. Commercial Buildings
- 10.3. Market Analysis, Insights and Forecast - by End-user Industry
- 10.3.1. Industrial
- 10.3.2. Aerospace & Defence
- 10.3.3. Healthcare
- 10.3.4. Consumer Electronics
- 10.3.5. Other End-user Industries
- 10.1. Market Analysis, Insights and Forecast - by Application
- 11. Saudi Arabia Wireless Occupancy Sensors Industry Analysis, Insights and Forecast, 2019-2031
- 11.1. Market Analysis, Insights and Forecast - by Application
- 11.1.1. Lighting Control
- 11.1.2. HVAC
- 11.1.3. Security Surveillance
- 11.2. Market Analysis, Insights and Forecast - by Building Type
- 11.2.1. Residential Buildings
- 11.2.2. Commercial Buildings
- 11.3. Market Analysis, Insights and Forecast - by End-user Industry
- 11.3.1. Industrial
- 11.3.2. Aerospace & Defence
- 11.3.3. Healthcare
- 11.3.4. Consumer Electronics
- 11.3.5. Other End-user Industries
- 11.1. Market Analysis, Insights and Forecast - by Application
- 12. North America Wireless Occupancy Sensors Industry Analysis, Insights and Forecast, 2019-2031
- 12.1. Market Analysis, Insights and Forecast - By Country/Sub-region
- 12.1.1 United States
- 12.1.2 Canada
- 13. Europe Wireless Occupancy Sensors Industry Analysis, Insights and Forecast, 2019-2031
- 13.1. Market Analysis, Insights and Forecast - By Country/Sub-region
- 13.1.1 United Kingdom
- 13.1.2 France
- 13.1.3 Germany
- 13.1.4 Russia
- 13.1.5 Rest of Europe
- 14. Asia Pacific Wireless Occupancy Sensors Industry Analysis, Insights and Forecast, 2019-2031
- 14.1. Market Analysis, Insights and Forecast - By Country/Sub-region
- 14.1.1 China
- 14.1.2 Japan
- 14.1.3 India
- 14.1.4 Rest of Asia Pacific
- 15. Latin America Wireless Occupancy Sensors Industry Analysis, Insights and Forecast, 2019-2031
- 15.1. Market Analysis, Insights and Forecast - By Country/Sub-region
- 15.1.1 Brazil
- 15.1.2 Argentina
- 15.1.3 Maxico
- 15.1.4 Rest of Latin America
- 16. Middle East Wireless Occupancy Sensors Industry Analysis, Insights and Forecast, 2019-2031
- 16.1. Market Analysis, Insights and Forecast - By Country/Sub-region
- 16.1.1.
- 17. Saudi Arabia Wireless Occupancy Sensors Industry Analysis, Insights and Forecast, 2019-2031
- 17.1. Market Analysis, Insights and Forecast - By Country/Sub-region
- 17.1.1 United Arab Emirates
- 17.1.2 South Africa
- 17.1.3 Rest of Middle East
- 18. Competitive Analysis
- 18.1. Global Market Share Analysis 2024
- 18.2. Company Profiles
- 18.2.1 Hubbell Incorporated*List Not Exhaustive
- 18.2.1.1. Overview
- 18.2.1.2. Products
- 18.2.1.3. SWOT Analysis
- 18.2.1.4. Recent Developments
- 18.2.1.5. Financials (Based on Availability)
- 18.2.2 Honeywell International Inc
- 18.2.2.1. Overview
- 18.2.2.2. Products
- 18.2.2.3. SWOT Analysis
- 18.2.2.4. Recent Developments
- 18.2.2.5. Financials (Based on Availability)
- 18.2.3 Legrand SA
- 18.2.3.1. Overview
- 18.2.3.2. Products
- 18.2.3.3. SWOT Analysis
- 18.2.3.4. Recent Developments
- 18.2.3.5. Financials (Based on Availability)
- 18.2.4 Leviton Manufacturing Co Inc
- 18.2.4.1. Overview
- 18.2.4.2. Products
- 18.2.4.3. SWOT Analysis
- 18.2.4.4. Recent Developments
- 18.2.4.5. Financials (Based on Availability)
- 18.2.5 Lutron Electronics Co Inc
- 18.2.5.1. Overview
- 18.2.5.2. Products
- 18.2.5.3. SWOT Analysis
- 18.2.5.4. Recent Developments
- 18.2.5.5. Financials (Based on Availability)
- 18.2.6 Eaton Corporation PLC
- 18.2.6.1. Overview
- 18.2.6.2. Products
- 18.2.6.3. SWOT Analysis
- 18.2.6.4. Recent Developments
- 18.2.6.5. Financials (Based on Availability)
- 18.2.7 Johnson Controls Inc
- 18.2.7.1. Overview
- 18.2.7.2. Products
- 18.2.7.3. SWOT Analysis
- 18.2.7.4. Recent Developments
- 18.2.7.5. Financials (Based on Availability)
- 18.2.8 Koninklijke Philips NV
- 18.2.8.1. Overview
- 18.2.8.2. Products
- 18.2.8.3. SWOT Analysis
- 18.2.8.4. Recent Developments
- 18.2.8.5. Financials (Based on Availability)
- 18.2.9 Schneider Electric
- 18.2.9.1. Overview
- 18.2.9.2. Products
- 18.2.9.3. SWOT Analysis
- 18.2.9.4. Recent Developments
- 18.2.9.5. Financials (Based on Availability)
- 18.2.10 Acuity Brands Inc
- 18.2.10.1. Overview
- 18.2.10.2. Products
- 18.2.10.3. SWOT Analysis
- 18.2.10.4. Recent Developments
- 18.2.10.5. Financials (Based on Availability)
- 18.2.11 General Electric Company
- 18.2.11.1. Overview
- 18.2.11.2. Products
- 18.2.11.3. SWOT Analysis
- 18.2.11.4. Recent Developments
- 18.2.11.5. Financials (Based on Availability)
- 18.2.1 Hubbell Incorporated*List Not Exhaustive
List of Figures
- Figure 1: Global Wireless Occupancy Sensors Industry Revenue Breakdown (Million, %) by Region 2024 & 2032
- Figure 2: North America Wireless Occupancy Sensors Industry Revenue (Million), by Country 2024 & 2032
- Figure 3: North America Wireless Occupancy Sensors Industry Revenue Share (%), by Country 2024 & 2032
- Figure 4: Europe Wireless Occupancy Sensors Industry Revenue (Million), by Country 2024 & 2032
- Figure 5: Europe Wireless Occupancy Sensors Industry Revenue Share (%), by Country 2024 & 2032
- Figure 6: Asia Pacific Wireless Occupancy Sensors Industry Revenue (Million), by Country 2024 & 2032
- Figure 7: Asia Pacific Wireless Occupancy Sensors Industry Revenue Share (%), by Country 2024 & 2032
- Figure 8: Latin America Wireless Occupancy Sensors Industry Revenue (Million), by Country 2024 & 2032
- Figure 9: Latin America Wireless Occupancy Sensors Industry Revenue Share (%), by Country 2024 & 2032
- Figure 10: Middle East Wireless Occupancy Sensors Industry Revenue (Million), by Country 2024 & 2032
- Figure 11: Middle East Wireless Occupancy Sensors Industry Revenue Share (%), by Country 2024 & 2032
- Figure 12: Saudi Arabia Wireless Occupancy Sensors Industry Revenue (Million), by Country 2024 & 2032
- Figure 13: Saudi Arabia Wireless Occupancy Sensors Industry Revenue Share (%), by Country 2024 & 2032
- Figure 14: North America Wireless Occupancy Sensors Industry Revenue (Million), by Application 2024 & 2032
- Figure 15: North America Wireless Occupancy Sensors Industry Revenue Share (%), by Application 2024 & 2032
- Figure 16: North America Wireless Occupancy Sensors Industry Revenue (Million), by Building Type 2024 & 2032
- Figure 17: North America Wireless Occupancy Sensors Industry Revenue Share (%), by Building Type 2024 & 2032
- Figure 18: North America Wireless Occupancy Sensors Industry Revenue (Million), by End-user Industry 2024 & 2032
- Figure 19: North America Wireless Occupancy Sensors Industry Revenue Share (%), by End-user Industry 2024 & 2032
- Figure 20: North America Wireless Occupancy Sensors Industry Revenue (Million), by Country 2024 & 2032
- Figure 21: North America Wireless Occupancy Sensors Industry Revenue Share (%), by Country 2024 & 2032
- Figure 22: Europe Wireless Occupancy Sensors Industry Revenue (Million), by Application 2024 & 2032
- Figure 23: Europe Wireless Occupancy Sensors Industry Revenue Share (%), by Application 2024 & 2032
- Figure 24: Europe Wireless Occupancy Sensors Industry Revenue (Million), by Building Type 2024 & 2032
- Figure 25: Europe Wireless Occupancy Sensors Industry Revenue Share (%), by Building Type 2024 & 2032
- Figure 26: Europe Wireless Occupancy Sensors Industry Revenue (Million), by End-user Industry 2024 & 2032
- Figure 27: Europe Wireless Occupancy Sensors Industry Revenue Share (%), by End-user Industry 2024 & 2032
- Figure 28: Europe Wireless Occupancy Sensors Industry Revenue (Million), by Country 2024 & 2032
- Figure 29: Europe Wireless Occupancy Sensors Industry Revenue Share (%), by Country 2024 & 2032
- Figure 30: Asia Pacific Wireless Occupancy Sensors Industry Revenue (Million), by Application 2024 & 2032
- Figure 31: Asia Pacific Wireless Occupancy Sensors Industry Revenue Share (%), by Application 2024 & 2032
- Figure 32: Asia Pacific Wireless Occupancy Sensors Industry Revenue (Million), by Building Type 2024 & 2032
- Figure 33: Asia Pacific Wireless Occupancy Sensors Industry Revenue Share (%), by Building Type 2024 & 2032
- Figure 34: Asia Pacific Wireless Occupancy Sensors Industry Revenue (Million), by End-user Industry 2024 & 2032
- Figure 35: Asia Pacific Wireless Occupancy Sensors Industry Revenue Share (%), by End-user Industry 2024 & 2032
- Figure 36: Asia Pacific Wireless Occupancy Sensors Industry Revenue (Million), by Country 2024 & 2032
- Figure 37: Asia Pacific Wireless Occupancy Sensors Industry Revenue Share (%), by Country 2024 & 2032
- Figure 38: Latin America Wireless Occupancy Sensors Industry Revenue (Million), by Application 2024 & 2032
- Figure 39: Latin America Wireless Occupancy Sensors Industry Revenue Share (%), by Application 2024 & 2032
- Figure 40: Latin America Wireless Occupancy Sensors Industry Revenue (Million), by Building Type 2024 & 2032
- Figure 41: Latin America Wireless Occupancy Sensors Industry Revenue Share (%), by Building Type 2024 & 2032
- Figure 42: Latin America Wireless Occupancy Sensors Industry Revenue (Million), by End-user Industry 2024 & 2032
- Figure 43: Latin America Wireless Occupancy Sensors Industry Revenue Share (%), by End-user Industry 2024 & 2032
- Figure 44: Latin America Wireless Occupancy Sensors Industry Revenue (Million), by Country 2024 & 2032
- Figure 45: Latin America Wireless Occupancy Sensors Industry Revenue Share (%), by Country 2024 & 2032
- Figure 46: Middle East Wireless Occupancy Sensors Industry Revenue (Million), by Application 2024 & 2032
- Figure 47: Middle East Wireless Occupancy Sensors Industry Revenue Share (%), by Application 2024 & 2032
- Figure 48: Middle East Wireless Occupancy Sensors Industry Revenue (Million), by Building Type 2024 & 2032
- Figure 49: Middle East Wireless Occupancy Sensors Industry Revenue Share (%), by Building Type 2024 & 2032
- Figure 50: Middle East Wireless Occupancy Sensors Industry Revenue (Million), by End-user Industry 2024 & 2032
- Figure 51: Middle East Wireless Occupancy Sensors Industry Revenue Share (%), by End-user Industry 2024 & 2032
- Figure 52: Middle East Wireless Occupancy Sensors Industry Revenue (Million), by Country 2024 & 2032
- Figure 53: Middle East Wireless Occupancy Sensors Industry Revenue Share (%), by Country 2024 & 2032
- Figure 54: Saudi Arabia Wireless Occupancy Sensors Industry Revenue (Million), by Application 2024 & 2032
- Figure 55: Saudi Arabia Wireless Occupancy Sensors Industry Revenue Share (%), by Application 2024 & 2032
- Figure 56: Saudi Arabia Wireless Occupancy Sensors Industry Revenue (Million), by Building Type 2024 & 2032
- Figure 57: Saudi Arabia Wireless Occupancy Sensors Industry Revenue Share (%), by Building Type 2024 & 2032
- Figure 58: Saudi Arabia Wireless Occupancy Sensors Industry Revenue (Million), by End-user Industry 2024 & 2032
- Figure 59: Saudi Arabia Wireless Occupancy Sensors Industry Revenue Share (%), by End-user Industry 2024 & 2032
- Figure 60: Saudi Arabia Wireless Occupancy Sensors Industry Revenue (Million), by Country 2024 & 2032
- Figure 61: Saudi Arabia Wireless Occupancy Sensors Industry Revenue Share (%), by Country 2024 & 2032
List of Tables
- Table 1: Global Wireless Occupancy Sensors Industry Revenue Million Forecast, by Region 2019 & 2032
- Table 2: Global Wireless Occupancy Sensors Industry Revenue Million Forecast, by Application 2019 & 2032
- Table 3: Global Wireless Occupancy Sensors Industry Revenue Million Forecast, by Building Type 2019 & 2032
- Table 4: Global Wireless Occupancy Sensors Industry Revenue Million Forecast, by End-user Industry 2019 & 2032
- Table 5: Global Wireless Occupancy Sensors Industry Revenue Million Forecast, by Region 2019 & 2032
- Table 6: Global Wireless Occupancy Sensors Industry Revenue Million Forecast, by Country 2019 & 2032
- Table 7: United States Wireless Occupancy Sensors Industry Revenue (Million) Forecast, by Application 2019 & 2032
- Table 8: Canada Wireless Occupancy Sensors Industry Revenue (Million) Forecast, by Application 2019 & 2032
- Table 9: Global Wireless Occupancy Sensors Industry Revenue Million Forecast, by Country 2019 & 2032
- Table 10: United Kingdom Wireless Occupancy Sensors Industry Revenue (Million) Forecast, by Application 2019 & 2032
- Table 11: France Wireless Occupancy Sensors Industry Revenue (Million) Forecast, by Application 2019 & 2032
- Table 12: Germany Wireless Occupancy Sensors Industry Revenue (Million) Forecast, by Application 2019 & 2032
- Table 13: Russia Wireless Occupancy Sensors Industry Revenue (Million) Forecast, by Application 2019 & 2032
- Table 14: Rest of Europe Wireless Occupancy Sensors Industry Revenue (Million) Forecast, by Application 2019 & 2032
- Table 15: Global Wireless Occupancy Sensors Industry Revenue Million Forecast, by Country 2019 & 2032
- Table 16: China Wireless Occupancy Sensors Industry Revenue (Million) Forecast, by Application 2019 & 2032
- Table 17: Japan Wireless Occupancy Sensors Industry Revenue (Million) Forecast, by Application 2019 & 2032
- Table 18: India Wireless Occupancy Sensors Industry Revenue (Million) Forecast, by Application 2019 & 2032
- Table 19: Rest of Asia Pacific Wireless Occupancy Sensors Industry Revenue (Million) Forecast, by Application 2019 & 2032
- Table 20: Global Wireless Occupancy Sensors Industry Revenue Million Forecast, by Country 2019 & 2032
- Table 21: Brazil Wireless Occupancy Sensors Industry Revenue (Million) Forecast, by Application 2019 & 2032
- Table 22: Argentina Wireless Occupancy Sensors Industry Revenue (Million) Forecast, by Application 2019 & 2032
- Table 23: Maxico Wireless Occupancy Sensors Industry Revenue (Million) Forecast, by Application 2019 & 2032
- Table 24: Rest of Latin America Wireless Occupancy Sensors Industry Revenue (Million) Forecast, by Application 2019 & 2032
- Table 25: Global Wireless Occupancy Sensors Industry Revenue Million Forecast, by Country 2019 & 2032
- Table 26: Wireless Occupancy Sensors Industry Revenue (Million) Forecast, by Application 2019 & 2032
- Table 27: Global Wireless Occupancy Sensors Industry Revenue Million Forecast, by Country 2019 & 2032
- Table 28: United Arab Emirates Wireless Occupancy Sensors Industry Revenue (Million) Forecast, by Application 2019 & 2032
- Table 29: South Africa Wireless Occupancy Sensors Industry Revenue (Million) Forecast, by Application 2019 & 2032
- Table 30: Rest of Middle East Wireless Occupancy Sensors Industry Revenue (Million) Forecast, by Application 2019 & 2032
- Table 31: Global Wireless Occupancy Sensors Industry Revenue Million Forecast, by Application 2019 & 2032
- Table 32: Global Wireless Occupancy Sensors Industry Revenue Million Forecast, by Building Type 2019 & 2032
- Table 33: Global Wireless Occupancy Sensors Industry Revenue Million Forecast, by End-user Industry 2019 & 2032
- Table 34: Global Wireless Occupancy Sensors Industry Revenue Million Forecast, by Country 2019 & 2032
- Table 35: United States Wireless Occupancy Sensors Industry Revenue (Million) Forecast, by Application 2019 & 2032
- Table 36: Canada Wireless Occupancy Sensors Industry Revenue (Million) Forecast, by Application 2019 & 2032
- Table 37: Global Wireless Occupancy Sensors Industry Revenue Million Forecast, by Application 2019 & 2032
- Table 38: Global Wireless Occupancy Sensors Industry Revenue Million Forecast, by Building Type 2019 & 2032
- Table 39: Global Wireless Occupancy Sensors Industry Revenue Million Forecast, by End-user Industry 2019 & 2032
- Table 40: Global Wireless Occupancy Sensors Industry Revenue Million Forecast, by Country 2019 & 2032
- Table 41: United Kingdom Wireless Occupancy Sensors Industry Revenue (Million) Forecast, by Application 2019 & 2032
- Table 42: France Wireless Occupancy Sensors Industry Revenue (Million) Forecast, by Application 2019 & 2032
- Table 43: Germany Wireless Occupancy Sensors Industry Revenue (Million) Forecast, by Application 2019 & 2032
- Table 44: Russia Wireless Occupancy Sensors Industry Revenue (Million) Forecast, by Application 2019 & 2032
- Table 45: Rest of Europe Wireless Occupancy Sensors Industry Revenue (Million) Forecast, by Application 2019 & 2032
- Table 46: Global Wireless Occupancy Sensors Industry Revenue Million Forecast, by Application 2019 & 2032
- Table 47: Global Wireless Occupancy Sensors Industry Revenue Million Forecast, by Building Type 2019 & 2032
- Table 48: Global Wireless Occupancy Sensors Industry Revenue Million Forecast, by End-user Industry 2019 & 2032
- Table 49: Global Wireless Occupancy Sensors Industry Revenue Million Forecast, by Country 2019 & 2032
- Table 50: China Wireless Occupancy Sensors Industry Revenue (Million) Forecast, by Application 2019 & 2032
- Table 51: Japan Wireless Occupancy Sensors Industry Revenue (Million) Forecast, by Application 2019 & 2032
- Table 52: India Wireless Occupancy Sensors Industry Revenue (Million) Forecast, by Application 2019 & 2032
- Table 53: Rest of Asia Pacific Wireless Occupancy Sensors Industry Revenue (Million) Forecast, by Application 2019 & 2032
- Table 54: Global Wireless Occupancy Sensors Industry Revenue Million Forecast, by Application 2019 & 2032
- Table 55: Global Wireless Occupancy Sensors Industry Revenue Million Forecast, by Building Type 2019 & 2032
- Table 56: Global Wireless Occupancy Sensors Industry Revenue Million Forecast, by End-user Industry 2019 & 2032
- Table 57: Global Wireless Occupancy Sensors Industry Revenue Million Forecast, by Country 2019 & 2032
- Table 58: Brazil Wireless Occupancy Sensors Industry Revenue (Million) Forecast, by Application 2019 & 2032
- Table 59: Argentina Wireless Occupancy Sensors Industry Revenue (Million) Forecast, by Application 2019 & 2032
- Table 60: Maxico Wireless Occupancy Sensors Industry Revenue (Million) Forecast, by Application 2019 & 2032
- Table 61: Rest of Latin America Wireless Occupancy Sensors Industry Revenue (Million) Forecast, by Application 2019 & 2032
- Table 62: Global Wireless Occupancy Sensors Industry Revenue Million Forecast, by Application 2019 & 2032
- Table 63: Global Wireless Occupancy Sensors Industry Revenue Million Forecast, by Building Type 2019 & 2032
- Table 64: Global Wireless Occupancy Sensors Industry Revenue Million Forecast, by End-user Industry 2019 & 2032
- Table 65: Global Wireless Occupancy Sensors Industry Revenue Million Forecast, by Country 2019 & 2032
- Table 66: Global Wireless Occupancy Sensors Industry Revenue Million Forecast, by Application 2019 & 2032
- Table 67: Global Wireless Occupancy Sensors Industry Revenue Million Forecast, by Building Type 2019 & 2032
- Table 68: Global Wireless Occupancy Sensors Industry Revenue Million Forecast, by End-user Industry 2019 & 2032
- Table 69: Global Wireless Occupancy Sensors Industry Revenue Million Forecast, by Country 2019 & 2032
- Table 70: United Arab Emirates Wireless Occupancy Sensors Industry Revenue (Million) Forecast, by Application 2019 & 2032
- Table 71: South Africa Wireless Occupancy Sensors Industry Revenue (Million) Forecast, by Application 2019 & 2032
- Table 72: Rest of Middle East Wireless Occupancy Sensors Industry Revenue (Million) Forecast, by Application 2019 & 2032
Frequently Asked Questions
1. What is the projected Compound Annual Growth Rate (CAGR) of the Wireless Occupancy Sensors Industry?
The projected CAGR is approximately 18.30%.
2. Which companies are prominent players in the Wireless Occupancy Sensors Industry?
Key companies in the market include Hubbell Incorporated*List Not Exhaustive, Honeywell International Inc, Legrand SA, Leviton Manufacturing Co Inc, Lutron Electronics Co Inc, Eaton Corporation PLC, Johnson Controls Inc, Koninklijke Philips NV, Schneider Electric, Acuity Brands Inc, General Electric Company.
3. What are the main segments of the Wireless Occupancy Sensors Industry?
The market segments include Application, Building Type, End-user Industry.
4. Can you provide details about the market size?
The market size is estimated to be USD XX Million as of 2022.
5. What are some drivers contributing to market growth?
; Growing Demand for Green Energy; Growing Demmand for Easily Installable and Interoperable devices.
6. What are the notable trends driving market growth?
Smart City Initiatives to Stimulate the Growth of Wireless Occupancy Sensor Market.
7. Are there any restraints impacting market growth?
; False Triggering of Switches.
8. Can you provide examples of recent developments in the market?
N/A
9. What pricing options are available for accessing the report?
Pricing options include single-user, multi-user, and enterprise licenses priced at USD 4750, USD 5250, and USD 8750 respectively.
10. Is the market size provided in terms of value or volume?
The market size is provided in terms of value, measured in Million.
11. Are there any specific market keywords associated with the report?
Yes, the market keyword associated with the report is "Wireless Occupancy Sensors Industry," which aids in identifying and referencing the specific market segment covered.
12. How do I determine which pricing option suits my needs best?
The pricing options vary based on user requirements and access needs. Individual users may opt for single-user licenses, while businesses requiring broader access may choose multi-user or enterprise licenses for cost-effective access to the report.
13. Are there any additional resources or data provided in the Wireless Occupancy Sensors Industry report?
While the report offers comprehensive insights, it's advisable to review the specific contents or supplementary materials provided to ascertain if additional resources or data are available.
14. How can I stay updated on further developments or reports in the Wireless Occupancy Sensors Industry?
To stay informed about further developments, trends, and reports in the Wireless Occupancy Sensors Industry, consider subscribing to industry newsletters, following relevant companies and organizations, or regularly checking reputable industry news sources and publications.
Methodology
Step 1 - Identification of Relevant Samples Size from Population Database


Step 2 - Approaches for Defining Global Market Size (Value, Volume* & Price*)

Note*: In applicable scenarios
Step 3 - Data Sources
Primary Research
- Web Analytics
- Survey Reports
- Research Institute
- Latest Research Reports
- Opinion Leaders
Secondary Research
- Annual Reports
- White Paper
- Latest Press Release
- Industry Association
- Paid Database
- Investor Presentations

Step 4 - Data Triangulation
Involves using different sources of information in order to increase the validity of a study
These sources are likely to be stakeholders in a program - participants, other researchers, program staff, other community members, and so on.
Then we put all data in single framework & apply various statistical tools to find out the dynamic on the market.
During the analysis stage, feedback from the stakeholder groups would be compared to determine areas of agreement as well as areas of divergence
