

Key Insights
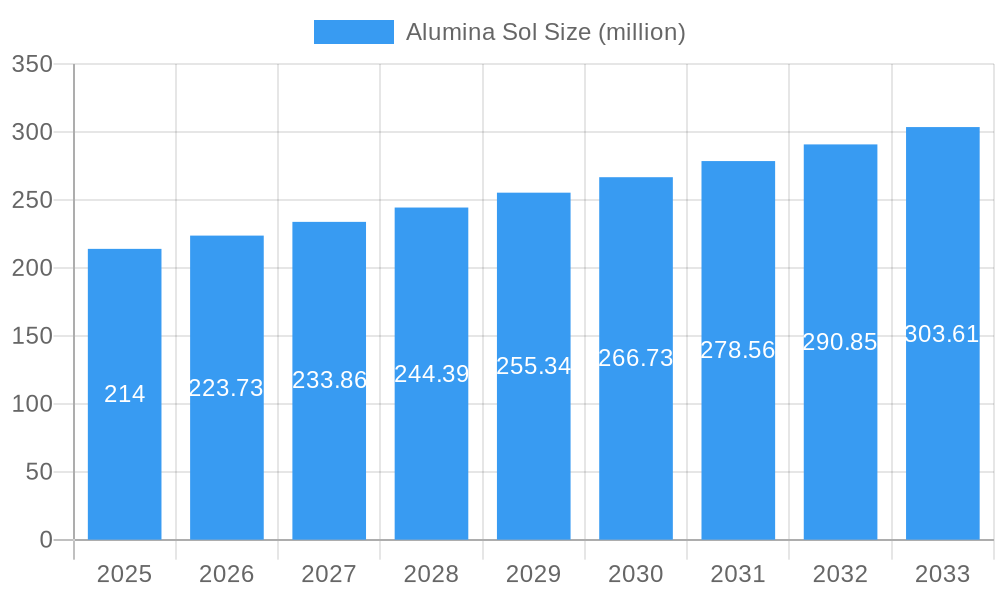
The alumina sol market, valued at $214 million in 2025, is projected to experience steady growth, driven by increasing demand from diverse sectors such as coatings, electronics, and catalysts. A compound annual growth rate (CAGR) of 4.5% from 2025 to 2033 indicates a substantial market expansion over the forecast period. This growth is fueled by the superior properties of alumina sol, including high purity, excellent dispersion, and its ability to enhance the performance of various materials. Key applications leverage its rheological properties for improved viscosity control and its contribution to enhanced hardness and wear resistance in coatings and ceramics. The market is witnessing a shift towards sustainable manufacturing processes, pushing innovation in alumina sol production methods to reduce environmental impact and improve energy efficiency. Competition among established players like Nissan Chemical, Sasol Performance Chemicals, and others, alongside emerging regional manufacturers, is shaping the market landscape, encouraging innovation and price competitiveness. The geographical distribution of the market is likely to reflect established industrial clusters and emerging economies with growing manufacturing sectors, with North America and Asia-Pacific expected to be key regions.
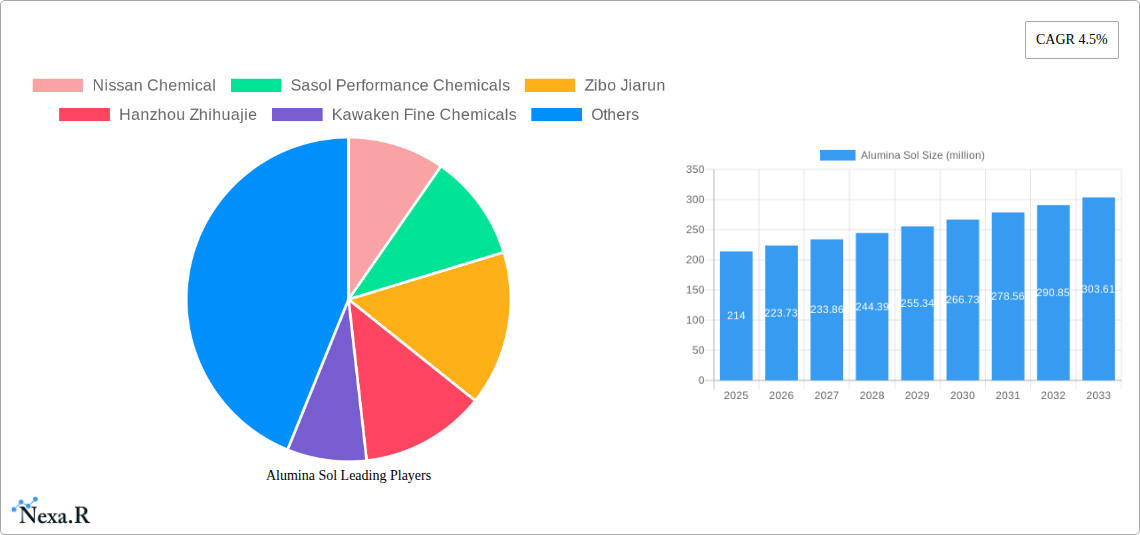
Alumina Sol Market Size (In Million)
The market's growth trajectory is influenced by several factors. While the consistent CAGR suggests stability, potential headwinds include fluctuations in raw material prices (e.g., aluminum) and stringent environmental regulations impacting manufacturing costs. Nevertheless, ongoing research and development in advanced materials and the continual improvement of alumina sol properties suggest a positive outlook. Segmentation within the market is likely based on application (e.g., coatings, catalysts, electronics), type (e.g., boehmite, pseudoboehmite), and geographical region. A deeper understanding of these segments and their specific growth drivers will be crucial for targeted market strategies and future predictions. The competitive landscape will see ongoing mergers, acquisitions, and product innovations to maintain a strong market presence.
Alumina Sol Company Market Share
Alumina Sol Market Report: 2019-2033 Forecast
This comprehensive report provides an in-depth analysis of the Alumina Sol market, encompassing market dynamics, growth trends, regional dominance, product landscape, challenges, opportunities, key players, and future outlook. The study period covers 2019-2033, with a base year of 2025 and a forecast period of 2025-2033. The report utilizes data from the historical period of 2019-2024, and provides valuable insights for industry professionals, investors, and strategic decision-makers in the parent market of chemical materials and the child market of advanced ceramics and coatings.
Alumina Sol Market Dynamics & Structure
The Alumina Sol market, valued at xx million units in 2025, exhibits a moderately concentrated structure. Key players such as Nissan Chemical, Sasol Performance Chemicals, and others control a significant market share, estimated at xx%. Technological innovation, particularly in nanotechnology and surface modification techniques, is a crucial driver. Stringent environmental regulations regarding volatile organic compound (VOC) emissions are shaping product development. Competitive substitutes include other metal oxide sols and polymeric binders. End-user demographics are diverse, spanning diverse applications across various industries. The past five years have witnessed xx M&A deals, indicating industry consolidation.
- Market Concentration: Moderately concentrated, with top 5 players holding xx% market share in 2025.
- Technological Innovation: Nanotechnology, surface modification, improved rheology control are key drivers.
- Regulatory Framework: Stringent environmental regulations impacting VOC emissions.
- Competitive Substitutes: Other metal oxide sols, polymeric binders.
- End-User Demographics: Diverse, spanning multiple industries including electronics, ceramics, and coatings.
- M&A Trends: xx M&A deals observed between 2019-2024, indicating consolidation.
- Innovation Barriers: High R&D costs, complex synthesis processes, stringent quality control requirements.
Alumina Sol Growth Trends & Insights
The Alumina Sol market experienced a CAGR of xx% during 2019-2024, reaching xx million units in 2024. Driven by increasing demand from the electronics and advanced materials sectors, the market is poised for continued growth, projected at a CAGR of xx% from 2025 to 2033. Technological disruptions, such as the development of high-purity alumina sols and improved dispersion techniques, are fueling adoption rates. Consumer behavior shifts toward sustainable and high-performance materials are further enhancing market expansion. Market penetration currently stands at xx% with projected increase to xx% by 2033.
Dominant Regions, Countries, or Segments in Alumina Sol
The Asia-Pacific region dominates the global Alumina Sol market, accounting for approximately xx% of the total market share in 2025. China, in particular, exhibits robust growth owing to its thriving electronics and ceramics industries and supportive government policies promoting advanced materials development. Strong infrastructure investments and rapid industrialization further contribute to the region's dominance. North America and Europe also represent substantial markets, with growth fueled by increasing demand from specific niche applications like high-tech coatings and specialized ceramics.
- Key Drivers in Asia-Pacific:
- Strong demand from electronics and ceramics industries.
- Supportive government policies and incentives.
- Robust infrastructure development.
- Rapid industrialization.
- Dominance Factors: Large manufacturing base, substantial demand from key end-use industries.
- Growth Potential: Continued expansion driven by technological advancements and increasing applications.
Alumina Sol Product Landscape
Alumina sol products are characterized by varying particle sizes, purities, and surface modifications tailored to specific applications. Innovations focus on enhancing stability, rheological properties, and dispersibility. High-purity alumina sols with enhanced dispersion capabilities are gaining traction. These advancements improve product performance in applications requiring precise control over film thickness and properties.
Key Drivers, Barriers & Challenges in Alumina Sol
Key Drivers: Growing demand from electronics, catalysts, and ceramics; advancements in nanotechnology leading to improved product properties; supportive government policies.
Key Challenges and Restraints: Fluctuations in raw material prices (e.g., alumina); stringent environmental regulations impacting production costs; intense competition among established and emerging players; supply chain disruptions causing price volatility. These factors cumulatively reduced market growth by an estimated xx% in 2023.
Emerging Opportunities in Alumina Sol
Untapped markets in emerging economies present significant opportunities. Innovative applications in advanced energy storage, biomedical devices, and water treatment are driving market expansion. Evolving consumer preferences toward environmentally friendly and high-performance materials are creating new avenues for growth.
Growth Accelerators in the Alumina Sol Industry
Technological breakthroughs in synthesis techniques and surface modification are accelerating market growth. Strategic partnerships between raw material suppliers and end-users are streamlining the supply chain. Expansion into new geographical regions and diversification into high-growth applications further fuel market expansion.
Key Players Shaping the Alumina Sol Market
- Nissan Chemical
- Sasol Performance Chemicals
- Zibo Jiarun
- Hanzhou Zhihuajie
- Kawaken Fine Chemicals
- JGC Catalysts and Chemicals
- Hangzhou Veking
- Zibo Jinqi
- Beijing Yataiaohua
- Zibo Senchi
- Nyacol Nanotechnologies
- Ranco
- Wesbond
Notable Milestones in Alumina Sol Sector
- 2021-Q3: Nissan Chemical launched a new high-purity alumina sol with enhanced dispersibility.
- 2022-Q1: Sasol Performance Chemicals announced a strategic partnership with a major ceramics manufacturer.
- 2023-Q2: Regulatory changes in Europe impacted production costs for several manufacturers. (Specific regulation not available).
In-Depth Alumina Sol Market Outlook
The Alumina Sol market is poised for robust growth, driven by ongoing technological advancements and increasing demand from diverse end-use industries. Strategic partnerships, expansion into emerging markets, and the development of innovative applications will shape market dynamics. This presents significant opportunities for both established players and emerging companies to capitalize on the growing demand for high-performance materials.
Alumina Sol Segmentation
-
1. Application
- 1.1. Catalysts
- 1.2. Refractories
- 1.3. Aluminosilicate Fiber
- 1.4. Others
-
2. Types
- 2.1. Under 20 nm
- 2.2. 20-50 nm
- 2.3. 50-100 nm
- 2.4. Above 100 nm
Alumina Sol Segmentation By Geography
-
1. North America
- 1.1. United States
- 1.2. Canada
- 1.3. Mexico
-
2. South America
- 2.1. Brazil
- 2.2. Argentina
- 2.3. Rest of South America
-
3. Europe
- 3.1. United Kingdom
- 3.2. Germany
- 3.3. France
- 3.4. Italy
- 3.5. Spain
- 3.6. Russia
- 3.7. Benelux
- 3.8. Nordics
- 3.9. Rest of Europe
-
4. Middle East & Africa
- 4.1. Turkey
- 4.2. Israel
- 4.3. GCC
- 4.4. North Africa
- 4.5. South Africa
- 4.6. Rest of Middle East & Africa
-
5. Asia Pacific
- 5.1. China
- 5.2. India
- 5.3. Japan
- 5.4. South Korea
- 5.5. ASEAN
- 5.6. Oceania
- 5.7. Rest of Asia Pacific
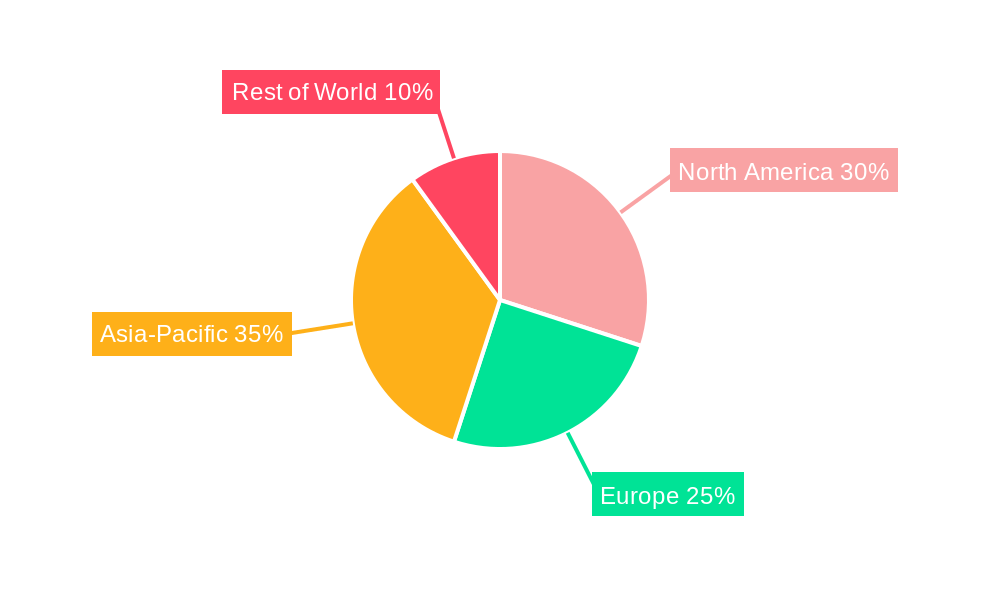
Alumina Sol Regional Market Share
Geographic Coverage of Alumina Sol
Alumina Sol REPORT HIGHLIGHTS
| Aspects | Details |
|---|---|
| Study Period | 2020-2034 |
| Base Year | 2025 |
| Estimated Year | 2026 |
| Forecast Period | 2026-2034 |
| Historical Period | 2020-2025 |
| Growth Rate | CAGR of 4.5% from 2020-2034 |
| Segmentation |
|
Table of Contents
- 1. Introduction
- 1.1. Research Scope
- 1.2. Market Segmentation
- 1.3. Research Objective
- 1.4. Definitions and Assumptions
- 2. Executive Summary
- 2.1. Market Snapshot
- 3. Market Dynamics
- 3.1. Market Drivers
- 3.2. Market Restrains
- 3.3. Market Trends
- 3.4. Market Opportunities
- 4. Market Factor Analysis
- 4.1. Porters Five Forces
- 4.1.1. Bargaining Power of Suppliers
- 4.1.2. Bargaining Power of Buyers
- 4.1.3. Threat of New Entrants
- 4.1.4. Threat of Substitutes
- 4.1.5. Competitive Rivalry
- 4.2. PESTEL analysis
- 4.3. BCG Analysis
- 4.3.1. Stars (High Growth, High Market Share)
- 4.3.2. Cash Cows (Low Growth, High Market Share)
- 4.3.3. Question Mark (High Growth, Low Market Share)
- 4.3.4. Dogs (Low Growth, Low Market Share)
- 4.4. Ansoff Matrix Analysis
- 4.5. Supply Chain Analysis
- 4.6. Regulatory Landscape
- 4.7. Current Market Potential and Opportunity Assessment (TAM–SAM–SOM Framework)
- 4.8. NRP Analyst Note
- 4.1. Porters Five Forces
- 5. Market Analysis, Insights and Forecast 2021-2033
- 5.1. Market Analysis, Insights and Forecast - by Application
- 5.1.1. Catalysts
- 5.1.2. Refractories
- 5.1.3. Aluminosilicate Fiber
- 5.1.4. Others
- 5.2. Market Analysis, Insights and Forecast - by Types
- 5.2.1. Under 20 nm
- 5.2.2. 20-50 nm
- 5.2.3. 50-100 nm
- 5.2.4. Above 100 nm
- 5.3. Market Analysis, Insights and Forecast - by Region
- 5.3.1. North America
- 5.3.2. South America
- 5.3.3. Europe
- 5.3.4. Middle East & Africa
- 5.3.5. Asia Pacific
- 5.1. Market Analysis, Insights and Forecast - by Application
- 6. Global Alumina Sol Analysis, Insights and Forecast, 2021-2033
- 6.1. Market Analysis, Insights and Forecast - by Application
- 6.1.1. Catalysts
- 6.1.2. Refractories
- 6.1.3. Aluminosilicate Fiber
- 6.1.4. Others
- 6.2. Market Analysis, Insights and Forecast - by Types
- 6.2.1. Under 20 nm
- 6.2.2. 20-50 nm
- 6.2.3. 50-100 nm
- 6.2.4. Above 100 nm
- 6.1. Market Analysis, Insights and Forecast - by Application
- 7. North America Alumina Sol Analysis, Insights and Forecast, 2020-2032
- 7.1. Market Analysis, Insights and Forecast - by Application
- 7.1.1. Catalysts
- 7.1.2. Refractories
- 7.1.3. Aluminosilicate Fiber
- 7.1.4. Others
- 7.2. Market Analysis, Insights and Forecast - by Types
- 7.2.1. Under 20 nm
- 7.2.2. 20-50 nm
- 7.2.3. 50-100 nm
- 7.2.4. Above 100 nm
- 7.1. Market Analysis, Insights and Forecast - by Application
- 8. South America Alumina Sol Analysis, Insights and Forecast, 2020-2032
- 8.1. Market Analysis, Insights and Forecast - by Application
- 8.1.1. Catalysts
- 8.1.2. Refractories
- 8.1.3. Aluminosilicate Fiber
- 8.1.4. Others
- 8.2. Market Analysis, Insights and Forecast - by Types
- 8.2.1. Under 20 nm
- 8.2.2. 20-50 nm
- 8.2.3. 50-100 nm
- 8.2.4. Above 100 nm
- 8.1. Market Analysis, Insights and Forecast - by Application
- 9. Europe Alumina Sol Analysis, Insights and Forecast, 2020-2032
- 9.1. Market Analysis, Insights and Forecast - by Application
- 9.1.1. Catalysts
- 9.1.2. Refractories
- 9.1.3. Aluminosilicate Fiber
- 9.1.4. Others
- 9.2. Market Analysis, Insights and Forecast - by Types
- 9.2.1. Under 20 nm
- 9.2.2. 20-50 nm
- 9.2.3. 50-100 nm
- 9.2.4. Above 100 nm
- 9.1. Market Analysis, Insights and Forecast - by Application
- 10. Middle East & Africa Alumina Sol Analysis, Insights and Forecast, 2020-2032
- 10.1. Market Analysis, Insights and Forecast - by Application
- 10.1.1. Catalysts
- 10.1.2. Refractories
- 10.1.3. Aluminosilicate Fiber
- 10.1.4. Others
- 10.2. Market Analysis, Insights and Forecast - by Types
- 10.2.1. Under 20 nm
- 10.2.2. 20-50 nm
- 10.2.3. 50-100 nm
- 10.2.4. Above 100 nm
- 10.1. Market Analysis, Insights and Forecast - by Application
- 11. Asia Pacific Alumina Sol Analysis, Insights and Forecast, 2020-2032
- 11.1. Market Analysis, Insights and Forecast - by Application
- 11.1.1. Catalysts
- 11.1.2. Refractories
- 11.1.3. Aluminosilicate Fiber
- 11.1.4. Others
- 11.2. Market Analysis, Insights and Forecast - by Types
- 11.2.1. Under 20 nm
- 11.2.2. 20-50 nm
- 11.2.3. 50-100 nm
- 11.2.4. Above 100 nm
- 11.1. Market Analysis, Insights and Forecast - by Application
- 12. Competitive Analysis
- 12.1. Company Profiles
- 12.1.1 Nissan Chemical
- 12.1.1.1. Company Overview
- 12.1.1.2. Products
- 12.1.1.3. Company Financials
- 12.1.1.4. SWOT Analysis
- 12.1.2 Sasol Performance Chemicals
- 12.1.2.1. Company Overview
- 12.1.2.2. Products
- 12.1.2.3. Company Financials
- 12.1.2.4. SWOT Analysis
- 12.1.3 Zibo Jiarun
- 12.1.3.1. Company Overview
- 12.1.3.2. Products
- 12.1.3.3. Company Financials
- 12.1.3.4. SWOT Analysis
- 12.1.4 Hanzhou Zhihuajie
- 12.1.4.1. Company Overview
- 12.1.4.2. Products
- 12.1.4.3. Company Financials
- 12.1.4.4. SWOT Analysis
- 12.1.5 Kawaken Fine Chemicals
- 12.1.5.1. Company Overview
- 12.1.5.2. Products
- 12.1.5.3. Company Financials
- 12.1.5.4. SWOT Analysis
- 12.1.6 JGC Catalysts and Chemicals
- 12.1.6.1. Company Overview
- 12.1.6.2. Products
- 12.1.6.3. Company Financials
- 12.1.6.4. SWOT Analysis
- 12.1.7 Hangzhou Veking
- 12.1.7.1. Company Overview
- 12.1.7.2. Products
- 12.1.7.3. Company Financials
- 12.1.7.4. SWOT Analysis
- 12.1.8 Zibo Jinqi
- 12.1.8.1. Company Overview
- 12.1.8.2. Products
- 12.1.8.3. Company Financials
- 12.1.8.4. SWOT Analysis
- 12.1.9 Beijing Yataiaohua
- 12.1.9.1. Company Overview
- 12.1.9.2. Products
- 12.1.9.3. Company Financials
- 12.1.9.4. SWOT Analysis
- 12.1.10 Zibo Senchi
- 12.1.10.1. Company Overview
- 12.1.10.2. Products
- 12.1.10.3. Company Financials
- 12.1.10.4. SWOT Analysis
- 12.1.11 Nyacol Nanotechnologies
- 12.1.11.1. Company Overview
- 12.1.11.2. Products
- 12.1.11.3. Company Financials
- 12.1.11.4. SWOT Analysis
- 12.1.12 Ranco
- 12.1.12.1. Company Overview
- 12.1.12.2. Products
- 12.1.12.3. Company Financials
- 12.1.12.4. SWOT Analysis
- 12.1.13 Wesbond
- 12.1.13.1. Company Overview
- 12.1.13.2. Products
- 12.1.13.3. Company Financials
- 12.1.13.4. SWOT Analysis
- 12.1.1 Nissan Chemical
- 12.2. Market Entropy
- 12.2.1 Company's Key Areas Served
- 12.2.2 Recent Developments
- 12.3. Company Market Share Analysis 2025
- 12.3.1 Top 5 Companies Market Share Analysis
- 12.3.2 Top 3 Companies Market Share Analysis
- 12.4. List of Potential Customers
- 13. Research Methodology
List of Figures
- Figure 1: Global Alumina Sol Revenue Breakdown (million, %) by Region 2025 & 2033
- Figure 2: North America Alumina Sol Revenue (million), by Application 2025 & 2033
- Figure 3: North America Alumina Sol Revenue Share (%), by Application 2025 & 2033
- Figure 4: North America Alumina Sol Revenue (million), by Types 2025 & 2033
- Figure 5: North America Alumina Sol Revenue Share (%), by Types 2025 & 2033
- Figure 6: North America Alumina Sol Revenue (million), by Country 2025 & 2033
- Figure 7: North America Alumina Sol Revenue Share (%), by Country 2025 & 2033
- Figure 8: South America Alumina Sol Revenue (million), by Application 2025 & 2033
- Figure 9: South America Alumina Sol Revenue Share (%), by Application 2025 & 2033
- Figure 10: South America Alumina Sol Revenue (million), by Types 2025 & 2033
- Figure 11: South America Alumina Sol Revenue Share (%), by Types 2025 & 2033
- Figure 12: South America Alumina Sol Revenue (million), by Country 2025 & 2033
- Figure 13: South America Alumina Sol Revenue Share (%), by Country 2025 & 2033
- Figure 14: Europe Alumina Sol Revenue (million), by Application 2025 & 2033
- Figure 15: Europe Alumina Sol Revenue Share (%), by Application 2025 & 2033
- Figure 16: Europe Alumina Sol Revenue (million), by Types 2025 & 2033
- Figure 17: Europe Alumina Sol Revenue Share (%), by Types 2025 & 2033
- Figure 18: Europe Alumina Sol Revenue (million), by Country 2025 & 2033
- Figure 19: Europe Alumina Sol Revenue Share (%), by Country 2025 & 2033
- Figure 20: Middle East & Africa Alumina Sol Revenue (million), by Application 2025 & 2033
- Figure 21: Middle East & Africa Alumina Sol Revenue Share (%), by Application 2025 & 2033
- Figure 22: Middle East & Africa Alumina Sol Revenue (million), by Types 2025 & 2033
- Figure 23: Middle East & Africa Alumina Sol Revenue Share (%), by Types 2025 & 2033
- Figure 24: Middle East & Africa Alumina Sol Revenue (million), by Country 2025 & 2033
- Figure 25: Middle East & Africa Alumina Sol Revenue Share (%), by Country 2025 & 2033
- Figure 26: Asia Pacific Alumina Sol Revenue (million), by Application 2025 & 2033
- Figure 27: Asia Pacific Alumina Sol Revenue Share (%), by Application 2025 & 2033
- Figure 28: Asia Pacific Alumina Sol Revenue (million), by Types 2025 & 2033
- Figure 29: Asia Pacific Alumina Sol Revenue Share (%), by Types 2025 & 2033
- Figure 30: Asia Pacific Alumina Sol Revenue (million), by Country 2025 & 2033
- Figure 31: Asia Pacific Alumina Sol Revenue Share (%), by Country 2025 & 2033
List of Tables
- Table 1: Global Alumina Sol Revenue million Forecast, by Application 2020 & 2033
- Table 2: Global Alumina Sol Revenue million Forecast, by Types 2020 & 2033
- Table 3: Global Alumina Sol Revenue million Forecast, by Region 2020 & 2033
- Table 4: Global Alumina Sol Revenue million Forecast, by Application 2020 & 2033
- Table 5: Global Alumina Sol Revenue million Forecast, by Types 2020 & 2033
- Table 6: Global Alumina Sol Revenue million Forecast, by Country 2020 & 2033
- Table 7: United States Alumina Sol Revenue (million) Forecast, by Application 2020 & 2033
- Table 8: Canada Alumina Sol Revenue (million) Forecast, by Application 2020 & 2033
- Table 9: Mexico Alumina Sol Revenue (million) Forecast, by Application 2020 & 2033
- Table 10: Global Alumina Sol Revenue million Forecast, by Application 2020 & 2033
- Table 11: Global Alumina Sol Revenue million Forecast, by Types 2020 & 2033
- Table 12: Global Alumina Sol Revenue million Forecast, by Country 2020 & 2033
- Table 13: Brazil Alumina Sol Revenue (million) Forecast, by Application 2020 & 2033
- Table 14: Argentina Alumina Sol Revenue (million) Forecast, by Application 2020 & 2033
- Table 15: Rest of South America Alumina Sol Revenue (million) Forecast, by Application 2020 & 2033
- Table 16: Global Alumina Sol Revenue million Forecast, by Application 2020 & 2033
- Table 17: Global Alumina Sol Revenue million Forecast, by Types 2020 & 2033
- Table 18: Global Alumina Sol Revenue million Forecast, by Country 2020 & 2033
- Table 19: United Kingdom Alumina Sol Revenue (million) Forecast, by Application 2020 & 2033
- Table 20: Germany Alumina Sol Revenue (million) Forecast, by Application 2020 & 2033
- Table 21: France Alumina Sol Revenue (million) Forecast, by Application 2020 & 2033
- Table 22: Italy Alumina Sol Revenue (million) Forecast, by Application 2020 & 2033
- Table 23: Spain Alumina Sol Revenue (million) Forecast, by Application 2020 & 2033
- Table 24: Russia Alumina Sol Revenue (million) Forecast, by Application 2020 & 2033
- Table 25: Benelux Alumina Sol Revenue (million) Forecast, by Application 2020 & 2033
- Table 26: Nordics Alumina Sol Revenue (million) Forecast, by Application 2020 & 2033
- Table 27: Rest of Europe Alumina Sol Revenue (million) Forecast, by Application 2020 & 2033
- Table 28: Global Alumina Sol Revenue million Forecast, by Application 2020 & 2033
- Table 29: Global Alumina Sol Revenue million Forecast, by Types 2020 & 2033
- Table 30: Global Alumina Sol Revenue million Forecast, by Country 2020 & 2033
- Table 31: Turkey Alumina Sol Revenue (million) Forecast, by Application 2020 & 2033
- Table 32: Israel Alumina Sol Revenue (million) Forecast, by Application 2020 & 2033
- Table 33: GCC Alumina Sol Revenue (million) Forecast, by Application 2020 & 2033
- Table 34: North Africa Alumina Sol Revenue (million) Forecast, by Application 2020 & 2033
- Table 35: South Africa Alumina Sol Revenue (million) Forecast, by Application 2020 & 2033
- Table 36: Rest of Middle East & Africa Alumina Sol Revenue (million) Forecast, by Application 2020 & 2033
- Table 37: Global Alumina Sol Revenue million Forecast, by Application 2020 & 2033
- Table 38: Global Alumina Sol Revenue million Forecast, by Types 2020 & 2033
- Table 39: Global Alumina Sol Revenue million Forecast, by Country 2020 & 2033
- Table 40: China Alumina Sol Revenue (million) Forecast, by Application 2020 & 2033
- Table 41: India Alumina Sol Revenue (million) Forecast, by Application 2020 & 2033
- Table 42: Japan Alumina Sol Revenue (million) Forecast, by Application 2020 & 2033
- Table 43: South Korea Alumina Sol Revenue (million) Forecast, by Application 2020 & 2033
- Table 44: ASEAN Alumina Sol Revenue (million) Forecast, by Application 2020 & 2033
- Table 45: Oceania Alumina Sol Revenue (million) Forecast, by Application 2020 & 2033
- Table 46: Rest of Asia Pacific Alumina Sol Revenue (million) Forecast, by Application 2020 & 2033
Frequently Asked Questions
1. What is the projected Compound Annual Growth Rate (CAGR) of the Alumina Sol?
The projected CAGR is approximately 4.5%.
2. Which companies are prominent players in the Alumina Sol?
Key companies in the market include Nissan Chemical, Sasol Performance Chemicals, Zibo Jiarun, Hanzhou Zhihuajie, Kawaken Fine Chemicals, JGC Catalysts and Chemicals, Hangzhou Veking, Zibo Jinqi, Beijing Yataiaohua, Zibo Senchi, Nyacol Nanotechnologies, Ranco, Wesbond.
3. What are the main segments of the Alumina Sol?
The market segments include Application, Types.
4. Can you provide details about the market size?
The market size is estimated to be USD 214 million as of 2022.
5. What are some drivers contributing to market growth?
N/A
6. What are the notable trends driving market growth?
N/A
7. Are there any restraints impacting market growth?
N/A
8. Can you provide examples of recent developments in the market?
N/A
9. What pricing options are available for accessing the report?
Pricing options include single-user, multi-user, and enterprise licenses priced at USD 5600.00, USD 8400.00, and USD 11200.00 respectively.
10. Is the market size provided in terms of value or volume?
The market size is provided in terms of value, measured in million.
11. Are there any specific market keywords associated with the report?
Yes, the market keyword associated with the report is "Alumina Sol," which aids in identifying and referencing the specific market segment covered.
12. How do I determine which pricing option suits my needs best?
The pricing options vary based on user requirements and access needs. Individual users may opt for single-user licenses, while businesses requiring broader access may choose multi-user or enterprise licenses for cost-effective access to the report.
13. Are there any additional resources or data provided in the Alumina Sol report?
While the report offers comprehensive insights, it's advisable to review the specific contents or supplementary materials provided to ascertain if additional resources or data are available.
14. How can I stay updated on further developments or reports in the Alumina Sol?
To stay informed about further developments, trends, and reports in the Alumina Sol, consider subscribing to industry newsletters, following relevant companies and organizations, or regularly checking reputable industry news sources and publications.
Methodology
Step 1 - Identification of Relevant Samples Size from Population Database


Step 2 - Approaches for Defining Global Market Size (Value, Volume* & Price*)

Note*: In applicable scenarios
Step 3 - Data Sources
Primary Research
- Web Analytics
- Survey Reports
- Research Institute
- Latest Research Reports
- Opinion Leaders
Secondary Research
- Annual Reports
- White Paper
- Latest Press Release
- Industry Association
- Paid Database
- Investor Presentations

Step 4 - Data Triangulation
Involves using different sources of information in order to increase the validity of a study
These sources are likely to be stakeholders in a program - participants, other researchers, program staff, other community members, and so on.
Then we put all data in single framework & apply various statistical tools to find out the dynamic on the market.
During the analysis stage, feedback from the stakeholder groups would be compared to determine areas of agreement as well as areas of divergence