

Key Insights
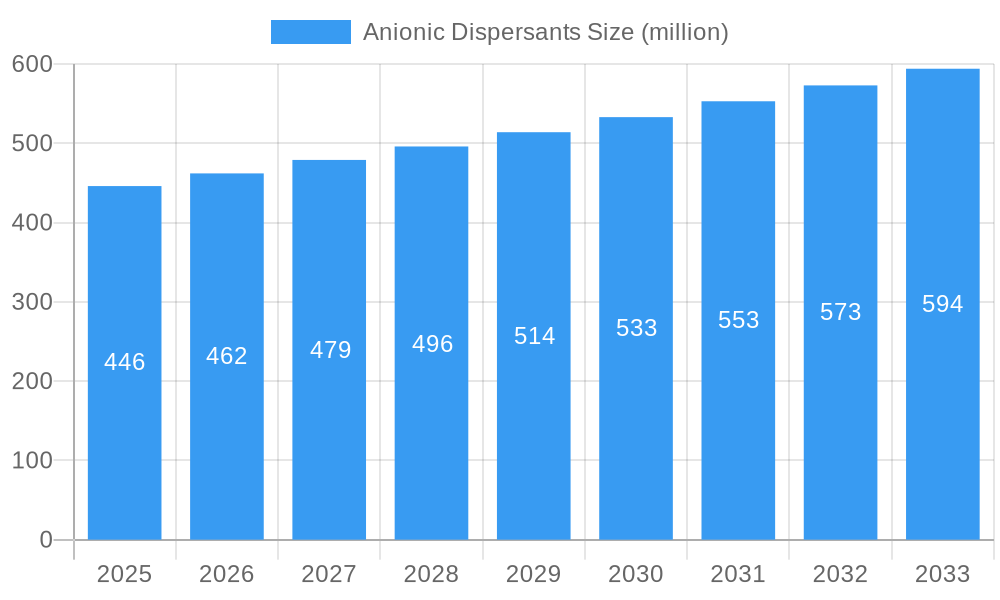
The global anionic dispersants market, valued at $446 million in 2025, is projected to experience steady growth, driven by increasing demand across diverse end-use sectors. The compound annual growth rate (CAGR) of 3.7% from 2025 to 2033 indicates a substantial market expansion, reaching an estimated value exceeding $650 million by 2033. This growth is fueled by several key factors, including the rising adoption of anionic dispersants in coatings and inks to improve pigment dispersion and enhance film properties. The construction industry's ongoing expansion also contributes significantly, as these dispersants are crucial in cement and concrete admixtures for improved workability and strength. Furthermore, the growing demand for high-performance materials in various applications, such as automotive and electronics, is driving innovation and adoption of advanced anionic dispersants with enhanced functionalities. However, concerns regarding the environmental impact of certain anionic dispersants and the increasing stringency of environmental regulations could pose challenges to market growth in the long term. This necessitates the development and adoption of more eco-friendly alternatives.
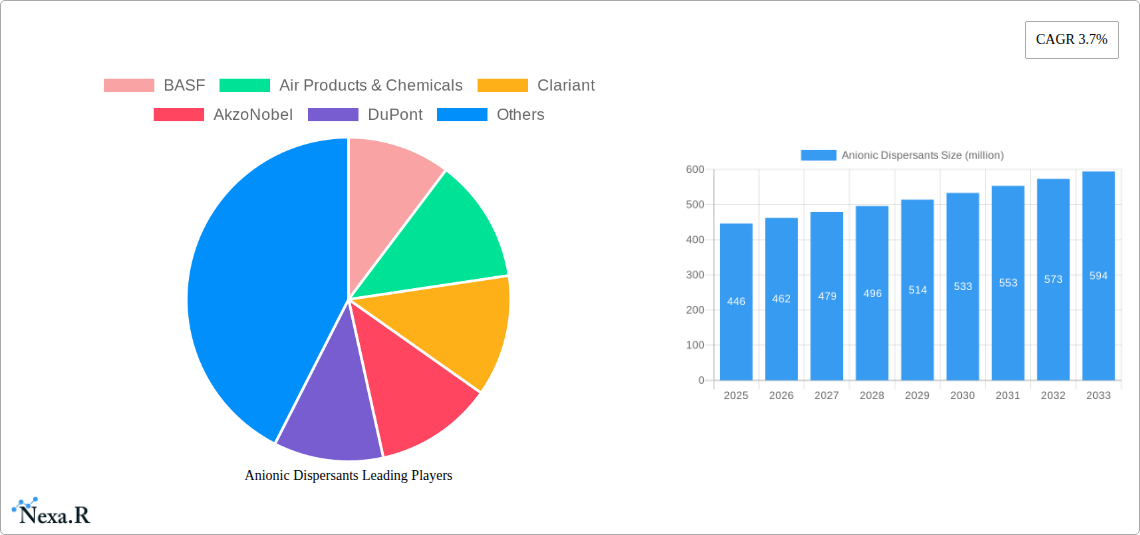
Anionic Dispersants Market Size (In Million)
Despite potential environmental restraints, the market is segmented by application (coatings, inks, construction, etc.), type (polycarboxylates, polyacrylates, etc.), and region (North America, Europe, Asia Pacific, etc.). Leading players like BASF, Air Products & Chemicals, Clariant, and AkzoNobel are actively investing in research and development to improve product performance and expand their market share. Strategic partnerships, acquisitions, and the introduction of innovative products are shaping the competitive landscape. The Asia Pacific region is expected to witness robust growth, driven by rapid industrialization and infrastructure development in countries like China and India. While precise regional breakdowns are unavailable, it’s safe to assume that North America and Europe currently hold significant shares, with Asia-Pacific showing considerable growth potential. This necessitates a dynamic strategy focused on sustainability and regional market penetration for companies to succeed in this expanding market.
Anionic Dispersants Company Market Share
Anionic Dispersants Market Report: 2019-2033
This comprehensive report provides an in-depth analysis of the Anionic Dispersants market, encompassing market dynamics, growth trends, regional dominance, product landscape, key players, and future outlook. The study covers the period 2019-2033, with 2025 as the base year and estimated year. The report is designed for industry professionals, investors, and strategic decision-makers seeking a thorough understanding of this vital sector within the broader specialty chemicals market. The total market value in 2025 is estimated at $XX billion.
Anionic Dispersants Market Dynamics & Structure
This section delves into the competitive landscape of the anionic dispersants market, examining market concentration, technological innovation, regulatory influences, and competitive dynamics. We analyze the impact of mergers and acquisitions (M&A) activities on market structure and identify key factors influencing market growth.
- Market Concentration: The market exhibits a moderately concentrated structure with a few dominant players controlling a significant market share (estimated at xx% in 2025). BASF, Air Products & Chemicals, and Clariant are among the leading players.
- Technological Innovation: Ongoing research and development efforts focus on enhancing dispersant performance, improving sustainability, and expanding application areas. Innovation barriers include high R&D costs and stringent regulatory requirements.
- Regulatory Frameworks: Environmental regulations, particularly concerning VOC emissions and biodegradability, significantly impact product formulation and market dynamics.
- Competitive Product Substitutes: Competition arises from other types of dispersants, such as nonionic and cationic dispersants, posing a challenge to anionic dispersant market growth. The market share of substitutes is estimated at xx% in 2025.
- End-User Demographics: The construction, paints & coatings, and oil & gas industries are major end-users. Growth in these sectors directly influences anionic dispersant demand.
- M&A Trends: The past five years have witnessed xx M&A deals, primarily focused on expanding product portfolios and geographic reach. This activity is expected to continue, driving market consolidation.
Anionic Dispersants Growth Trends & Insights
This section examines the historical and projected growth trajectory of the anionic dispersants market. Utilizing extensive market data and analysis, it assesses growth drivers and influencing factors.
The global anionic dispersants market witnessed steady growth during the historical period (2019-2024), primarily driven by the increasing demand from construction and paints & coatings industries. The market size expanded from $XX billion in 2019 to an estimated $XX billion in 2024, exhibiting a CAGR of xx%. This growth is projected to continue during the forecast period (2025-2033), with the market size reaching $XX billion by 2033 and a CAGR of xx%. Several factors contribute to this positive outlook, including advancements in product formulation, expanding applications in emerging markets, and increased focus on sustainability. Technological disruptions, such as the introduction of bio-based dispersants, are also expected to impact market growth. The adoption rate of these new technologies is expected to increase gradually.
Dominant Regions, Countries, or Segments in Anionic Dispersants
This section identifies the leading geographical regions and segments driving anionic dispersant market growth.
North America and Europe currently dominate the market, accounting for a combined market share of xx% in 2025. However, the Asia-Pacific region is expected to exhibit the highest growth rate during the forecast period, driven by rapid industrialization and infrastructure development in countries like China and India.
- Key Drivers in North America: Strong construction activity, stringent environmental regulations driving demand for high-performance dispersants.
- Key Drivers in Europe: Established chemical industry, focus on sustainable solutions, and robust regulatory framework.
- Key Drivers in Asia-Pacific: Rapid urbanization, infrastructure projects, and increasing demand from the paints & coatings sector.
Anionic Dispersants Product Landscape
Anionic dispersants encompass various types, including polycarboxylates, polyacrylates, and sulfonates, each tailored to specific applications. Recent innovations focus on enhancing dispersant performance, particularly in terms of improved dispersion efficiency, reduced viscosity, and enhanced stability. These advancements are driven by the need for cost-effective and environmentally friendly solutions.
Key Drivers, Barriers & Challenges in Anionic Dispersants
Key Drivers: Increasing demand from various end-use industries (construction, paints & coatings, oil & gas), stringent environmental regulations driving innovation, and advancements in product formulation.
Key Challenges: Fluctuations in raw material prices, intense competition, and stringent regulatory compliance requirements. Supply chain disruptions can also impact production and lead to price volatility.
Emerging Opportunities in Anionic Dispersants
Emerging opportunities lie in expanding applications in the water treatment, agricultural chemicals, and adhesives sectors. The development of bio-based and sustainable dispersants also presents a significant growth opportunity. Furthermore, untapped markets in developing economies offer substantial potential for market expansion.
Growth Accelerators in the Anionic Dispersants Industry
Technological breakthroughs in dispersant formulation, strategic partnerships to access new markets, and focused marketing strategies targeting niche applications will significantly accelerate market growth. Sustainable and environmentally friendly dispersants will also attract environmentally conscious customers and boost market expansion.
Notable Milestones in Anionic Dispersants Sector
- 2020: BASF launched a new range of sustainable anionic dispersants.
- 2022: Clariant acquired a smaller dispersant manufacturer, expanding its product portfolio.
- 2023: Air Products & Chemicals announced a significant investment in its dispersant production facility.
- 2024: New regulations on VOC emissions came into effect in several key markets.
In-Depth Anionic Dispersants Market Outlook
The anionic dispersants market is poised for continued growth, driven by the increasing demand from various end-use industries and ongoing innovation in dispersant technology. Strategic partnerships, focus on sustainability, and expansion into emerging markets will create significant opportunities for growth in the coming years. The market is expected to remain moderately concentrated, with leading players focusing on product differentiation and technological advancements.
Anionic Dispersants Segmentation
-
1. Application
- 1.1. Paints & Coatings
- 1.2. Pulp & Paper
- 1.3. Textile
- 1.4. Others
-
2. Type
- 2.1. Sulfonates and Sulfates
- 2.2. Carboxylates
- 2.3. Others
Anionic Dispersants Segmentation By Geography
-
1. North America
- 1.1. United States
- 1.2. Canada
- 1.3. Mexico
-
2. South America
- 2.1. Brazil
- 2.2. Argentina
- 2.3. Rest of South America
-
3. Europe
- 3.1. United Kingdom
- 3.2. Germany
- 3.3. France
- 3.4. Italy
- 3.5. Spain
- 3.6. Russia
- 3.7. Benelux
- 3.8. Nordics
- 3.9. Rest of Europe
-
4. Middle East & Africa
- 4.1. Turkey
- 4.2. Israel
- 4.3. GCC
- 4.4. North Africa
- 4.5. South Africa
- 4.6. Rest of Middle East & Africa
-
5. Asia Pacific
- 5.1. China
- 5.2. India
- 5.3. Japan
- 5.4. South Korea
- 5.5. ASEAN
- 5.6. Oceania
- 5.7. Rest of Asia Pacific

Anionic Dispersants Regional Market Share
Geographic Coverage of Anionic Dispersants
Anionic Dispersants REPORT HIGHLIGHTS
| Aspects | Details |
|---|---|
| Study Period | 2020-2034 |
| Base Year | 2025 |
| Estimated Year | 2026 |
| Forecast Period | 2026-2034 |
| Historical Period | 2020-2025 |
| Growth Rate | CAGR of 3.7% from 2020-2034 |
| Segmentation |
|
Table of Contents
- 1. Introduction
- 1.1. Research Scope
- 1.2. Market Segmentation
- 1.3. Research Objective
- 1.4. Definitions and Assumptions
- 2. Executive Summary
- 2.1. Market Snapshot
- 3. Market Dynamics
- 3.1. Market Drivers
- 3.2. Market Restrains
- 3.3. Market Trends
- 3.4. Market Opportunities
- 4. Market Factor Analysis
- 4.1. Porters Five Forces
- 4.1.1. Bargaining Power of Suppliers
- 4.1.2. Bargaining Power of Buyers
- 4.1.3. Threat of New Entrants
- 4.1.4. Threat of Substitutes
- 4.1.5. Competitive Rivalry
- 4.2. PESTEL analysis
- 4.3. BCG Analysis
- 4.3.1. Stars (High Growth, High Market Share)
- 4.3.2. Cash Cows (Low Growth, High Market Share)
- 4.3.3. Question Mark (High Growth, Low Market Share)
- 4.3.4. Dogs (Low Growth, Low Market Share)
- 4.4. Ansoff Matrix Analysis
- 4.5. Supply Chain Analysis
- 4.6. Regulatory Landscape
- 4.7. Current Market Potential and Opportunity Assessment (TAM–SAM–SOM Framework)
- 4.8. NRP Analyst Note
- 4.1. Porters Five Forces
- 5. Market Analysis, Insights and Forecast 2021-2033
- 5.1. Market Analysis, Insights and Forecast - by Application
- 5.1.1. Paints & Coatings
- 5.1.2. Pulp & Paper
- 5.1.3. Textile
- 5.1.4. Others
- 5.2. Market Analysis, Insights and Forecast - by Type
- 5.2.1. Sulfonates and Sulfates
- 5.2.2. Carboxylates
- 5.2.3. Others
- 5.3. Market Analysis, Insights and Forecast - by Region
- 5.3.1. North America
- 5.3.2. South America
- 5.3.3. Europe
- 5.3.4. Middle East & Africa
- 5.3.5. Asia Pacific
- 5.1. Market Analysis, Insights and Forecast - by Application
- 6. Global Anionic Dispersants Analysis, Insights and Forecast, 2021-2033
- 6.1. Market Analysis, Insights and Forecast - by Application
- 6.1.1. Paints & Coatings
- 6.1.2. Pulp & Paper
- 6.1.3. Textile
- 6.1.4. Others
- 6.2. Market Analysis, Insights and Forecast - by Type
- 6.2.1. Sulfonates and Sulfates
- 6.2.2. Carboxylates
- 6.2.3. Others
- 6.1. Market Analysis, Insights and Forecast - by Application
- 7. North America Anionic Dispersants Analysis, Insights and Forecast, 2020-2032
- 7.1. Market Analysis, Insights and Forecast - by Application
- 7.1.1. Paints & Coatings
- 7.1.2. Pulp & Paper
- 7.1.3. Textile
- 7.1.4. Others
- 7.2. Market Analysis, Insights and Forecast - by Type
- 7.2.1. Sulfonates and Sulfates
- 7.2.2. Carboxylates
- 7.2.3. Others
- 7.1. Market Analysis, Insights and Forecast - by Application
- 8. South America Anionic Dispersants Analysis, Insights and Forecast, 2020-2032
- 8.1. Market Analysis, Insights and Forecast - by Application
- 8.1.1. Paints & Coatings
- 8.1.2. Pulp & Paper
- 8.1.3. Textile
- 8.1.4. Others
- 8.2. Market Analysis, Insights and Forecast - by Type
- 8.2.1. Sulfonates and Sulfates
- 8.2.2. Carboxylates
- 8.2.3. Others
- 8.1. Market Analysis, Insights and Forecast - by Application
- 9. Europe Anionic Dispersants Analysis, Insights and Forecast, 2020-2032
- 9.1. Market Analysis, Insights and Forecast - by Application
- 9.1.1. Paints & Coatings
- 9.1.2. Pulp & Paper
- 9.1.3. Textile
- 9.1.4. Others
- 9.2. Market Analysis, Insights and Forecast - by Type
- 9.2.1. Sulfonates and Sulfates
- 9.2.2. Carboxylates
- 9.2.3. Others
- 9.1. Market Analysis, Insights and Forecast - by Application
- 10. Middle East & Africa Anionic Dispersants Analysis, Insights and Forecast, 2020-2032
- 10.1. Market Analysis, Insights and Forecast - by Application
- 10.1.1. Paints & Coatings
- 10.1.2. Pulp & Paper
- 10.1.3. Textile
- 10.1.4. Others
- 10.2. Market Analysis, Insights and Forecast - by Type
- 10.2.1. Sulfonates and Sulfates
- 10.2.2. Carboxylates
- 10.2.3. Others
- 10.1. Market Analysis, Insights and Forecast - by Application
- 11. Asia Pacific Anionic Dispersants Analysis, Insights and Forecast, 2020-2032
- 11.1. Market Analysis, Insights and Forecast - by Application
- 11.1.1. Paints & Coatings
- 11.1.2. Pulp & Paper
- 11.1.3. Textile
- 11.1.4. Others
- 11.2. Market Analysis, Insights and Forecast - by Type
- 11.2.1. Sulfonates and Sulfates
- 11.2.2. Carboxylates
- 11.2.3. Others
- 11.1. Market Analysis, Insights and Forecast - by Application
- 12. Competitive Analysis
- 12.1. Company Profiles
- 12.1.1 BASF
- 12.1.1.1. Company Overview
- 12.1.1.2. Products
- 12.1.1.3. Company Financials
- 12.1.1.4. SWOT Analysis
- 12.1.2 Air Products & Chemicals
- 12.1.2.1. Company Overview
- 12.1.2.2. Products
- 12.1.2.3. Company Financials
- 12.1.2.4. SWOT Analysis
- 12.1.3 Clariant
- 12.1.3.1. Company Overview
- 12.1.3.2. Products
- 12.1.3.3. Company Financials
- 12.1.3.4. SWOT Analysis
- 12.1.4 AkzoNobel
- 12.1.4.1. Company Overview
- 12.1.4.2. Products
- 12.1.4.3. Company Financials
- 12.1.4.4. SWOT Analysis
- 12.1.5 DuPont
- 12.1.5.1. Company Overview
- 12.1.5.2. Products
- 12.1.5.3. Company Financials
- 12.1.5.4. SWOT Analysis
- 12.1.6 Arkema
- 12.1.6.1. Company Overview
- 12.1.6.2. Products
- 12.1.6.3. Company Financials
- 12.1.6.4. SWOT Analysis
- 12.1.7 Ashland
- 12.1.7.1. Company Overview
- 12.1.7.2. Products
- 12.1.7.3. Company Financials
- 12.1.7.4. SWOT Analysis
- 12.1.8 Croda
- 12.1.8.1. Company Overview
- 12.1.8.2. Products
- 12.1.8.3. Company Financials
- 12.1.8.4. SWOT Analysis
- 12.1.9 Cytec
- 12.1.9.1. Company Overview
- 12.1.9.2. Products
- 12.1.9.3. Company Financials
- 12.1.9.4. SWOT Analysis
- 12.1.10 Kao
- 12.1.10.1. Company Overview
- 12.1.10.2. Products
- 12.1.10.3. Company Financials
- 12.1.10.4. SWOT Analysis
- 12.1.11 Elementis
- 12.1.11.1. Company Overview
- 12.1.11.2. Products
- 12.1.11.3. Company Financials
- 12.1.11.4. SWOT Analysis
- 12.1.12 King Industries
- 12.1.12.1. Company Overview
- 12.1.12.2. Products
- 12.1.12.3. Company Financials
- 12.1.12.4. SWOT Analysis
- 12.1.13 Rudolf
- 12.1.13.1. Company Overview
- 12.1.13.2. Products
- 12.1.13.3. Company Financials
- 12.1.13.4. SWOT Analysis
- 12.1.1 BASF
- 12.2. Market Entropy
- 12.2.1 Company's Key Areas Served
- 12.2.2 Recent Developments
- 12.3. Company Market Share Analysis 2025
- 12.3.1 Top 5 Companies Market Share Analysis
- 12.3.2 Top 3 Companies Market Share Analysis
- 12.4. List of Potential Customers
- 13. Research Methodology
List of Figures
- Figure 1: Global Anionic Dispersants Revenue Breakdown (million, %) by Region 2025 & 2033
- Figure 2: North America Anionic Dispersants Revenue (million), by Application 2025 & 2033
- Figure 3: North America Anionic Dispersants Revenue Share (%), by Application 2025 & 2033
- Figure 4: North America Anionic Dispersants Revenue (million), by Type 2025 & 2033
- Figure 5: North America Anionic Dispersants Revenue Share (%), by Type 2025 & 2033
- Figure 6: North America Anionic Dispersants Revenue (million), by Country 2025 & 2033
- Figure 7: North America Anionic Dispersants Revenue Share (%), by Country 2025 & 2033
- Figure 8: South America Anionic Dispersants Revenue (million), by Application 2025 & 2033
- Figure 9: South America Anionic Dispersants Revenue Share (%), by Application 2025 & 2033
- Figure 10: South America Anionic Dispersants Revenue (million), by Type 2025 & 2033
- Figure 11: South America Anionic Dispersants Revenue Share (%), by Type 2025 & 2033
- Figure 12: South America Anionic Dispersants Revenue (million), by Country 2025 & 2033
- Figure 13: South America Anionic Dispersants Revenue Share (%), by Country 2025 & 2033
- Figure 14: Europe Anionic Dispersants Revenue (million), by Application 2025 & 2033
- Figure 15: Europe Anionic Dispersants Revenue Share (%), by Application 2025 & 2033
- Figure 16: Europe Anionic Dispersants Revenue (million), by Type 2025 & 2033
- Figure 17: Europe Anionic Dispersants Revenue Share (%), by Type 2025 & 2033
- Figure 18: Europe Anionic Dispersants Revenue (million), by Country 2025 & 2033
- Figure 19: Europe Anionic Dispersants Revenue Share (%), by Country 2025 & 2033
- Figure 20: Middle East & Africa Anionic Dispersants Revenue (million), by Application 2025 & 2033
- Figure 21: Middle East & Africa Anionic Dispersants Revenue Share (%), by Application 2025 & 2033
- Figure 22: Middle East & Africa Anionic Dispersants Revenue (million), by Type 2025 & 2033
- Figure 23: Middle East & Africa Anionic Dispersants Revenue Share (%), by Type 2025 & 2033
- Figure 24: Middle East & Africa Anionic Dispersants Revenue (million), by Country 2025 & 2033
- Figure 25: Middle East & Africa Anionic Dispersants Revenue Share (%), by Country 2025 & 2033
- Figure 26: Asia Pacific Anionic Dispersants Revenue (million), by Application 2025 & 2033
- Figure 27: Asia Pacific Anionic Dispersants Revenue Share (%), by Application 2025 & 2033
- Figure 28: Asia Pacific Anionic Dispersants Revenue (million), by Type 2025 & 2033
- Figure 29: Asia Pacific Anionic Dispersants Revenue Share (%), by Type 2025 & 2033
- Figure 30: Asia Pacific Anionic Dispersants Revenue (million), by Country 2025 & 2033
- Figure 31: Asia Pacific Anionic Dispersants Revenue Share (%), by Country 2025 & 2033
List of Tables
- Table 1: Global Anionic Dispersants Revenue million Forecast, by Application 2020 & 2033
- Table 2: Global Anionic Dispersants Revenue million Forecast, by Type 2020 & 2033
- Table 3: Global Anionic Dispersants Revenue million Forecast, by Region 2020 & 2033
- Table 4: Global Anionic Dispersants Revenue million Forecast, by Application 2020 & 2033
- Table 5: Global Anionic Dispersants Revenue million Forecast, by Type 2020 & 2033
- Table 6: Global Anionic Dispersants Revenue million Forecast, by Country 2020 & 2033
- Table 7: United States Anionic Dispersants Revenue (million) Forecast, by Application 2020 & 2033
- Table 8: Canada Anionic Dispersants Revenue (million) Forecast, by Application 2020 & 2033
- Table 9: Mexico Anionic Dispersants Revenue (million) Forecast, by Application 2020 & 2033
- Table 10: Global Anionic Dispersants Revenue million Forecast, by Application 2020 & 2033
- Table 11: Global Anionic Dispersants Revenue million Forecast, by Type 2020 & 2033
- Table 12: Global Anionic Dispersants Revenue million Forecast, by Country 2020 & 2033
- Table 13: Brazil Anionic Dispersants Revenue (million) Forecast, by Application 2020 & 2033
- Table 14: Argentina Anionic Dispersants Revenue (million) Forecast, by Application 2020 & 2033
- Table 15: Rest of South America Anionic Dispersants Revenue (million) Forecast, by Application 2020 & 2033
- Table 16: Global Anionic Dispersants Revenue million Forecast, by Application 2020 & 2033
- Table 17: Global Anionic Dispersants Revenue million Forecast, by Type 2020 & 2033
- Table 18: Global Anionic Dispersants Revenue million Forecast, by Country 2020 & 2033
- Table 19: United Kingdom Anionic Dispersants Revenue (million) Forecast, by Application 2020 & 2033
- Table 20: Germany Anionic Dispersants Revenue (million) Forecast, by Application 2020 & 2033
- Table 21: France Anionic Dispersants Revenue (million) Forecast, by Application 2020 & 2033
- Table 22: Italy Anionic Dispersants Revenue (million) Forecast, by Application 2020 & 2033
- Table 23: Spain Anionic Dispersants Revenue (million) Forecast, by Application 2020 & 2033
- Table 24: Russia Anionic Dispersants Revenue (million) Forecast, by Application 2020 & 2033
- Table 25: Benelux Anionic Dispersants Revenue (million) Forecast, by Application 2020 & 2033
- Table 26: Nordics Anionic Dispersants Revenue (million) Forecast, by Application 2020 & 2033
- Table 27: Rest of Europe Anionic Dispersants Revenue (million) Forecast, by Application 2020 & 2033
- Table 28: Global Anionic Dispersants Revenue million Forecast, by Application 2020 & 2033
- Table 29: Global Anionic Dispersants Revenue million Forecast, by Type 2020 & 2033
- Table 30: Global Anionic Dispersants Revenue million Forecast, by Country 2020 & 2033
- Table 31: Turkey Anionic Dispersants Revenue (million) Forecast, by Application 2020 & 2033
- Table 32: Israel Anionic Dispersants Revenue (million) Forecast, by Application 2020 & 2033
- Table 33: GCC Anionic Dispersants Revenue (million) Forecast, by Application 2020 & 2033
- Table 34: North Africa Anionic Dispersants Revenue (million) Forecast, by Application 2020 & 2033
- Table 35: South Africa Anionic Dispersants Revenue (million) Forecast, by Application 2020 & 2033
- Table 36: Rest of Middle East & Africa Anionic Dispersants Revenue (million) Forecast, by Application 2020 & 2033
- Table 37: Global Anionic Dispersants Revenue million Forecast, by Application 2020 & 2033
- Table 38: Global Anionic Dispersants Revenue million Forecast, by Type 2020 & 2033
- Table 39: Global Anionic Dispersants Revenue million Forecast, by Country 2020 & 2033
- Table 40: China Anionic Dispersants Revenue (million) Forecast, by Application 2020 & 2033
- Table 41: India Anionic Dispersants Revenue (million) Forecast, by Application 2020 & 2033
- Table 42: Japan Anionic Dispersants Revenue (million) Forecast, by Application 2020 & 2033
- Table 43: South Korea Anionic Dispersants Revenue (million) Forecast, by Application 2020 & 2033
- Table 44: ASEAN Anionic Dispersants Revenue (million) Forecast, by Application 2020 & 2033
- Table 45: Oceania Anionic Dispersants Revenue (million) Forecast, by Application 2020 & 2033
- Table 46: Rest of Asia Pacific Anionic Dispersants Revenue (million) Forecast, by Application 2020 & 2033
Frequently Asked Questions
1. What is the projected Compound Annual Growth Rate (CAGR) of the Anionic Dispersants?
The projected CAGR is approximately 3.7%.
2. Which companies are prominent players in the Anionic Dispersants?
Key companies in the market include BASF, Air Products & Chemicals, Clariant, AkzoNobel, DuPont, Arkema, Ashland, Croda, Cytec, Kao, Elementis, King Industries, Rudolf.
3. What are the main segments of the Anionic Dispersants?
The market segments include Application, Type.
4. Can you provide details about the market size?
The market size is estimated to be USD 446 million as of 2022.
5. What are some drivers contributing to market growth?
N/A
6. What are the notable trends driving market growth?
N/A
7. Are there any restraints impacting market growth?
N/A
8. Can you provide examples of recent developments in the market?
N/A
9. What pricing options are available for accessing the report?
Pricing options include single-user, multi-user, and enterprise licenses priced at USD 4250.00, USD 6375.00, and USD 8500.00 respectively.
10. Is the market size provided in terms of value or volume?
The market size is provided in terms of value, measured in million.
11. Are there any specific market keywords associated with the report?
Yes, the market keyword associated with the report is "Anionic Dispersants," which aids in identifying and referencing the specific market segment covered.
12. How do I determine which pricing option suits my needs best?
The pricing options vary based on user requirements and access needs. Individual users may opt for single-user licenses, while businesses requiring broader access may choose multi-user or enterprise licenses for cost-effective access to the report.
13. Are there any additional resources or data provided in the Anionic Dispersants report?
While the report offers comprehensive insights, it's advisable to review the specific contents or supplementary materials provided to ascertain if additional resources or data are available.
14. How can I stay updated on further developments or reports in the Anionic Dispersants?
To stay informed about further developments, trends, and reports in the Anionic Dispersants, consider subscribing to industry newsletters, following relevant companies and organizations, or regularly checking reputable industry news sources and publications.
Methodology
Step 1 - Identification of Relevant Samples Size from Population Database


Step 2 - Approaches for Defining Global Market Size (Value, Volume* & Price*)

Note*: In applicable scenarios
Step 3 - Data Sources
Primary Research
- Web Analytics
- Survey Reports
- Research Institute
- Latest Research Reports
- Opinion Leaders
Secondary Research
- Annual Reports
- White Paper
- Latest Press Release
- Industry Association
- Paid Database
- Investor Presentations

Step 4 - Data Triangulation
Involves using different sources of information in order to increase the validity of a study
These sources are likely to be stakeholders in a program - participants, other researchers, program staff, other community members, and so on.
Then we put all data in single framework & apply various statistical tools to find out the dynamic on the market.
During the analysis stage, feedback from the stakeholder groups would be compared to determine areas of agreement as well as areas of divergence