

Key Insights
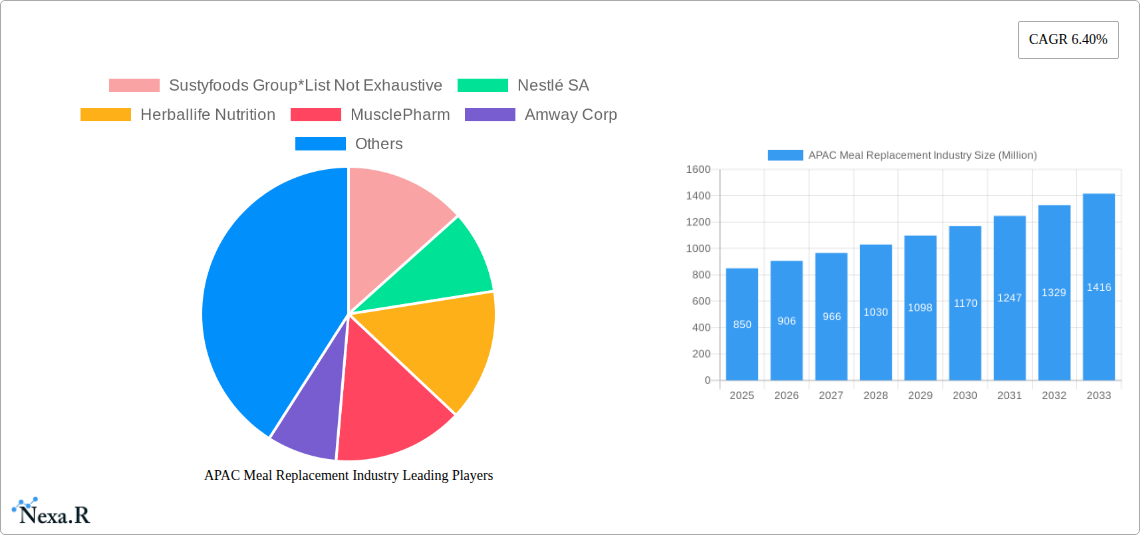
The Asia-Pacific (APAC) meal replacement market, valued at approximately $850 million in 2025, is projected to experience robust growth, driven by increasing health consciousness, busy lifestyles, and rising disposable incomes across the region. This segment is characterized by diverse product offerings, including ready-to-drink products, nutritional bars, and powdered supplements, catering to a wide range of consumer preferences and needs. Growth is further fueled by the expansion of online retail channels, offering convenient access to a wider selection of products. However, challenges remain, such as consumer concerns about artificial ingredients and the need for more sustainable packaging solutions. The market is segmented by product type and distribution channel, with ready-to-drink products and supermarkets/hypermarkets currently holding significant market share. Key players, including Nestlé SA, Herbalife Nutrition, and Amway Corp, are actively investing in product innovation and expanding their distribution networks to capitalize on the growing demand. Significant growth is expected in countries like China, India, and Japan, fueled by a rapidly expanding middle class and increasing awareness of health and wellness. The increasing prevalence of obesity and related health issues is another major driver.
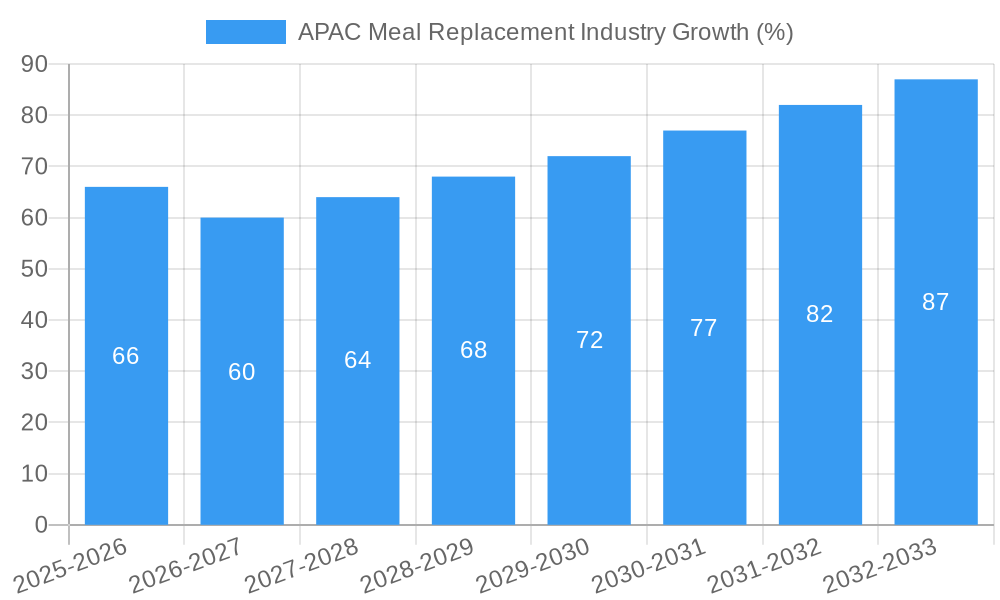
The projected Compound Annual Growth Rate (CAGR) of 6.40% suggests a steady increase in market value over the forecast period (2025-2033). This growth trajectory is likely to be influenced by factors such as rising urbanization, changing dietary habits, and the growing popularity of convenient and functional foods. However, potential restraints include regulatory hurdles related to product labeling and safety standards, along with price sensitivity in certain markets. Furthermore, successful market penetration will depend on addressing consumer perceptions regarding the taste, efficacy, and long-term health effects of meal replacement products. Specific marketing strategies focusing on the benefits of convenience, weight management, and improved nutritional intake will be key to driving continued growth within the APAC region.
APAC Meal Replacement Industry Report: 2019-2033
This comprehensive report provides a detailed analysis of the Asia-Pacific (APAC) meal replacement industry, covering market dynamics, growth trends, key players, and future prospects. The study period spans from 2019 to 2033, with 2025 as the base and estimated year. The report segments the market by product type (Ready-to-Drink Products, Nutritional Bars, Powdered Supplements, Other Product Types) and distribution channel (Supermarkets/Hypermarkets, Convenience Stores, Specialty Stores, Online Retail Stores, Other Distribution Channels), offering granular insights into this rapidly evolving sector. The report is invaluable for industry professionals, investors, and strategic decision-makers seeking to understand and capitalize on the opportunities within the APAC meal replacement market.
APAC Meal Replacement Industry Market Dynamics & Structure
The APAC meal replacement market is characterized by a moderately fragmented landscape, with both established multinational corporations and emerging local players vying for market share. Market concentration is expected to increase slightly over the forecast period due to M&A activity and the dominance of several key players. Technological innovation, primarily in product formulation and delivery systems, is a key driver, while regulatory frameworks concerning labeling and ingredient standards play a significant role. Competitive substitutes include traditional food options and other dietary supplements, creating a dynamic competitive environment. End-user demographics skew towards health-conscious consumers, athletes, and busy professionals, with considerable growth potential amongst younger populations.
- Market Concentration: Moderately fragmented (xx%), trending towards consolidation.
- Technological Innovation: Focus on natural ingredients, personalized nutrition, and convenient formats.
- Regulatory Landscape: Varies across countries; impacting ingredient approvals and labeling requirements.
- Competitive Substitutes: Traditional meals, dietary supplements, and functional foods.
- End-User Demographics: Health-conscious individuals, athletes, busy professionals, and increasingly, younger demographics.
- M&A Activity: xx deals recorded between 2019 and 2024, with an estimated xx% increase projected for 2025-2033.
APAC Meal Replacement Industry Growth Trends & Insights
The APAC meal replacement market witnessed significant growth from 2019 to 2024, driven by increasing health awareness, changing lifestyles, and rising disposable incomes across the region. The market size expanded from xx million units in 2019 to xx million units in 2024, exhibiting a CAGR of xx%. This growth trajectory is expected to continue, with a projected CAGR of xx% from 2025 to 2033, pushing the market size to xx million units by 2033. Technological disruptions, such as personalized nutrition solutions and innovative product formats, are accelerating adoption rates. Consumer behavior shifts towards convenience, health, and sustainability are further bolstering market expansion. Market penetration remains relatively low, indicating substantial untapped potential for future growth. Specific growth drivers include increased urbanization, growing awareness of health and wellness, and the increasing popularity of convenient and functional food products.
Dominant Regions, Countries, or Segments in APAC Meal Replacement Industry
China and India dominate the APAC meal replacement market, accounting for a combined xx% market share in 2024. Within product types, powdered supplements hold the largest share, followed by ready-to-drink products and nutritional bars. Supermarkets/hypermarkets are the primary distribution channel, although online retail is rapidly gaining traction, especially in urban areas.
- Leading Regions: China and India dominate, with strong growth in other Southeast Asian nations.
- Leading Product Type: Powdered Supplements (xx% market share in 2024). Ready-to-Drink products are seeing rapid growth.
- Leading Distribution Channel: Supermarkets/Hypermarkets (xx% market share in 2024), with increasing Online Retail penetration.
- Key Drivers: Rising disposable incomes, health consciousness, increasing urbanization, and expanding e-commerce infrastructure.
APAC Meal Replacement Industry Product Landscape
The APAC meal replacement market showcases diverse product innovations, encompassing functional ingredients, personalized formulations, and diverse formats catering to evolving consumer preferences. Ready-to-drink options prioritize convenience, while powdered supplements offer customization and cost-effectiveness. Nutritional bars provide portability, while other specialized formats target niche demographics. Technological advancements involve improved taste and texture, enhanced nutrient bioavailability, and sustainable packaging solutions. Unique selling propositions focus on health benefits, convenience, and specific dietary needs, driving competitive differentiation.
Key Drivers, Barriers & Challenges in APAP Meal Replacement Industry
Key Drivers: Rising health consciousness, increasing urbanization and busy lifestyles, growing demand for convenient and functional foods, and expanding e-commerce platforms are major drivers. Government initiatives promoting healthy lifestyles and advancements in food technology also contribute.
Key Barriers & Challenges: Supply chain disruptions, stringent regulatory approvals for new products, intense competition from established brands and local players, and varying consumer preferences across regions present considerable challenges. High production costs and fluctuating raw material prices also impact profitability. The potential for mislabeling and misleading health claims also presents a significant risk.
Emerging Opportunities in APAC Meal Replacement Industry
Untapped markets in rural areas and emerging economies present significant growth opportunities. The development of innovative products catering to specific dietary needs, such as plant-based and ketogenic options, offers considerable potential. Personalized nutrition solutions leveraging data-driven insights can further enhance market penetration. Furthermore, the growing demand for sustainable and ethically sourced ingredients creates openings for eco-conscious brands.
Growth Accelerators in the APAC Meal Replacement Industry
Technological breakthroughs in product formulation, personalized nutrition, and smart packaging drive long-term growth. Strategic partnerships between food companies and technology providers are fostering innovation. Market expansion into underserved regions, fueled by rising incomes and improved infrastructure, will further stimulate market expansion. Government initiatives supporting the development of the food technology sector are creating a favorable environment for sustainable growth.
Key Players Shaping the APAC Meal Replacement Industry Market
- Sustyfoods Group
- Nestlé SA
- Herbalife Nutrition
- MusclePharm
- Amway Corp
- Abbott Laboratories
- Glanbia PLC
- Danone SA
- Formulite Pty Ltd
- Bulk Nutrients
- Sun Pharmaceutical Industries Limited
- WonderLab
Notable Milestones in APAC Meal Replacement Industry Sector
- May 2022: Holland & Barrett partnered with Huelto to launch a range of vegan meal replacement shakes (Nu26).
- May 2022: WonderLab launched a new collagen healthy meal replacement milkshake in China (initially via WeChat).
- January 2023: Herbalife Nutrition India partnered with cricketer Smriti Mandhana, signifying a broader sponsorship strategy.
In-Depth APAC Meal Replacement Industry Market Outlook
The APAC meal replacement market is poised for sustained growth, driven by favorable demographic trends, increasing health awareness, and technological advancements. The continued expansion of e-commerce and the development of innovative, customized products will further propel market expansion. Strategic partnerships and investment in research and development will be crucial for companies to maintain a competitive edge and capitalize on the vast potential of this dynamic market. The focus on sustainability and ethical sourcing will also be a key differentiator in the years to come.
APAC Meal Replacement Industry Segmentation
-
1. Product Type
- 1.1. Ready-to-Drink Products
- 1.2. Nutritional Bars
- 1.3. Powdered Supplements
- 1.4. Other Product Types
-
2. Distribution Channel
- 2.1. Supermarkets/Hypermarkets
- 2.2. Convenience Stores
- 2.3. Specialty Stores
- 2.4. Online Retail Stores
- 2.5. Other Distribution Channels
-
3. Geography
- 3.1. China
- 3.2. Japan
- 3.3. India
- 3.4. Australia
- 3.5. Rest of Asia-Pacific
APAC Meal Replacement Industry Segmentation By Geography
- 1. China
- 2. Japan
- 3. India
- 4. Australia
- 5. Rest of Asia Pacific
APAC Meal Replacement Industry REPORT HIGHLIGHTS
| Aspects | Details |
|---|---|
| Study Period | 2019-2033 |
| Base Year | 2024 |
| Estimated Year | 2025 |
| Forecast Period | 2025-2033 |
| Historical Period | 2019-2024 |
| Growth Rate | CAGR of 6.40% from 2019-2033 |
| Segmentation |
|
Table of Contents
- 1. Introduction
- 1.1. Research Scope
- 1.2. Market Segmentation
- 1.3. Research Methodology
- 1.4. Definitions and Assumptions
- 2. Executive Summary
- 2.1. Introduction
- 3. Market Dynamics
- 3.1. Introduction
- 3.2. Market Drivers
- 3.2.1. Consumers Managing Special Diets Strive on Meal Replacements; Rising Demand for Convenient and Small-Portion Meal
- 3.3. Market Restrains
- 3.3.1. Highly Priced Meal Replacement Products to Hamper Market Growth
- 3.4. Market Trends
- 3.4.1. Consumers Managing Special Diets Strive on Meal Replacements
- 4. Market Factor Analysis
- 4.1. Porters Five Forces
- 4.2. Supply/Value Chain
- 4.3. PESTEL analysis
- 4.4. Market Entropy
- 4.5. Patent/Trademark Analysis
- 5. Global APAC Meal Replacement Industry Analysis, Insights and Forecast, 2019-2031
- 5.1. Market Analysis, Insights and Forecast - by Product Type
- 5.1.1. Ready-to-Drink Products
- 5.1.2. Nutritional Bars
- 5.1.3. Powdered Supplements
- 5.1.4. Other Product Types
- 5.2. Market Analysis, Insights and Forecast - by Distribution Channel
- 5.2.1. Supermarkets/Hypermarkets
- 5.2.2. Convenience Stores
- 5.2.3. Specialty Stores
- 5.2.4. Online Retail Stores
- 5.2.5. Other Distribution Channels
- 5.3. Market Analysis, Insights and Forecast - by Geography
- 5.3.1. China
- 5.3.2. Japan
- 5.3.3. India
- 5.3.4. Australia
- 5.3.5. Rest of Asia-Pacific
- 5.4. Market Analysis, Insights and Forecast - by Region
- 5.4.1. China
- 5.4.2. Japan
- 5.4.3. India
- 5.4.4. Australia
- 5.4.5. Rest of Asia Pacific
- 5.1. Market Analysis, Insights and Forecast - by Product Type
- 6. China APAC Meal Replacement Industry Analysis, Insights and Forecast, 2019-2031
- 6.1. Market Analysis, Insights and Forecast - by Product Type
- 6.1.1. Ready-to-Drink Products
- 6.1.2. Nutritional Bars
- 6.1.3. Powdered Supplements
- 6.1.4. Other Product Types
- 6.2. Market Analysis, Insights and Forecast - by Distribution Channel
- 6.2.1. Supermarkets/Hypermarkets
- 6.2.2. Convenience Stores
- 6.2.3. Specialty Stores
- 6.2.4. Online Retail Stores
- 6.2.5. Other Distribution Channels
- 6.3. Market Analysis, Insights and Forecast - by Geography
- 6.3.1. China
- 6.3.2. Japan
- 6.3.3. India
- 6.3.4. Australia
- 6.3.5. Rest of Asia-Pacific
- 6.1. Market Analysis, Insights and Forecast - by Product Type
- 7. Japan APAC Meal Replacement Industry Analysis, Insights and Forecast, 2019-2031
- 7.1. Market Analysis, Insights and Forecast - by Product Type
- 7.1.1. Ready-to-Drink Products
- 7.1.2. Nutritional Bars
- 7.1.3. Powdered Supplements
- 7.1.4. Other Product Types
- 7.2. Market Analysis, Insights and Forecast - by Distribution Channel
- 7.2.1. Supermarkets/Hypermarkets
- 7.2.2. Convenience Stores
- 7.2.3. Specialty Stores
- 7.2.4. Online Retail Stores
- 7.2.5. Other Distribution Channels
- 7.3. Market Analysis, Insights and Forecast - by Geography
- 7.3.1. China
- 7.3.2. Japan
- 7.3.3. India
- 7.3.4. Australia
- 7.3.5. Rest of Asia-Pacific
- 7.1. Market Analysis, Insights and Forecast - by Product Type
- 8. India APAC Meal Replacement Industry Analysis, Insights and Forecast, 2019-2031
- 8.1. Market Analysis, Insights and Forecast - by Product Type
- 8.1.1. Ready-to-Drink Products
- 8.1.2. Nutritional Bars
- 8.1.3. Powdered Supplements
- 8.1.4. Other Product Types
- 8.2. Market Analysis, Insights and Forecast - by Distribution Channel
- 8.2.1. Supermarkets/Hypermarkets
- 8.2.2. Convenience Stores
- 8.2.3. Specialty Stores
- 8.2.4. Online Retail Stores
- 8.2.5. Other Distribution Channels
- 8.3. Market Analysis, Insights and Forecast - by Geography
- 8.3.1. China
- 8.3.2. Japan
- 8.3.3. India
- 8.3.4. Australia
- 8.3.5. Rest of Asia-Pacific
- 8.1. Market Analysis, Insights and Forecast - by Product Type
- 9. Australia APAC Meal Replacement Industry Analysis, Insights and Forecast, 2019-2031
- 9.1. Market Analysis, Insights and Forecast - by Product Type
- 9.1.1. Ready-to-Drink Products
- 9.1.2. Nutritional Bars
- 9.1.3. Powdered Supplements
- 9.1.4. Other Product Types
- 9.2. Market Analysis, Insights and Forecast - by Distribution Channel
- 9.2.1. Supermarkets/Hypermarkets
- 9.2.2. Convenience Stores
- 9.2.3. Specialty Stores
- 9.2.4. Online Retail Stores
- 9.2.5. Other Distribution Channels
- 9.3. Market Analysis, Insights and Forecast - by Geography
- 9.3.1. China
- 9.3.2. Japan
- 9.3.3. India
- 9.3.4. Australia
- 9.3.5. Rest of Asia-Pacific
- 9.1. Market Analysis, Insights and Forecast - by Product Type
- 10. Rest of Asia Pacific APAC Meal Replacement Industry Analysis, Insights and Forecast, 2019-2031
- 10.1. Market Analysis, Insights and Forecast - by Product Type
- 10.1.1. Ready-to-Drink Products
- 10.1.2. Nutritional Bars
- 10.1.3. Powdered Supplements
- 10.1.4. Other Product Types
- 10.2. Market Analysis, Insights and Forecast - by Distribution Channel
- 10.2.1. Supermarkets/Hypermarkets
- 10.2.2. Convenience Stores
- 10.2.3. Specialty Stores
- 10.2.4. Online Retail Stores
- 10.2.5. Other Distribution Channels
- 10.3. Market Analysis, Insights and Forecast - by Geography
- 10.3.1. China
- 10.3.2. Japan
- 10.3.3. India
- 10.3.4. Australia
- 10.3.5. Rest of Asia-Pacific
- 10.1. Market Analysis, Insights and Forecast - by Product Type
- 11. North America APAC Meal Replacement Industry Analysis, Insights and Forecast, 2019-2031
- 11.1. Market Analysis, Insights and Forecast - By Country/Sub-region
- 11.1.1 United States
- 11.1.2 Canada
- 11.1.3 Mexico
- 12. Europe APAC Meal Replacement Industry Analysis, Insights and Forecast, 2019-2031
- 12.1. Market Analysis, Insights and Forecast - By Country/Sub-region
- 12.1.1 Germany
- 12.1.2 United Kingdom
- 12.1.3 France
- 12.1.4 Spain
- 12.1.5 Italy
- 12.1.6 Spain
- 12.1.7 Belgium
- 12.1.8 Netherland
- 12.1.9 Nordics
- 12.1.10 Rest of Europe
- 13. Asia Pacific APAC Meal Replacement Industry Analysis, Insights and Forecast, 2019-2031
- 13.1. Market Analysis, Insights and Forecast - By Country/Sub-region
- 13.1.1 China
- 13.1.2 Japan
- 13.1.3 India
- 13.1.4 South Korea
- 13.1.5 Southeast Asia
- 13.1.6 Australia
- 13.1.7 Indonesia
- 13.1.8 Phillipes
- 13.1.9 Singapore
- 13.1.10 Thailandc
- 13.1.11 Rest of Asia Pacific
- 14. South America APAC Meal Replacement Industry Analysis, Insights and Forecast, 2019-2031
- 14.1. Market Analysis, Insights and Forecast - By Country/Sub-region
- 14.1.1 Brazil
- 14.1.2 Argentina
- 14.1.3 Rest of South America
- 15. Middle East & Africa APAC Meal Replacement Industry Analysis, Insights and Forecast, 2019-2031
- 15.1. Market Analysis, Insights and Forecast - By Country/Sub-region
- 15.1.1 UAE
- 15.1.2 South Africa
- 15.1.3 Saudi Arabia
- 15.1.4 Rest of MEA
- 16. Competitive Analysis
- 16.1. Global Market Share Analysis 2024
- 16.2. Company Profiles
- 16.2.1 Sustyfoods Group*List Not Exhaustive
- 16.2.1.1. Overview
- 16.2.1.2. Products
- 16.2.1.3. SWOT Analysis
- 16.2.1.4. Recent Developments
- 16.2.1.5. Financials (Based on Availability)
- 16.2.2 Nestlé SA
- 16.2.2.1. Overview
- 16.2.2.2. Products
- 16.2.2.3. SWOT Analysis
- 16.2.2.4. Recent Developments
- 16.2.2.5. Financials (Based on Availability)
- 16.2.3 Herballife Nutrition
- 16.2.3.1. Overview
- 16.2.3.2. Products
- 16.2.3.3. SWOT Analysis
- 16.2.3.4. Recent Developments
- 16.2.3.5. Financials (Based on Availability)
- 16.2.4 MusclePharm
- 16.2.4.1. Overview
- 16.2.4.2. Products
- 16.2.4.3. SWOT Analysis
- 16.2.4.4. Recent Developments
- 16.2.4.5. Financials (Based on Availability)
- 16.2.5 Amway Corp
- 16.2.5.1. Overview
- 16.2.5.2. Products
- 16.2.5.3. SWOT Analysis
- 16.2.5.4. Recent Developments
- 16.2.5.5. Financials (Based on Availability)
- 16.2.6 Abbott Laboratories
- 16.2.6.1. Overview
- 16.2.6.2. Products
- 16.2.6.3. SWOT Analysis
- 16.2.6.4. Recent Developments
- 16.2.6.5. Financials (Based on Availability)
- 16.2.7 Glanbia PLC
- 16.2.7.1. Overview
- 16.2.7.2. Products
- 16.2.7.3. SWOT Analysis
- 16.2.7.4. Recent Developments
- 16.2.7.5. Financials (Based on Availability)
- 16.2.8 Danone SA
- 16.2.8.1. Overview
- 16.2.8.2. Products
- 16.2.8.3. SWOT Analysis
- 16.2.8.4. Recent Developments
- 16.2.8.5. Financials (Based on Availability)
- 16.2.9 Formulite Pty Ltd
- 16.2.9.1. Overview
- 16.2.9.2. Products
- 16.2.9.3. SWOT Analysis
- 16.2.9.4. Recent Developments
- 16.2.9.5. Financials (Based on Availability)
- 16.2.10 Bulk Nutrients
- 16.2.10.1. Overview
- 16.2.10.2. Products
- 16.2.10.3. SWOT Analysis
- 16.2.10.4. Recent Developments
- 16.2.10.5. Financials (Based on Availability)
- 16.2.11 Sun Pharmaceutical Industries Limited
- 16.2.11.1. Overview
- 16.2.11.2. Products
- 16.2.11.3. SWOT Analysis
- 16.2.11.4. Recent Developments
- 16.2.11.5. Financials (Based on Availability)
- 16.2.12 WonderLab
- 16.2.12.1. Overview
- 16.2.12.2. Products
- 16.2.12.3. SWOT Analysis
- 16.2.12.4. Recent Developments
- 16.2.12.5. Financials (Based on Availability)
- 16.2.1 Sustyfoods Group*List Not Exhaustive
List of Figures
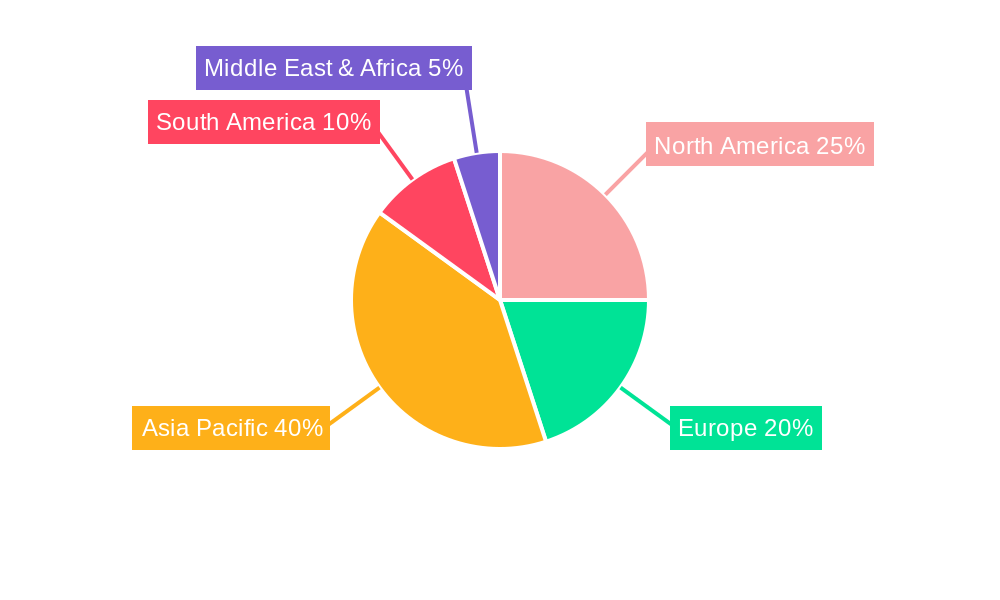
- Figure 1: Global APAC Meal Replacement Industry Revenue Breakdown (Million, %) by Region 2024 & 2032
- Figure 2: North America APAC Meal Replacement Industry Revenue (Million), by Country 2024 & 2032
- Figure 3: North America APAC Meal Replacement Industry Revenue Share (%), by Country 2024 & 2032
- Figure 4: Europe APAC Meal Replacement Industry Revenue (Million), by Country 2024 & 2032
- Figure 5: Europe APAC Meal Replacement Industry Revenue Share (%), by Country 2024 & 2032
- Figure 6: Asia Pacific APAC Meal Replacement Industry Revenue (Million), by Country 2024 & 2032
- Figure 7: Asia Pacific APAC Meal Replacement Industry Revenue Share (%), by Country 2024 & 2032
- Figure 8: South America APAC Meal Replacement Industry Revenue (Million), by Country 2024 & 2032
- Figure 9: South America APAC Meal Replacement Industry Revenue Share (%), by Country 2024 & 2032
- Figure 10: Middle East & Africa APAC Meal Replacement Industry Revenue (Million), by Country 2024 & 2032
- Figure 11: Middle East & Africa APAC Meal Replacement Industry Revenue Share (%), by Country 2024 & 2032
- Figure 12: China APAC Meal Replacement Industry Revenue (Million), by Product Type 2024 & 2032
- Figure 13: China APAC Meal Replacement Industry Revenue Share (%), by Product Type 2024 & 2032
- Figure 14: China APAC Meal Replacement Industry Revenue (Million), by Distribution Channel 2024 & 2032
- Figure 15: China APAC Meal Replacement Industry Revenue Share (%), by Distribution Channel 2024 & 2032
- Figure 16: China APAC Meal Replacement Industry Revenue (Million), by Geography 2024 & 2032
- Figure 17: China APAC Meal Replacement Industry Revenue Share (%), by Geography 2024 & 2032
- Figure 18: China APAC Meal Replacement Industry Revenue (Million), by Country 2024 & 2032
- Figure 19: China APAC Meal Replacement Industry Revenue Share (%), by Country 2024 & 2032
- Figure 20: Japan APAC Meal Replacement Industry Revenue (Million), by Product Type 2024 & 2032
- Figure 21: Japan APAC Meal Replacement Industry Revenue Share (%), by Product Type 2024 & 2032
- Figure 22: Japan APAC Meal Replacement Industry Revenue (Million), by Distribution Channel 2024 & 2032
- Figure 23: Japan APAC Meal Replacement Industry Revenue Share (%), by Distribution Channel 2024 & 2032
- Figure 24: Japan APAC Meal Replacement Industry Revenue (Million), by Geography 2024 & 2032
- Figure 25: Japan APAC Meal Replacement Industry Revenue Share (%), by Geography 2024 & 2032
- Figure 26: Japan APAC Meal Replacement Industry Revenue (Million), by Country 2024 & 2032
- Figure 27: Japan APAC Meal Replacement Industry Revenue Share (%), by Country 2024 & 2032
- Figure 28: India APAC Meal Replacement Industry Revenue (Million), by Product Type 2024 & 2032
- Figure 29: India APAC Meal Replacement Industry Revenue Share (%), by Product Type 2024 & 2032
- Figure 30: India APAC Meal Replacement Industry Revenue (Million), by Distribution Channel 2024 & 2032
- Figure 31: India APAC Meal Replacement Industry Revenue Share (%), by Distribution Channel 2024 & 2032
- Figure 32: India APAC Meal Replacement Industry Revenue (Million), by Geography 2024 & 2032
- Figure 33: India APAC Meal Replacement Industry Revenue Share (%), by Geography 2024 & 2032
- Figure 34: India APAC Meal Replacement Industry Revenue (Million), by Country 2024 & 2032
- Figure 35: India APAC Meal Replacement Industry Revenue Share (%), by Country 2024 & 2032
- Figure 36: Australia APAC Meal Replacement Industry Revenue (Million), by Product Type 2024 & 2032
- Figure 37: Australia APAC Meal Replacement Industry Revenue Share (%), by Product Type 2024 & 2032
- Figure 38: Australia APAC Meal Replacement Industry Revenue (Million), by Distribution Channel 2024 & 2032
- Figure 39: Australia APAC Meal Replacement Industry Revenue Share (%), by Distribution Channel 2024 & 2032
- Figure 40: Australia APAC Meal Replacement Industry Revenue (Million), by Geography 2024 & 2032
- Figure 41: Australia APAC Meal Replacement Industry Revenue Share (%), by Geography 2024 & 2032
- Figure 42: Australia APAC Meal Replacement Industry Revenue (Million), by Country 2024 & 2032
- Figure 43: Australia APAC Meal Replacement Industry Revenue Share (%), by Country 2024 & 2032
- Figure 44: Rest of Asia Pacific APAC Meal Replacement Industry Revenue (Million), by Product Type 2024 & 2032
- Figure 45: Rest of Asia Pacific APAC Meal Replacement Industry Revenue Share (%), by Product Type 2024 & 2032
- Figure 46: Rest of Asia Pacific APAC Meal Replacement Industry Revenue (Million), by Distribution Channel 2024 & 2032
- Figure 47: Rest of Asia Pacific APAC Meal Replacement Industry Revenue Share (%), by Distribution Channel 2024 & 2032
- Figure 48: Rest of Asia Pacific APAC Meal Replacement Industry Revenue (Million), by Geography 2024 & 2032
- Figure 49: Rest of Asia Pacific APAC Meal Replacement Industry Revenue Share (%), by Geography 2024 & 2032
- Figure 50: Rest of Asia Pacific APAC Meal Replacement Industry Revenue (Million), by Country 2024 & 2032
- Figure 51: Rest of Asia Pacific APAC Meal Replacement Industry Revenue Share (%), by Country 2024 & 2032
List of Tables
- Table 1: Global APAC Meal Replacement Industry Revenue Million Forecast, by Region 2019 & 2032
- Table 2: Global APAC Meal Replacement Industry Revenue Million Forecast, by Product Type 2019 & 2032
- Table 3: Global APAC Meal Replacement Industry Revenue Million Forecast, by Distribution Channel 2019 & 2032
- Table 4: Global APAC Meal Replacement Industry Revenue Million Forecast, by Geography 2019 & 2032
- Table 5: Global APAC Meal Replacement Industry Revenue Million Forecast, by Region 2019 & 2032
- Table 6: Global APAC Meal Replacement Industry Revenue Million Forecast, by Country 2019 & 2032
- Table 7: United States APAC Meal Replacement Industry Revenue (Million) Forecast, by Application 2019 & 2032
- Table 8: Canada APAC Meal Replacement Industry Revenue (Million) Forecast, by Application 2019 & 2032
- Table 9: Mexico APAC Meal Replacement Industry Revenue (Million) Forecast, by Application 2019 & 2032
- Table 10: Global APAC Meal Replacement Industry Revenue Million Forecast, by Country 2019 & 2032
- Table 11: Germany APAC Meal Replacement Industry Revenue (Million) Forecast, by Application 2019 & 2032
- Table 12: United Kingdom APAC Meal Replacement Industry Revenue (Million) Forecast, by Application 2019 & 2032
- Table 13: France APAC Meal Replacement Industry Revenue (Million) Forecast, by Application 2019 & 2032
- Table 14: Spain APAC Meal Replacement Industry Revenue (Million) Forecast, by Application 2019 & 2032
- Table 15: Italy APAC Meal Replacement Industry Revenue (Million) Forecast, by Application 2019 & 2032
- Table 16: Spain APAC Meal Replacement Industry Revenue (Million) Forecast, by Application 2019 & 2032
- Table 17: Belgium APAC Meal Replacement Industry Revenue (Million) Forecast, by Application 2019 & 2032
- Table 18: Netherland APAC Meal Replacement Industry Revenue (Million) Forecast, by Application 2019 & 2032
- Table 19: Nordics APAC Meal Replacement Industry Revenue (Million) Forecast, by Application 2019 & 2032
- Table 20: Rest of Europe APAC Meal Replacement Industry Revenue (Million) Forecast, by Application 2019 & 2032
- Table 21: Global APAC Meal Replacement Industry Revenue Million Forecast, by Country 2019 & 2032
- Table 22: China APAC Meal Replacement Industry Revenue (Million) Forecast, by Application 2019 & 2032
- Table 23: Japan APAC Meal Replacement Industry Revenue (Million) Forecast, by Application 2019 & 2032
- Table 24: India APAC Meal Replacement Industry Revenue (Million) Forecast, by Application 2019 & 2032
- Table 25: South Korea APAC Meal Replacement Industry Revenue (Million) Forecast, by Application 2019 & 2032
- Table 26: Southeast Asia APAC Meal Replacement Industry Revenue (Million) Forecast, by Application 2019 & 2032
- Table 27: Australia APAC Meal Replacement Industry Revenue (Million) Forecast, by Application 2019 & 2032
- Table 28: Indonesia APAC Meal Replacement Industry Revenue (Million) Forecast, by Application 2019 & 2032
- Table 29: Phillipes APAC Meal Replacement Industry Revenue (Million) Forecast, by Application 2019 & 2032
- Table 30: Singapore APAC Meal Replacement Industry Revenue (Million) Forecast, by Application 2019 & 2032
- Table 31: Thailandc APAC Meal Replacement Industry Revenue (Million) Forecast, by Application 2019 & 2032
- Table 32: Rest of Asia Pacific APAC Meal Replacement Industry Revenue (Million) Forecast, by Application 2019 & 2032
- Table 33: Global APAC Meal Replacement Industry Revenue Million Forecast, by Country 2019 & 2032
- Table 34: Brazil APAC Meal Replacement Industry Revenue (Million) Forecast, by Application 2019 & 2032
- Table 35: Argentina APAC Meal Replacement Industry Revenue (Million) Forecast, by Application 2019 & 2032
- Table 36: Rest of South America APAC Meal Replacement Industry Revenue (Million) Forecast, by Application 2019 & 2032
- Table 37: Global APAC Meal Replacement Industry Revenue Million Forecast, by Country 2019 & 2032
- Table 38: UAE APAC Meal Replacement Industry Revenue (Million) Forecast, by Application 2019 & 2032
- Table 39: South Africa APAC Meal Replacement Industry Revenue (Million) Forecast, by Application 2019 & 2032
- Table 40: Saudi Arabia APAC Meal Replacement Industry Revenue (Million) Forecast, by Application 2019 & 2032
- Table 41: Rest of MEA APAC Meal Replacement Industry Revenue (Million) Forecast, by Application 2019 & 2032
- Table 42: Global APAC Meal Replacement Industry Revenue Million Forecast, by Product Type 2019 & 2032
- Table 43: Global APAC Meal Replacement Industry Revenue Million Forecast, by Distribution Channel 2019 & 2032
- Table 44: Global APAC Meal Replacement Industry Revenue Million Forecast, by Geography 2019 & 2032
- Table 45: Global APAC Meal Replacement Industry Revenue Million Forecast, by Country 2019 & 2032
- Table 46: Global APAC Meal Replacement Industry Revenue Million Forecast, by Product Type 2019 & 2032
- Table 47: Global APAC Meal Replacement Industry Revenue Million Forecast, by Distribution Channel 2019 & 2032
- Table 48: Global APAC Meal Replacement Industry Revenue Million Forecast, by Geography 2019 & 2032
- Table 49: Global APAC Meal Replacement Industry Revenue Million Forecast, by Country 2019 & 2032
- Table 50: Global APAC Meal Replacement Industry Revenue Million Forecast, by Product Type 2019 & 2032
- Table 51: Global APAC Meal Replacement Industry Revenue Million Forecast, by Distribution Channel 2019 & 2032
- Table 52: Global APAC Meal Replacement Industry Revenue Million Forecast, by Geography 2019 & 2032
- Table 53: Global APAC Meal Replacement Industry Revenue Million Forecast, by Country 2019 & 2032
- Table 54: Global APAC Meal Replacement Industry Revenue Million Forecast, by Product Type 2019 & 2032
- Table 55: Global APAC Meal Replacement Industry Revenue Million Forecast, by Distribution Channel 2019 & 2032
- Table 56: Global APAC Meal Replacement Industry Revenue Million Forecast, by Geography 2019 & 2032
- Table 57: Global APAC Meal Replacement Industry Revenue Million Forecast, by Country 2019 & 2032
- Table 58: Global APAC Meal Replacement Industry Revenue Million Forecast, by Product Type 2019 & 2032
- Table 59: Global APAC Meal Replacement Industry Revenue Million Forecast, by Distribution Channel 2019 & 2032
- Table 60: Global APAC Meal Replacement Industry Revenue Million Forecast, by Geography 2019 & 2032
- Table 61: Global APAC Meal Replacement Industry Revenue Million Forecast, by Country 2019 & 2032
Frequently Asked Questions
1. What is the projected Compound Annual Growth Rate (CAGR) of the APAC Meal Replacement Industry?
The projected CAGR is approximately 6.40%.
2. Which companies are prominent players in the APAC Meal Replacement Industry?
Key companies in the market include Sustyfoods Group*List Not Exhaustive, Nestlé SA, Herballife Nutrition, MusclePharm, Amway Corp, Abbott Laboratories, Glanbia PLC, Danone SA, Formulite Pty Ltd, Bulk Nutrients, Sun Pharmaceutical Industries Limited, WonderLab.
3. What are the main segments of the APAC Meal Replacement Industry?
The market segments include Product Type, Distribution Channel, Geography.
4. Can you provide details about the market size?
The market size is estimated to be USD 3,731.26 Million as of 2022.
5. What are some drivers contributing to market growth?
Consumers Managing Special Diets Strive on Meal Replacements; Rising Demand for Convenient and Small-Portion Meal.
6. What are the notable trends driving market growth?
Consumers Managing Special Diets Strive on Meal Replacements.
7. Are there any restraints impacting market growth?
Highly Priced Meal Replacement Products to Hamper Market Growth.
8. Can you provide examples of recent developments in the market?
January 2023: As a "nutrition sponsor," Herbalife Nutrition India Private Limited collaborated with international women's cricketer Smriti Mandhana. Around 100 sponsorship agreements have been made by Herbalife Nutrition with different elite athletes, teams, and events.
9. What pricing options are available for accessing the report?
Pricing options include single-user, multi-user, and enterprise licenses priced at USD 4750, USD 5250, and USD 8750 respectively.
10. Is the market size provided in terms of value or volume?
The market size is provided in terms of value, measured in Million.
11. Are there any specific market keywords associated with the report?
Yes, the market keyword associated with the report is "APAC Meal Replacement Industry," which aids in identifying and referencing the specific market segment covered.
12. How do I determine which pricing option suits my needs best?
The pricing options vary based on user requirements and access needs. Individual users may opt for single-user licenses, while businesses requiring broader access may choose multi-user or enterprise licenses for cost-effective access to the report.
13. Are there any additional resources or data provided in the APAC Meal Replacement Industry report?
While the report offers comprehensive insights, it's advisable to review the specific contents or supplementary materials provided to ascertain if additional resources or data are available.
14. How can I stay updated on further developments or reports in the APAC Meal Replacement Industry?
To stay informed about further developments, trends, and reports in the APAC Meal Replacement Industry, consider subscribing to industry newsletters, following relevant companies and organizations, or regularly checking reputable industry news sources and publications.
Methodology
Step 1 - Identification of Relevant Samples Size from Population Database


Step 2 - Approaches for Defining Global Market Size (Value, Volume* & Price*)

Note*: In applicable scenarios
Step 3 - Data Sources
Primary Research
- Web Analytics
- Survey Reports
- Research Institute
- Latest Research Reports
- Opinion Leaders
Secondary Research
- Annual Reports
- White Paper
- Latest Press Release
- Industry Association
- Paid Database
- Investor Presentations

Step 4 - Data Triangulation
Involves using different sources of information in order to increase the validity of a study
These sources are likely to be stakeholders in a program - participants, other researchers, program staff, other community members, and so on.
Then we put all data in single framework & apply various statistical tools to find out the dynamic on the market.
During the analysis stage, feedback from the stakeholder groups would be compared to determine areas of agreement as well as areas of divergence
