

Key Insights
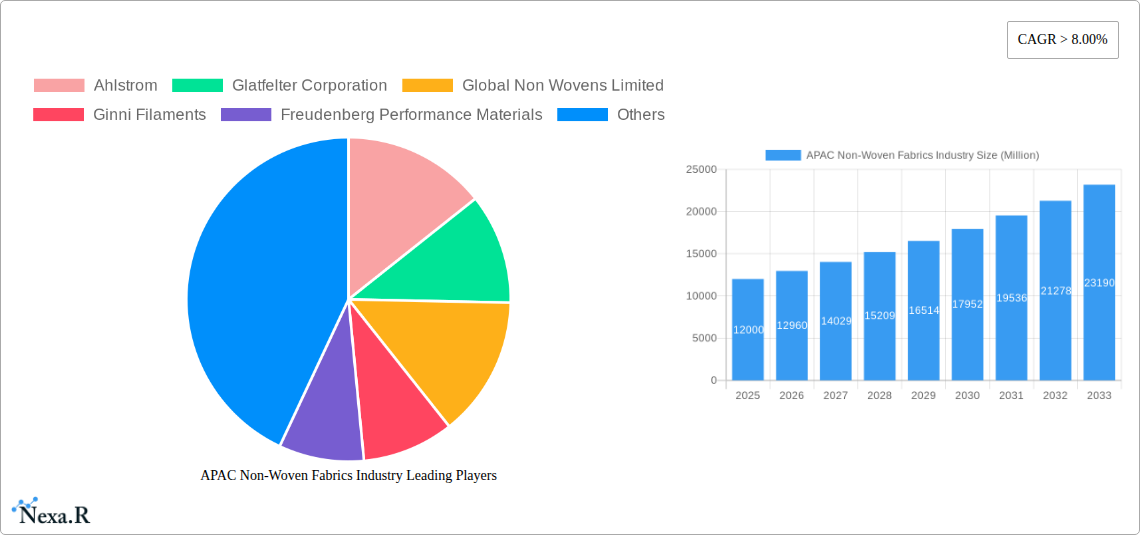
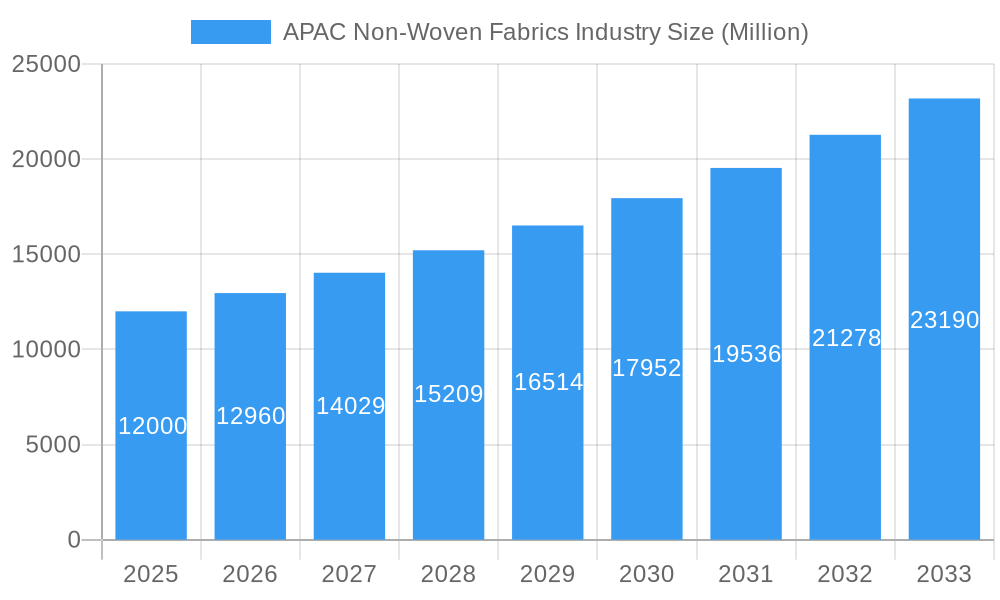
The Asia-Pacific (APAC) non-woven fabrics industry is experiencing robust growth, driven by increasing demand across diverse sectors. The region's burgeoning construction industry, coupled with a rapidly expanding healthcare sector and a thriving automotive manufacturing base, fuels significant consumption of non-woven materials. The preference for hygiene and disposable products, particularly in populous nations like China and India, further contributes to market expansion. Technological advancements, such as the development of sustainable and biodegradable non-woven fabrics, are also impacting the market positively, fostering environmentally conscious consumption. While the precise market size for APAC in 2025 is not explicitly stated, a reasonable estimate can be derived from the global market size of $36.76 billion and the projected CAGR of over 8%. Considering APAC's significant share of global manufacturing and consumption, a conservative estimate for the APAC market size in 2025 would be approximately $12 billion. This projection anticipates continued growth driven by factors mentioned above.
APAC Non-Woven Fabrics Industry Market Size (In Billion)
This growth is expected to continue throughout the forecast period (2025-2033), with a significant portion stemming from increased disposable incomes and rising urbanization across the region. The industry's segmentation by technology (spun-bond, wet-laid, etc.) and material (polyester, polypropylene, etc.) presents numerous opportunities for specialized product development and targeted market penetration. However, challenges remain, including price fluctuations of raw materials, environmental concerns related to certain non-woven materials, and the need for continuous innovation to meet evolving consumer preferences and sustainability standards. Competition amongst established players and new entrants is also intensifying, requiring manufacturers to adopt strategic approaches focused on product differentiation, cost optimization, and supply chain resilience to maintain a strong market position within the dynamic APAC non-woven fabrics landscape.
APAC Non-Woven Fabrics Industry Company Market Share
APAC Non-Woven Fabrics Industry Market Report: 2019-2033
This comprehensive report provides an in-depth analysis of the Asia-Pacific (APAC) non-woven fabrics industry, encompassing market dynamics, growth trends, dominant segments, and key players. The report covers the period from 2019 to 2033, with a base year of 2025 and a forecast period of 2025-2033. This invaluable resource is designed for industry professionals, investors, and strategic decision-makers seeking a clear understanding of this rapidly evolving market. The report utilizes data expressed in million units.
APAC Non-Woven Fabrics Industry Market Dynamics & Structure
This section analyzes the competitive landscape, technological advancements, regulatory environment, and market trends within the APAC non-woven fabrics industry. The market is characterized by a moderate level of concentration, with key players like Ahlstrom, Glatfelter Corporation, and DuPont holding significant market share. However, smaller, regional players like Eximius Innovative Pvt Ltd and Autotech Nonwovens Pvt Ltd are also contributing significantly.
- Market Concentration: xx% of the market is controlled by the top 5 players in 2025. This is expected to slightly decrease to xx% by 2033 due to increased competition and new entrants.
- Technological Innovation: Continuous advancements in spun-bond, wet-laid, and dry-laid technologies are driving efficiency and product diversification. Electrostatic spinning and flash-spun technologies represent emerging growth areas.
- Regulatory Framework: Government regulations concerning environmental sustainability and product safety are increasingly shaping industry practices. Compliance costs are expected to rise, impacting profitability for smaller players.
- Competitive Substitutes: Bio-based and biodegradable non-wovens are emerging as substitutes, presenting both opportunities and challenges to traditional materials.
- End-User Demographics: The construction, healthcare, and automotive sectors are key drivers of demand, with growth fueled by rising infrastructure investments and population expansion. The personal care and consumer goods sectors also contribute to market demand.
- M&A Trends: xx M&A deals were recorded between 2019 and 2024. Consolidation is expected to continue, driven by the need for economies of scale and expansion into new markets.
APAC Non-Woven Fabrics Industry Growth Trends & Insights
The APAC non-woven fabrics market is demonstrating robust and sustained growth, fueled by a confluence of economic, demographic, and technological advancements. The market experienced a significant expansion, growing from an estimated XX million units in 2019 to XX million units in 2024, reflecting a compound annual growth rate (CAGR) of XX%. Projections indicate this upward trajectory will persist, with the market expected to reach an impressive XX million units by 2033, maintaining a healthy CAGR of XX% during the forecast period. Key drivers underpinning this expansion include rising disposable incomes, leading to increased consumer spending on hygiene and disposable products; a burgeoning demand across a diverse array of end-use industries such as healthcare, hygiene, automotive, and construction; and continuous technological innovations that enhance material performance and create new application possibilities.
- Market Size Evolution: The market is projected to witness consistent growth across all its major segments throughout the forecast period, underscoring the broad-based demand for non-woven fabrics in the region.
- Adoption Rates: A heightened awareness of the indispensable applications of non-woven fabrics in healthcare, particularly in personal protective equipment (PPE) and medical disposables, coupled with the growing demand for hygiene products, is significantly driving market penetration. This is especially evident in developing economies within APAC where disposable income and healthcare infrastructure are rapidly improving.
- Technological Disruptions: The relentless introduction of advanced materials, such as biodegradable and bio-based non-wovens, alongside cutting-edge manufacturing processes like advanced hydroentanglement and needle-punching technologies, are revolutionizing product performance. These innovations are not only improving the properties of existing products but also unlocking novel applications in areas like filtration, geotextiles, and specialized industrial uses.
- Consumer Behavior Shifts: A pronounced and growing consumer preference for eco-friendly, sustainable, and ethically produced products is increasingly influencing material selection and production processes. Manufacturers are responding by investing in recyclable, biodegradable, and compostable non-woven materials, aligning with global sustainability agendas and consumer expectations.
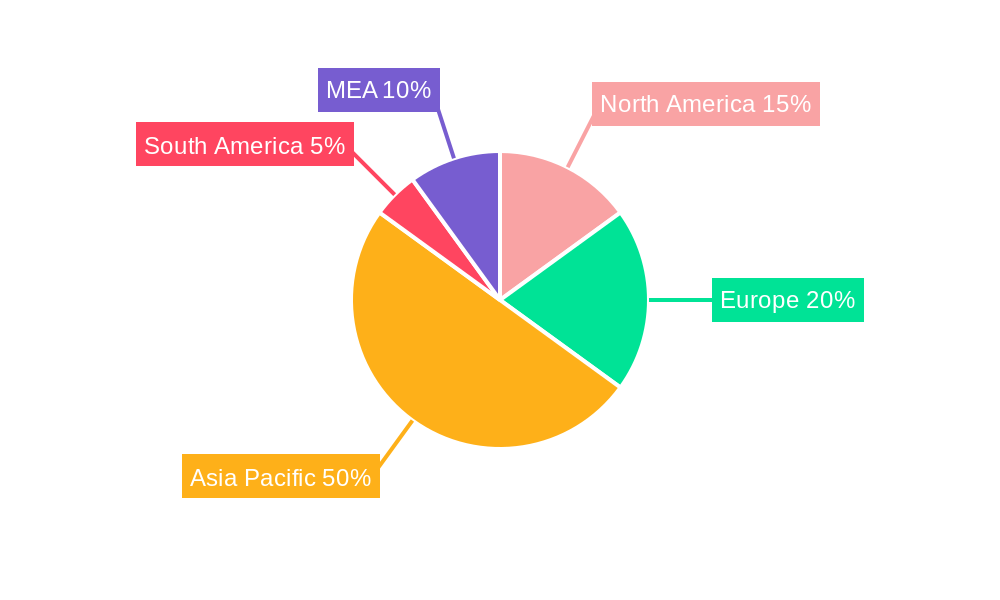
Dominant Regions, Countries, or Segments in APAC Non-Woven Fabrics Industry
Within the dynamic APAC non-woven fabrics landscape, China and India stand out as the preeminent markets, propelled by their robust economic expansion, rapidly urbanizing populations, and substantial investments in infrastructure development. These factors create a fertile ground for the increased consumption of non-woven materials. Analyzing the segment breakdown, spun-bond technology emerges as the dominant force, primarily attributed to its inherent versatility, cost-effectiveness, and high-volume production capabilities. In terms of material composition, polypropylene and polyester remain the most widely utilized polymers, owing to their desirable properties such as strength, durability, water resistance, and affordability, which make them suitable for a broad spectrum of applications.
- Leading Region: China is projected to maintain its leadership position, capturing approximately XX% of the market share in 2025. Significant growth is also anticipated in other rapidly developing Asian economies, indicating a broader regional expansion.
- Dominant Technology: Spun-bond technology is expected to continue its reign, holding an estimated XX% market share in 2025. Its widespread adoption is a testament to its economic viability and high production efficiency for various applications.
- Major Material: Polypropylene is anticipated to be the preferred material, commanding a substantial market share of around XX% in 2025. Its cost-efficiency and adaptability to diverse product needs underpin its dominance.
- Key End-User Industry: The construction industry is poised to be a significant contributor, expected to hold approximately XX% of the market share in 2025. This surge is largely driven by increased governmental spending on infrastructure projects and the growing demand for building materials that offer enhanced performance and insulation properties.
APAC Non-Woven Fabrics Industry Product Landscape
The APAC non-woven fabrics market features a wide array of products tailored to specific applications. Innovations focus on enhancing performance characteristics, such as increased strength, breathability, and liquid repellency. Bio-based and recyclable materials are gaining traction, driven by growing environmental concerns. Product differentiation through unique surface treatments and advanced filtration capabilities is becoming increasingly important.
Key Drivers, Barriers & Challenges in APAP Non-Woven Fabrics Industry
Key Drivers:
- Rapid industrialization and urbanization in APAC.
- Rising demand from healthcare, automotive and construction sectors.
- Technological advancements resulting in improved product quality.
- Favorable government policies supporting manufacturing.
Key Challenges:
- Fluctuations in raw material prices.
- Intense competition among domestic and international players.
- Environmental concerns related to waste management.
- Stringent regulatory compliance requirements.
Emerging Opportunities in APAP Non-Woven Fabrics Industry
- Growth in sustainable and eco-friendly non-woven fabrics.
- Expansion into niche applications like filtration and personal care.
- Adoption of advanced manufacturing technologies like 3D printing.
- Increased penetration in developing economies with high growth potential.
Growth Accelerators in the APAC Non-Woven Fabrics Industry
Technological advancements, strategic partnerships, and government support will be key catalysts for long-term growth. Focus on sustainable materials and expansion into high-growth markets will drive future success in this sector.
Key Players Shaping the APAC Non-Woven Fabrics Industry Market
- Ahlstrom
- Glatfelter Corporation
- Global Non Wovens Limited
- Ginni Filaments
- Freudenberg Performance Materials
- Cygnus Group
- Eximius Innovative Pvt Ltd
- Fitesa S A
- DuPont
- Autotech Nonwovens Pvt Ltd
- TORAY INDUSTRIES INC
- Johns Manville
- Berry Global Inc
- Reliance Non-woven Industry LLC
Notable Milestones in APAC Non-Woven Fabrics Industry Sector
- November 2022: Fitesa announced the expansion of its production capacity for nonwoven fabrics for medical applications.
In-Depth APAC Non-Woven Fabrics Industry Market Outlook
The APAC non-woven fabrics market is strategically positioned for substantial and sustained growth in the coming years. This positive outlook is underpinned by a dual engine of continuous technological innovation and an ever-expanding demand across a multitude of diverse and evolving sectors. The industry is increasingly recognizing the imperative for strategic investments in sustainable materials, including recycled and biodegradable options, to meet growing environmental concerns and regulatory pressures. Furthermore, exploring and expanding into untapped emerging markets within the APAC region will be a critical strategy for manufacturers aiming to capture future market share and establish a competitive edge. The industry's overarching focus on enhancing sustainability metrics and developing advanced functionalities for its products will undoubtedly shape its trajectory, driving innovation and market evolution for the foreseeable future.
APAC Non-Woven Fabrics Industry Segmentation
-
1. Technology
- 1.1. Spun-Bond
- 1.2. Wet Laid
- 1.3. Dry Laid
- 1.4. Others (Electrostatic spinning, Flash-spun, etc.)
-
2. Material
- 2.1. Polyester
- 2.2. Polypropylene
- 2.3. Polyethylene
- 2.4. Rayon
- 2.5. Others (Wood Pulp, Bio-Component, etc.)
-
3. End-User Industry
- 3.1. Construction
- 3.2. Textiles
- 3.3. Healthcare
- 3.4. Automotive
- 3.5. Others (Personal Care, Consumer Goods, etc.)
-
4. Geography
- 4.1. China
- 4.2. India
- 4.3. Japan
- 4.4. South Korea
- 4.5. Indonesia
- 4.6. Malaysia
- 4.7. Thailand
- 4.8. Vietnam
- 4.9. Rest of Asia-Pacific
APAC Non-Woven Fabrics Industry Segmentation By Geography
- 1. China
- 2. India
- 3. Japan
- 4. South Korea
- 5. Indonesia
- 6. Malaysia
- 7. Thailand
- 8. Vietnam
- 9. Rest of Asia Pacific
APAC Non-Woven Fabrics Industry Regional Market Share
Geographic Coverage of APAC Non-Woven Fabrics Industry
APAC Non-Woven Fabrics Industry REPORT HIGHLIGHTS
| Aspects | Details |
|---|---|
| Study Period | 2020-2034 |
| Base Year | 2025 |
| Estimated Year | 2026 |
| Forecast Period | 2026-2034 |
| Historical Period | 2020-2025 |
| Growth Rate | CAGR of > 8.00% from 2020-2034 |
| Segmentation |
|
Table of Contents
- 1. Introduction
- 1.1. Research Scope
- 1.2. Market Segmentation
- 1.3. Research Objective
- 1.4. Definitions and Assumptions
- 2. Executive Summary
- 2.1. Market Snapshot
- 3. Market Dynamics
- 3.1. Market Drivers
- 3.2. Market Restrains
- 3.3. Market Trends
- 3.4. Market Opportunities
- 4. Market Factor Analysis
- 4.1. Porters Five Forces
- 4.1.1. Bargaining Power of Suppliers
- 4.1.2. Bargaining Power of Buyers
- 4.1.3. Threat of New Entrants
- 4.1.4. Threat of Substitutes
- 4.1.5. Competitive Rivalry
- 4.2. PESTEL analysis
- 4.3. BCG Analysis
- 4.3.1. Stars (High Growth, High Market Share)
- 4.3.2. Cash Cows (Low Growth, High Market Share)
- 4.3.3. Question Mark (High Growth, Low Market Share)
- 4.3.4. Dogs (Low Growth, Low Market Share)
- 4.4. Ansoff Matrix Analysis
- 4.5. Supply Chain Analysis
- 4.6. Regulatory Landscape
- 4.7. Current Market Potential and Opportunity Assessment (TAM–SAM–SOM Framework)
- 4.8. NRP Analyst Note
- 4.1. Porters Five Forces
- 5. Market Analysis, Insights and Forecast 2021-2033
- 5.1. Market Analysis, Insights and Forecast - by Technology
- 5.1.1. Spun-Bond
- 5.1.2. Wet Laid
- 5.1.3. Dry Laid
- 5.1.4. Others (Electrostatic spinning, Flash-spun, etc.)
- 5.2. Market Analysis, Insights and Forecast - by Material
- 5.2.1. Polyester
- 5.2.2. Polypropylene
- 5.2.3. Polyethylene
- 5.2.4. Rayon
- 5.2.5. Others (Wood Pulp, Bio-Component, etc.)
- 5.3. Market Analysis, Insights and Forecast - by End-User Industry
- 5.3.1. Construction
- 5.3.2. Textiles
- 5.3.3. Healthcare
- 5.3.4. Automotive
- 5.3.5. Others (Personal Care, Consumer Goods, etc.)
- 5.4. Market Analysis, Insights and Forecast - by Geography
- 5.4.1. China
- 5.4.2. India
- 5.4.3. Japan
- 5.4.4. South Korea
- 5.4.5. Indonesia
- 5.4.6. Malaysia
- 5.4.7. Thailand
- 5.4.8. Vietnam
- 5.4.9. Rest of Asia-Pacific
- 5.5. Market Analysis, Insights and Forecast - by Region
- 5.5.1. China
- 5.5.2. India
- 5.5.3. Japan
- 5.5.4. South Korea
- 5.5.5. Indonesia
- 5.5.6. Malaysia
- 5.5.7. Thailand
- 5.5.8. Vietnam
- 5.5.9. Rest of Asia Pacific
- 5.1. Market Analysis, Insights and Forecast - by Technology
- 6. Global APAC Non-Woven Fabrics Industry Analysis, Insights and Forecast, 2021-2033
- 6.1. Market Analysis, Insights and Forecast - by Technology
- 6.1.1. Spun-Bond
- 6.1.2. Wet Laid
- 6.1.3. Dry Laid
- 6.1.4. Others (Electrostatic spinning, Flash-spun, etc.)
- 6.2. Market Analysis, Insights and Forecast - by Material
- 6.2.1. Polyester
- 6.2.2. Polypropylene
- 6.2.3. Polyethylene
- 6.2.4. Rayon
- 6.2.5. Others (Wood Pulp, Bio-Component, etc.)
- 6.3. Market Analysis, Insights and Forecast - by End-User Industry
- 6.3.1. Construction
- 6.3.2. Textiles
- 6.3.3. Healthcare
- 6.3.4. Automotive
- 6.3.5. Others (Personal Care, Consumer Goods, etc.)
- 6.4. Market Analysis, Insights and Forecast - by Geography
- 6.4.1. China
- 6.4.2. India
- 6.4.3. Japan
- 6.4.4. South Korea
- 6.4.5. Indonesia
- 6.4.6. Malaysia
- 6.4.7. Thailand
- 6.4.8. Vietnam
- 6.4.9. Rest of Asia-Pacific
- 6.1. Market Analysis, Insights and Forecast - by Technology
- 7. China APAC Non-Woven Fabrics Industry Analysis, Insights and Forecast, 2020-2032
- 7.1. Market Analysis, Insights and Forecast - by Technology
- 7.1.1. Spun-Bond
- 7.1.2. Wet Laid
- 7.1.3. Dry Laid
- 7.1.4. Others (Electrostatic spinning, Flash-spun, etc.)
- 7.2. Market Analysis, Insights and Forecast - by Material
- 7.2.1. Polyester
- 7.2.2. Polypropylene
- 7.2.3. Polyethylene
- 7.2.4. Rayon
- 7.2.5. Others (Wood Pulp, Bio-Component, etc.)
- 7.3. Market Analysis, Insights and Forecast - by End-User Industry
- 7.3.1. Construction
- 7.3.2. Textiles
- 7.3.3. Healthcare
- 7.3.4. Automotive
- 7.3.5. Others (Personal Care, Consumer Goods, etc.)
- 7.4. Market Analysis, Insights and Forecast - by Geography
- 7.4.1. China
- 7.4.2. India
- 7.4.3. Japan
- 7.4.4. South Korea
- 7.4.5. Indonesia
- 7.4.6. Malaysia
- 7.4.7. Thailand
- 7.4.8. Vietnam
- 7.4.9. Rest of Asia-Pacific
- 7.1. Market Analysis, Insights and Forecast - by Technology
- 8. India APAC Non-Woven Fabrics Industry Analysis, Insights and Forecast, 2020-2032
- 8.1. Market Analysis, Insights and Forecast - by Technology
- 8.1.1. Spun-Bond
- 8.1.2. Wet Laid
- 8.1.3. Dry Laid
- 8.1.4. Others (Electrostatic spinning, Flash-spun, etc.)
- 8.2. Market Analysis, Insights and Forecast - by Material
- 8.2.1. Polyester
- 8.2.2. Polypropylene
- 8.2.3. Polyethylene
- 8.2.4. Rayon
- 8.2.5. Others (Wood Pulp, Bio-Component, etc.)
- 8.3. Market Analysis, Insights and Forecast - by End-User Industry
- 8.3.1. Construction
- 8.3.2. Textiles
- 8.3.3. Healthcare
- 8.3.4. Automotive
- 8.3.5. Others (Personal Care, Consumer Goods, etc.)
- 8.4. Market Analysis, Insights and Forecast - by Geography
- 8.4.1. China
- 8.4.2. India
- 8.4.3. Japan
- 8.4.4. South Korea
- 8.4.5. Indonesia
- 8.4.6. Malaysia
- 8.4.7. Thailand
- 8.4.8. Vietnam
- 8.4.9. Rest of Asia-Pacific
- 8.1. Market Analysis, Insights and Forecast - by Technology
- 9. Japan APAC Non-Woven Fabrics Industry Analysis, Insights and Forecast, 2020-2032
- 9.1. Market Analysis, Insights and Forecast - by Technology
- 9.1.1. Spun-Bond
- 9.1.2. Wet Laid
- 9.1.3. Dry Laid
- 9.1.4. Others (Electrostatic spinning, Flash-spun, etc.)
- 9.2. Market Analysis, Insights and Forecast - by Material
- 9.2.1. Polyester
- 9.2.2. Polypropylene
- 9.2.3. Polyethylene
- 9.2.4. Rayon
- 9.2.5. Others (Wood Pulp, Bio-Component, etc.)
- 9.3. Market Analysis, Insights and Forecast - by End-User Industry
- 9.3.1. Construction
- 9.3.2. Textiles
- 9.3.3. Healthcare
- 9.3.4. Automotive
- 9.3.5. Others (Personal Care, Consumer Goods, etc.)
- 9.4. Market Analysis, Insights and Forecast - by Geography
- 9.4.1. China
- 9.4.2. India
- 9.4.3. Japan
- 9.4.4. South Korea
- 9.4.5. Indonesia
- 9.4.6. Malaysia
- 9.4.7. Thailand
- 9.4.8. Vietnam
- 9.4.9. Rest of Asia-Pacific
- 9.1. Market Analysis, Insights and Forecast - by Technology
- 10. South Korea APAC Non-Woven Fabrics Industry Analysis, Insights and Forecast, 2020-2032
- 10.1. Market Analysis, Insights and Forecast - by Technology
- 10.1.1. Spun-Bond
- 10.1.2. Wet Laid
- 10.1.3. Dry Laid
- 10.1.4. Others (Electrostatic spinning, Flash-spun, etc.)
- 10.2. Market Analysis, Insights and Forecast - by Material
- 10.2.1. Polyester
- 10.2.2. Polypropylene
- 10.2.3. Polyethylene
- 10.2.4. Rayon
- 10.2.5. Others (Wood Pulp, Bio-Component, etc.)
- 10.3. Market Analysis, Insights and Forecast - by End-User Industry
- 10.3.1. Construction
- 10.3.2. Textiles
- 10.3.3. Healthcare
- 10.3.4. Automotive
- 10.3.5. Others (Personal Care, Consumer Goods, etc.)
- 10.4. Market Analysis, Insights and Forecast - by Geography
- 10.4.1. China
- 10.4.2. India
- 10.4.3. Japan
- 10.4.4. South Korea
- 10.4.5. Indonesia
- 10.4.6. Malaysia
- 10.4.7. Thailand
- 10.4.8. Vietnam
- 10.4.9. Rest of Asia-Pacific
- 10.1. Market Analysis, Insights and Forecast - by Technology
- 11. Indonesia APAC Non-Woven Fabrics Industry Analysis, Insights and Forecast, 2020-2032
- 11.1. Market Analysis, Insights and Forecast - by Technology
- 11.1.1. Spun-Bond
- 11.1.2. Wet Laid
- 11.1.3. Dry Laid
- 11.1.4. Others (Electrostatic spinning, Flash-spun, etc.)
- 11.2. Market Analysis, Insights and Forecast - by Material
- 11.2.1. Polyester
- 11.2.2. Polypropylene
- 11.2.3. Polyethylene
- 11.2.4. Rayon
- 11.2.5. Others (Wood Pulp, Bio-Component, etc.)
- 11.3. Market Analysis, Insights and Forecast - by End-User Industry
- 11.3.1. Construction
- 11.3.2. Textiles
- 11.3.3. Healthcare
- 11.3.4. Automotive
- 11.3.5. Others (Personal Care, Consumer Goods, etc.)
- 11.4. Market Analysis, Insights and Forecast - by Geography
- 11.4.1. China
- 11.4.2. India
- 11.4.3. Japan
- 11.4.4. South Korea
- 11.4.5. Indonesia
- 11.4.6. Malaysia
- 11.4.7. Thailand
- 11.4.8. Vietnam
- 11.4.9. Rest of Asia-Pacific
- 11.1. Market Analysis, Insights and Forecast - by Technology
- 12. Malaysia APAC Non-Woven Fabrics Industry Analysis, Insights and Forecast, 2020-2032
- 12.1. Market Analysis, Insights and Forecast - by Technology
- 12.1.1. Spun-Bond
- 12.1.2. Wet Laid
- 12.1.3. Dry Laid
- 12.1.4. Others (Electrostatic spinning, Flash-spun, etc.)
- 12.2. Market Analysis, Insights and Forecast - by Material
- 12.2.1. Polyester
- 12.2.2. Polypropylene
- 12.2.3. Polyethylene
- 12.2.4. Rayon
- 12.2.5. Others (Wood Pulp, Bio-Component, etc.)
- 12.3. Market Analysis, Insights and Forecast - by End-User Industry
- 12.3.1. Construction
- 12.3.2. Textiles
- 12.3.3. Healthcare
- 12.3.4. Automotive
- 12.3.5. Others (Personal Care, Consumer Goods, etc.)
- 12.4. Market Analysis, Insights and Forecast - by Geography
- 12.4.1. China
- 12.4.2. India
- 12.4.3. Japan
- 12.4.4. South Korea
- 12.4.5. Indonesia
- 12.4.6. Malaysia
- 12.4.7. Thailand
- 12.4.8. Vietnam
- 12.4.9. Rest of Asia-Pacific
- 12.1. Market Analysis, Insights and Forecast - by Technology
- 13. Thailand APAC Non-Woven Fabrics Industry Analysis, Insights and Forecast, 2020-2032
- 13.1. Market Analysis, Insights and Forecast - by Technology
- 13.1.1. Spun-Bond
- 13.1.2. Wet Laid
- 13.1.3. Dry Laid
- 13.1.4. Others (Electrostatic spinning, Flash-spun, etc.)
- 13.2. Market Analysis, Insights and Forecast - by Material
- 13.2.1. Polyester
- 13.2.2. Polypropylene
- 13.2.3. Polyethylene
- 13.2.4. Rayon
- 13.2.5. Others (Wood Pulp, Bio-Component, etc.)
- 13.3. Market Analysis, Insights and Forecast - by End-User Industry
- 13.3.1. Construction
- 13.3.2. Textiles
- 13.3.3. Healthcare
- 13.3.4. Automotive
- 13.3.5. Others (Personal Care, Consumer Goods, etc.)
- 13.4. Market Analysis, Insights and Forecast - by Geography
- 13.4.1. China
- 13.4.2. India
- 13.4.3. Japan
- 13.4.4. South Korea
- 13.4.5. Indonesia
- 13.4.6. Malaysia
- 13.4.7. Thailand
- 13.4.8. Vietnam
- 13.4.9. Rest of Asia-Pacific
- 13.1. Market Analysis, Insights and Forecast - by Technology
- 14. Vietnam APAC Non-Woven Fabrics Industry Analysis, Insights and Forecast, 2020-2032
- 14.1. Market Analysis, Insights and Forecast - by Technology
- 14.1.1. Spun-Bond
- 14.1.2. Wet Laid
- 14.1.3. Dry Laid
- 14.1.4. Others (Electrostatic spinning, Flash-spun, etc.)
- 14.2. Market Analysis, Insights and Forecast - by Material
- 14.2.1. Polyester
- 14.2.2. Polypropylene
- 14.2.3. Polyethylene
- 14.2.4. Rayon
- 14.2.5. Others (Wood Pulp, Bio-Component, etc.)
- 14.3. Market Analysis, Insights and Forecast - by End-User Industry
- 14.3.1. Construction
- 14.3.2. Textiles
- 14.3.3. Healthcare
- 14.3.4. Automotive
- 14.3.5. Others (Personal Care, Consumer Goods, etc.)
- 14.4. Market Analysis, Insights and Forecast - by Geography
- 14.4.1. China
- 14.4.2. India
- 14.4.3. Japan
- 14.4.4. South Korea
- 14.4.5. Indonesia
- 14.4.6. Malaysia
- 14.4.7. Thailand
- 14.4.8. Vietnam
- 14.4.9. Rest of Asia-Pacific
- 14.1. Market Analysis, Insights and Forecast - by Technology
- 15. Rest of Asia Pacific APAC Non-Woven Fabrics Industry Analysis, Insights and Forecast, 2020-2032
- 15.1. Market Analysis, Insights and Forecast - by Technology
- 15.1.1. Spun-Bond
- 15.1.2. Wet Laid
- 15.1.3. Dry Laid
- 15.1.4. Others (Electrostatic spinning, Flash-spun, etc.)
- 15.2. Market Analysis, Insights and Forecast - by Material
- 15.2.1. Polyester
- 15.2.2. Polypropylene
- 15.2.3. Polyethylene
- 15.2.4. Rayon
- 15.2.5. Others (Wood Pulp, Bio-Component, etc.)
- 15.3. Market Analysis, Insights and Forecast - by End-User Industry
- 15.3.1. Construction
- 15.3.2. Textiles
- 15.3.3. Healthcare
- 15.3.4. Automotive
- 15.3.5. Others (Personal Care, Consumer Goods, etc.)
- 15.4. Market Analysis, Insights and Forecast - by Geography
- 15.4.1. China
- 15.4.2. India
- 15.4.3. Japan
- 15.4.4. South Korea
- 15.4.5. Indonesia
- 15.4.6. Malaysia
- 15.4.7. Thailand
- 15.4.8. Vietnam
- 15.4.9. Rest of Asia-Pacific
- 15.1. Market Analysis, Insights and Forecast - by Technology
- 16. Competitive Analysis
- 16.1. Company Profiles
- 16.1.1 Ahlstrom
- 16.1.1.1. Company Overview
- 16.1.1.2. Products
- 16.1.1.3. Company Financials
- 16.1.1.4. SWOT Analysis
- 16.1.2 Glatfelter Corporation
- 16.1.2.1. Company Overview
- 16.1.2.2. Products
- 16.1.2.3. Company Financials
- 16.1.2.4. SWOT Analysis
- 16.1.3 Global Non Wovens Limited
- 16.1.3.1. Company Overview
- 16.1.3.2. Products
- 16.1.3.3. Company Financials
- 16.1.3.4. SWOT Analysis
- 16.1.4 Ginni Filaments
- 16.1.4.1. Company Overview
- 16.1.4.2. Products
- 16.1.4.3. Company Financials
- 16.1.4.4. SWOT Analysis
- 16.1.5 Freudenberg Performance Materials
- 16.1.5.1. Company Overview
- 16.1.5.2. Products
- 16.1.5.3. Company Financials
- 16.1.5.4. SWOT Analysis
- 16.1.6 Cygnus Group
- 16.1.6.1. Company Overview
- 16.1.6.2. Products
- 16.1.6.3. Company Financials
- 16.1.6.4. SWOT Analysis
- 16.1.7 Eximius Innovative Pvt Ltd
- 16.1.7.1. Company Overview
- 16.1.7.2. Products
- 16.1.7.3. Company Financials
- 16.1.7.4. SWOT Analysis
- 16.1.8 Fitesa S A
- 16.1.8.1. Company Overview
- 16.1.8.2. Products
- 16.1.8.3. Company Financials
- 16.1.8.4. SWOT Analysis
- 16.1.9 DuPont
- 16.1.9.1. Company Overview
- 16.1.9.2. Products
- 16.1.9.3. Company Financials
- 16.1.9.4. SWOT Analysis
- 16.1.10 Autotech Nonwovens Pvt Ltd
- 16.1.10.1. Company Overview
- 16.1.10.2. Products
- 16.1.10.3. Company Financials
- 16.1.10.4. SWOT Analysis
- 16.1.11 TORAY INDUSTRIES INC *List Not Exhaustive
- 16.1.11.1. Company Overview
- 16.1.11.2. Products
- 16.1.11.3. Company Financials
- 16.1.11.4. SWOT Analysis
- 16.1.12 Johns Manville
- 16.1.12.1. Company Overview
- 16.1.12.2. Products
- 16.1.12.3. Company Financials
- 16.1.12.4. SWOT Analysis
- 16.1.13 Berry Global Inc
- 16.1.13.1. Company Overview
- 16.1.13.2. Products
- 16.1.13.3. Company Financials
- 16.1.13.4. SWOT Analysis
- 16.1.14 Reliance Non-woven Industry LLC
- 16.1.14.1. Company Overview
- 16.1.14.2. Products
- 16.1.14.3. Company Financials
- 16.1.14.4. SWOT Analysis
- 16.1.1 Ahlstrom
- 16.2. Market Entropy
- 16.2.1 Company's Key Areas Served
- 16.2.2 Recent Developments
- 16.3. Company Market Share Analysis 2025
- 16.3.1 Top 5 Companies Market Share Analysis
- 16.3.2 Top 3 Companies Market Share Analysis
- 16.4. List of Potential Customers
- 17. Research Methodology
List of Figures
- Figure 1: Global APAC Non-Woven Fabrics Industry Revenue Breakdown (Million, %) by Region 2025 & 2033
- Figure 2: Global APAC Non-Woven Fabrics Industry Volume Breakdown (K Tons, %) by Region 2025 & 2033
- Figure 3: China APAC Non-Woven Fabrics Industry Revenue (Million), by Technology 2025 & 2033
- Figure 4: China APAC Non-Woven Fabrics Industry Volume (K Tons), by Technology 2025 & 2033
- Figure 5: China APAC Non-Woven Fabrics Industry Revenue Share (%), by Technology 2025 & 2033
- Figure 6: China APAC Non-Woven Fabrics Industry Volume Share (%), by Technology 2025 & 2033
- Figure 7: China APAC Non-Woven Fabrics Industry Revenue (Million), by Material 2025 & 2033
- Figure 8: China APAC Non-Woven Fabrics Industry Volume (K Tons), by Material 2025 & 2033
- Figure 9: China APAC Non-Woven Fabrics Industry Revenue Share (%), by Material 2025 & 2033
- Figure 10: China APAC Non-Woven Fabrics Industry Volume Share (%), by Material 2025 & 2033
- Figure 11: China APAC Non-Woven Fabrics Industry Revenue (Million), by End-User Industry 2025 & 2033
- Figure 12: China APAC Non-Woven Fabrics Industry Volume (K Tons), by End-User Industry 2025 & 2033
- Figure 13: China APAC Non-Woven Fabrics Industry Revenue Share (%), by End-User Industry 2025 & 2033
- Figure 14: China APAC Non-Woven Fabrics Industry Volume Share (%), by End-User Industry 2025 & 2033
- Figure 15: China APAC Non-Woven Fabrics Industry Revenue (Million), by Geography 2025 & 2033
- Figure 16: China APAC Non-Woven Fabrics Industry Volume (K Tons), by Geography 2025 & 2033
- Figure 17: China APAC Non-Woven Fabrics Industry Revenue Share (%), by Geography 2025 & 2033
- Figure 18: China APAC Non-Woven Fabrics Industry Volume Share (%), by Geography 2025 & 2033
- Figure 19: China APAC Non-Woven Fabrics Industry Revenue (Million), by Country 2025 & 2033
- Figure 20: China APAC Non-Woven Fabrics Industry Volume (K Tons), by Country 2025 & 2033
- Figure 21: China APAC Non-Woven Fabrics Industry Revenue Share (%), by Country 2025 & 2033
- Figure 22: China APAC Non-Woven Fabrics Industry Volume Share (%), by Country 2025 & 2033
- Figure 23: India APAC Non-Woven Fabrics Industry Revenue (Million), by Technology 2025 & 2033
- Figure 24: India APAC Non-Woven Fabrics Industry Volume (K Tons), by Technology 2025 & 2033
- Figure 25: India APAC Non-Woven Fabrics Industry Revenue Share (%), by Technology 2025 & 2033
- Figure 26: India APAC Non-Woven Fabrics Industry Volume Share (%), by Technology 2025 & 2033
- Figure 27: India APAC Non-Woven Fabrics Industry Revenue (Million), by Material 2025 & 2033
- Figure 28: India APAC Non-Woven Fabrics Industry Volume (K Tons), by Material 2025 & 2033
- Figure 29: India APAC Non-Woven Fabrics Industry Revenue Share (%), by Material 2025 & 2033
- Figure 30: India APAC Non-Woven Fabrics Industry Volume Share (%), by Material 2025 & 2033
- Figure 31: India APAC Non-Woven Fabrics Industry Revenue (Million), by End-User Industry 2025 & 2033
- Figure 32: India APAC Non-Woven Fabrics Industry Volume (K Tons), by End-User Industry 2025 & 2033
- Figure 33: India APAC Non-Woven Fabrics Industry Revenue Share (%), by End-User Industry 2025 & 2033
- Figure 34: India APAC Non-Woven Fabrics Industry Volume Share (%), by End-User Industry 2025 & 2033
- Figure 35: India APAC Non-Woven Fabrics Industry Revenue (Million), by Geography 2025 & 2033
- Figure 36: India APAC Non-Woven Fabrics Industry Volume (K Tons), by Geography 2025 & 2033
- Figure 37: India APAC Non-Woven Fabrics Industry Revenue Share (%), by Geography 2025 & 2033
- Figure 38: India APAC Non-Woven Fabrics Industry Volume Share (%), by Geography 2025 & 2033
- Figure 39: India APAC Non-Woven Fabrics Industry Revenue (Million), by Country 2025 & 2033
- Figure 40: India APAC Non-Woven Fabrics Industry Volume (K Tons), by Country 2025 & 2033
- Figure 41: India APAC Non-Woven Fabrics Industry Revenue Share (%), by Country 2025 & 2033
- Figure 42: India APAC Non-Woven Fabrics Industry Volume Share (%), by Country 2025 & 2033
- Figure 43: Japan APAC Non-Woven Fabrics Industry Revenue (Million), by Technology 2025 & 2033
- Figure 44: Japan APAC Non-Woven Fabrics Industry Volume (K Tons), by Technology 2025 & 2033
- Figure 45: Japan APAC Non-Woven Fabrics Industry Revenue Share (%), by Technology 2025 & 2033
- Figure 46: Japan APAC Non-Woven Fabrics Industry Volume Share (%), by Technology 2025 & 2033
- Figure 47: Japan APAC Non-Woven Fabrics Industry Revenue (Million), by Material 2025 & 2033
- Figure 48: Japan APAC Non-Woven Fabrics Industry Volume (K Tons), by Material 2025 & 2033
- Figure 49: Japan APAC Non-Woven Fabrics Industry Revenue Share (%), by Material 2025 & 2033
- Figure 50: Japan APAC Non-Woven Fabrics Industry Volume Share (%), by Material 2025 & 2033
- Figure 51: Japan APAC Non-Woven Fabrics Industry Revenue (Million), by End-User Industry 2025 & 2033
- Figure 52: Japan APAC Non-Woven Fabrics Industry Volume (K Tons), by End-User Industry 2025 & 2033
- Figure 53: Japan APAC Non-Woven Fabrics Industry Revenue Share (%), by End-User Industry 2025 & 2033
- Figure 54: Japan APAC Non-Woven Fabrics Industry Volume Share (%), by End-User Industry 2025 & 2033
- Figure 55: Japan APAC Non-Woven Fabrics Industry Revenue (Million), by Geography 2025 & 2033
- Figure 56: Japan APAC Non-Woven Fabrics Industry Volume (K Tons), by Geography 2025 & 2033
- Figure 57: Japan APAC Non-Woven Fabrics Industry Revenue Share (%), by Geography 2025 & 2033
- Figure 58: Japan APAC Non-Woven Fabrics Industry Volume Share (%), by Geography 2025 & 2033
- Figure 59: Japan APAC Non-Woven Fabrics Industry Revenue (Million), by Country 2025 & 2033
- Figure 60: Japan APAC Non-Woven Fabrics Industry Volume (K Tons), by Country 2025 & 2033
- Figure 61: Japan APAC Non-Woven Fabrics Industry Revenue Share (%), by Country 2025 & 2033
- Figure 62: Japan APAC Non-Woven Fabrics Industry Volume Share (%), by Country 2025 & 2033
- Figure 63: South Korea APAC Non-Woven Fabrics Industry Revenue (Million), by Technology 2025 & 2033
- Figure 64: South Korea APAC Non-Woven Fabrics Industry Volume (K Tons), by Technology 2025 & 2033
- Figure 65: South Korea APAC Non-Woven Fabrics Industry Revenue Share (%), by Technology 2025 & 2033
- Figure 66: South Korea APAC Non-Woven Fabrics Industry Volume Share (%), by Technology 2025 & 2033
- Figure 67: South Korea APAC Non-Woven Fabrics Industry Revenue (Million), by Material 2025 & 2033
- Figure 68: South Korea APAC Non-Woven Fabrics Industry Volume (K Tons), by Material 2025 & 2033
- Figure 69: South Korea APAC Non-Woven Fabrics Industry Revenue Share (%), by Material 2025 & 2033
- Figure 70: South Korea APAC Non-Woven Fabrics Industry Volume Share (%), by Material 2025 & 2033
- Figure 71: South Korea APAC Non-Woven Fabrics Industry Revenue (Million), by End-User Industry 2025 & 2033
- Figure 72: South Korea APAC Non-Woven Fabrics Industry Volume (K Tons), by End-User Industry 2025 & 2033
- Figure 73: South Korea APAC Non-Woven Fabrics Industry Revenue Share (%), by End-User Industry 2025 & 2033
- Figure 74: South Korea APAC Non-Woven Fabrics Industry Volume Share (%), by End-User Industry 2025 & 2033
- Figure 75: South Korea APAC Non-Woven Fabrics Industry Revenue (Million), by Geography 2025 & 2033
- Figure 76: South Korea APAC Non-Woven Fabrics Industry Volume (K Tons), by Geography 2025 & 2033
- Figure 77: South Korea APAC Non-Woven Fabrics Industry Revenue Share (%), by Geography 2025 & 2033
- Figure 78: South Korea APAC Non-Woven Fabrics Industry Volume Share (%), by Geography 2025 & 2033
- Figure 79: South Korea APAC Non-Woven Fabrics Industry Revenue (Million), by Country 2025 & 2033
- Figure 80: South Korea APAC Non-Woven Fabrics Industry Volume (K Tons), by Country 2025 & 2033
- Figure 81: South Korea APAC Non-Woven Fabrics Industry Revenue Share (%), by Country 2025 & 2033
- Figure 82: South Korea APAC Non-Woven Fabrics Industry Volume Share (%), by Country 2025 & 2033
- Figure 83: Indonesia APAC Non-Woven Fabrics Industry Revenue (Million), by Technology 2025 & 2033
- Figure 84: Indonesia APAC Non-Woven Fabrics Industry Volume (K Tons), by Technology 2025 & 2033
- Figure 85: Indonesia APAC Non-Woven Fabrics Industry Revenue Share (%), by Technology 2025 & 2033
- Figure 86: Indonesia APAC Non-Woven Fabrics Industry Volume Share (%), by Technology 2025 & 2033
- Figure 87: Indonesia APAC Non-Woven Fabrics Industry Revenue (Million), by Material 2025 & 2033
- Figure 88: Indonesia APAC Non-Woven Fabrics Industry Volume (K Tons), by Material 2025 & 2033
- Figure 89: Indonesia APAC Non-Woven Fabrics Industry Revenue Share (%), by Material 2025 & 2033
- Figure 90: Indonesia APAC Non-Woven Fabrics Industry Volume Share (%), by Material 2025 & 2033
- Figure 91: Indonesia APAC Non-Woven Fabrics Industry Revenue (Million), by End-User Industry 2025 & 2033
- Figure 92: Indonesia APAC Non-Woven Fabrics Industry Volume (K Tons), by End-User Industry 2025 & 2033
- Figure 93: Indonesia APAC Non-Woven Fabrics Industry Revenue Share (%), by End-User Industry 2025 & 2033
- Figure 94: Indonesia APAC Non-Woven Fabrics Industry Volume Share (%), by End-User Industry 2025 & 2033
- Figure 95: Indonesia APAC Non-Woven Fabrics Industry Revenue (Million), by Geography 2025 & 2033
- Figure 96: Indonesia APAC Non-Woven Fabrics Industry Volume (K Tons), by Geography 2025 & 2033
- Figure 97: Indonesia APAC Non-Woven Fabrics Industry Revenue Share (%), by Geography 2025 & 2033
- Figure 98: Indonesia APAC Non-Woven Fabrics Industry Volume Share (%), by Geography 2025 & 2033
- Figure 99: Indonesia APAC Non-Woven Fabrics Industry Revenue (Million), by Country 2025 & 2033
- Figure 100: Indonesia APAC Non-Woven Fabrics Industry Volume (K Tons), by Country 2025 & 2033
- Figure 101: Indonesia APAC Non-Woven Fabrics Industry Revenue Share (%), by Country 2025 & 2033
- Figure 102: Indonesia APAC Non-Woven Fabrics Industry Volume Share (%), by Country 2025 & 2033
- Figure 103: Malaysia APAC Non-Woven Fabrics Industry Revenue (Million), by Technology 2025 & 2033
- Figure 104: Malaysia APAC Non-Woven Fabrics Industry Volume (K Tons), by Technology 2025 & 2033
- Figure 105: Malaysia APAC Non-Woven Fabrics Industry Revenue Share (%), by Technology 2025 & 2033
- Figure 106: Malaysia APAC Non-Woven Fabrics Industry Volume Share (%), by Technology 2025 & 2033
- Figure 107: Malaysia APAC Non-Woven Fabrics Industry Revenue (Million), by Material 2025 & 2033
- Figure 108: Malaysia APAC Non-Woven Fabrics Industry Volume (K Tons), by Material 2025 & 2033
- Figure 109: Malaysia APAC Non-Woven Fabrics Industry Revenue Share (%), by Material 2025 & 2033
- Figure 110: Malaysia APAC Non-Woven Fabrics Industry Volume Share (%), by Material 2025 & 2033
- Figure 111: Malaysia APAC Non-Woven Fabrics Industry Revenue (Million), by End-User Industry 2025 & 2033
- Figure 112: Malaysia APAC Non-Woven Fabrics Industry Volume (K Tons), by End-User Industry 2025 & 2033
- Figure 113: Malaysia APAC Non-Woven Fabrics Industry Revenue Share (%), by End-User Industry 2025 & 2033
- Figure 114: Malaysia APAC Non-Woven Fabrics Industry Volume Share (%), by End-User Industry 2025 & 2033
- Figure 115: Malaysia APAC Non-Woven Fabrics Industry Revenue (Million), by Geography 2025 & 2033
- Figure 116: Malaysia APAC Non-Woven Fabrics Industry Volume (K Tons), by Geography 2025 & 2033
- Figure 117: Malaysia APAC Non-Woven Fabrics Industry Revenue Share (%), by Geography 2025 & 2033
- Figure 118: Malaysia APAC Non-Woven Fabrics Industry Volume Share (%), by Geography 2025 & 2033
- Figure 119: Malaysia APAC Non-Woven Fabrics Industry Revenue (Million), by Country 2025 & 2033
- Figure 120: Malaysia APAC Non-Woven Fabrics Industry Volume (K Tons), by Country 2025 & 2033
- Figure 121: Malaysia APAC Non-Woven Fabrics Industry Revenue Share (%), by Country 2025 & 2033
- Figure 122: Malaysia APAC Non-Woven Fabrics Industry Volume Share (%), by Country 2025 & 2033
- Figure 123: Thailand APAC Non-Woven Fabrics Industry Revenue (Million), by Technology 2025 & 2033
- Figure 124: Thailand APAC Non-Woven Fabrics Industry Volume (K Tons), by Technology 2025 & 2033
- Figure 125: Thailand APAC Non-Woven Fabrics Industry Revenue Share (%), by Technology 2025 & 2033
- Figure 126: Thailand APAC Non-Woven Fabrics Industry Volume Share (%), by Technology 2025 & 2033
- Figure 127: Thailand APAC Non-Woven Fabrics Industry Revenue (Million), by Material 2025 & 2033
- Figure 128: Thailand APAC Non-Woven Fabrics Industry Volume (K Tons), by Material 2025 & 2033
- Figure 129: Thailand APAC Non-Woven Fabrics Industry Revenue Share (%), by Material 2025 & 2033
- Figure 130: Thailand APAC Non-Woven Fabrics Industry Volume Share (%), by Material 2025 & 2033
- Figure 131: Thailand APAC Non-Woven Fabrics Industry Revenue (Million), by End-User Industry 2025 & 2033
- Figure 132: Thailand APAC Non-Woven Fabrics Industry Volume (K Tons), by End-User Industry 2025 & 2033
- Figure 133: Thailand APAC Non-Woven Fabrics Industry Revenue Share (%), by End-User Industry 2025 & 2033
- Figure 134: Thailand APAC Non-Woven Fabrics Industry Volume Share (%), by End-User Industry 2025 & 2033
- Figure 135: Thailand APAC Non-Woven Fabrics Industry Revenue (Million), by Geography 2025 & 2033
- Figure 136: Thailand APAC Non-Woven Fabrics Industry Volume (K Tons), by Geography 2025 & 2033
- Figure 137: Thailand APAC Non-Woven Fabrics Industry Revenue Share (%), by Geography 2025 & 2033
- Figure 138: Thailand APAC Non-Woven Fabrics Industry Volume Share (%), by Geography 2025 & 2033
- Figure 139: Thailand APAC Non-Woven Fabrics Industry Revenue (Million), by Country 2025 & 2033
- Figure 140: Thailand APAC Non-Woven Fabrics Industry Volume (K Tons), by Country 2025 & 2033
- Figure 141: Thailand APAC Non-Woven Fabrics Industry Revenue Share (%), by Country 2025 & 2033
- Figure 142: Thailand APAC Non-Woven Fabrics Industry Volume Share (%), by Country 2025 & 2033
- Figure 143: Vietnam APAC Non-Woven Fabrics Industry Revenue (Million), by Technology 2025 & 2033
- Figure 144: Vietnam APAC Non-Woven Fabrics Industry Volume (K Tons), by Technology 2025 & 2033
- Figure 145: Vietnam APAC Non-Woven Fabrics Industry Revenue Share (%), by Technology 2025 & 2033
- Figure 146: Vietnam APAC Non-Woven Fabrics Industry Volume Share (%), by Technology 2025 & 2033
- Figure 147: Vietnam APAC Non-Woven Fabrics Industry Revenue (Million), by Material 2025 & 2033
- Figure 148: Vietnam APAC Non-Woven Fabrics Industry Volume (K Tons), by Material 2025 & 2033
- Figure 149: Vietnam APAC Non-Woven Fabrics Industry Revenue Share (%), by Material 2025 & 2033
- Figure 150: Vietnam APAC Non-Woven Fabrics Industry Volume Share (%), by Material 2025 & 2033
- Figure 151: Vietnam APAC Non-Woven Fabrics Industry Revenue (Million), by End-User Industry 2025 & 2033
- Figure 152: Vietnam APAC Non-Woven Fabrics Industry Volume (K Tons), by End-User Industry 2025 & 2033
- Figure 153: Vietnam APAC Non-Woven Fabrics Industry Revenue Share (%), by End-User Industry 2025 & 2033
- Figure 154: Vietnam APAC Non-Woven Fabrics Industry Volume Share (%), by End-User Industry 2025 & 2033
- Figure 155: Vietnam APAC Non-Woven Fabrics Industry Revenue (Million), by Geography 2025 & 2033
- Figure 156: Vietnam APAC Non-Woven Fabrics Industry Volume (K Tons), by Geography 2025 & 2033
- Figure 157: Vietnam APAC Non-Woven Fabrics Industry Revenue Share (%), by Geography 2025 & 2033
- Figure 158: Vietnam APAC Non-Woven Fabrics Industry Volume Share (%), by Geography 2025 & 2033
- Figure 159: Vietnam APAC Non-Woven Fabrics Industry Revenue (Million), by Country 2025 & 2033
- Figure 160: Vietnam APAC Non-Woven Fabrics Industry Volume (K Tons), by Country 2025 & 2033
- Figure 161: Vietnam APAC Non-Woven Fabrics Industry Revenue Share (%), by Country 2025 & 2033
- Figure 162: Vietnam APAC Non-Woven Fabrics Industry Volume Share (%), by Country 2025 & 2033
- Figure 163: Rest of Asia Pacific APAC Non-Woven Fabrics Industry Revenue (Million), by Technology 2025 & 2033
- Figure 164: Rest of Asia Pacific APAC Non-Woven Fabrics Industry Volume (K Tons), by Technology 2025 & 2033
- Figure 165: Rest of Asia Pacific APAC Non-Woven Fabrics Industry Revenue Share (%), by Technology 2025 & 2033
- Figure 166: Rest of Asia Pacific APAC Non-Woven Fabrics Industry Volume Share (%), by Technology 2025 & 2033
- Figure 167: Rest of Asia Pacific APAC Non-Woven Fabrics Industry Revenue (Million), by Material 2025 & 2033
- Figure 168: Rest of Asia Pacific APAC Non-Woven Fabrics Industry Volume (K Tons), by Material 2025 & 2033
- Figure 169: Rest of Asia Pacific APAC Non-Woven Fabrics Industry Revenue Share (%), by Material 2025 & 2033
- Figure 170: Rest of Asia Pacific APAC Non-Woven Fabrics Industry Volume Share (%), by Material 2025 & 2033
- Figure 171: Rest of Asia Pacific APAC Non-Woven Fabrics Industry Revenue (Million), by End-User Industry 2025 & 2033
- Figure 172: Rest of Asia Pacific APAC Non-Woven Fabrics Industry Volume (K Tons), by End-User Industry 2025 & 2033
- Figure 173: Rest of Asia Pacific APAC Non-Woven Fabrics Industry Revenue Share (%), by End-User Industry 2025 & 2033
- Figure 174: Rest of Asia Pacific APAC Non-Woven Fabrics Industry Volume Share (%), by End-User Industry 2025 & 2033
- Figure 175: Rest of Asia Pacific APAC Non-Woven Fabrics Industry Revenue (Million), by Geography 2025 & 2033
- Figure 176: Rest of Asia Pacific APAC Non-Woven Fabrics Industry Volume (K Tons), by Geography 2025 & 2033
- Figure 177: Rest of Asia Pacific APAC Non-Woven Fabrics Industry Revenue Share (%), by Geography 2025 & 2033
- Figure 178: Rest of Asia Pacific APAC Non-Woven Fabrics Industry Volume Share (%), by Geography 2025 & 2033
- Figure 179: Rest of Asia Pacific APAC Non-Woven Fabrics Industry Revenue (Million), by Country 2025 & 2033
- Figure 180: Rest of Asia Pacific APAC Non-Woven Fabrics Industry Volume (K Tons), by Country 2025 & 2033
- Figure 181: Rest of Asia Pacific APAC Non-Woven Fabrics Industry Revenue Share (%), by Country 2025 & 2033
- Figure 182: Rest of Asia Pacific APAC Non-Woven Fabrics Industry Volume Share (%), by Country 2025 & 2033
List of Tables
- Table 1: Global APAC Non-Woven Fabrics Industry Revenue Million Forecast, by Technology 2020 & 2033
- Table 2: Global APAC Non-Woven Fabrics Industry Volume K Tons Forecast, by Technology 2020 & 2033
- Table 3: Global APAC Non-Woven Fabrics Industry Revenue Million Forecast, by Material 2020 & 2033
- Table 4: Global APAC Non-Woven Fabrics Industry Volume K Tons Forecast, by Material 2020 & 2033
- Table 5: Global APAC Non-Woven Fabrics Industry Revenue Million Forecast, by End-User Industry 2020 & 2033
- Table 6: Global APAC Non-Woven Fabrics Industry Volume K Tons Forecast, by End-User Industry 2020 & 2033
- Table 7: Global APAC Non-Woven Fabrics Industry Revenue Million Forecast, by Geography 2020 & 2033
- Table 8: Global APAC Non-Woven Fabrics Industry Volume K Tons Forecast, by Geography 2020 & 2033
- Table 9: Global APAC Non-Woven Fabrics Industry Revenue Million Forecast, by Region 2020 & 2033
- Table 10: Global APAC Non-Woven Fabrics Industry Volume K Tons Forecast, by Region 2020 & 2033
- Table 11: Global APAC Non-Woven Fabrics Industry Revenue Million Forecast, by Technology 2020 & 2033
- Table 12: Global APAC Non-Woven Fabrics Industry Volume K Tons Forecast, by Technology 2020 & 2033
- Table 13: Global APAC Non-Woven Fabrics Industry Revenue Million Forecast, by Material 2020 & 2033
- Table 14: Global APAC Non-Woven Fabrics Industry Volume K Tons Forecast, by Material 2020 & 2033
- Table 15: Global APAC Non-Woven Fabrics Industry Revenue Million Forecast, by End-User Industry 2020 & 2033
- Table 16: Global APAC Non-Woven Fabrics Industry Volume K Tons Forecast, by End-User Industry 2020 & 2033
- Table 17: Global APAC Non-Woven Fabrics Industry Revenue Million Forecast, by Geography 2020 & 2033
- Table 18: Global APAC Non-Woven Fabrics Industry Volume K Tons Forecast, by Geography 2020 & 2033
- Table 19: Global APAC Non-Woven Fabrics Industry Revenue Million Forecast, by Country 2020 & 2033
- Table 20: Global APAC Non-Woven Fabrics Industry Volume K Tons Forecast, by Country 2020 & 2033
- Table 21: Global APAC Non-Woven Fabrics Industry Revenue Million Forecast, by Technology 2020 & 2033
- Table 22: Global APAC Non-Woven Fabrics Industry Volume K Tons Forecast, by Technology 2020 & 2033
- Table 23: Global APAC Non-Woven Fabrics Industry Revenue Million Forecast, by Material 2020 & 2033
- Table 24: Global APAC Non-Woven Fabrics Industry Volume K Tons Forecast, by Material 2020 & 2033
- Table 25: Global APAC Non-Woven Fabrics Industry Revenue Million Forecast, by End-User Industry 2020 & 2033
- Table 26: Global APAC Non-Woven Fabrics Industry Volume K Tons Forecast, by End-User Industry 2020 & 2033
- Table 27: Global APAC Non-Woven Fabrics Industry Revenue Million Forecast, by Geography 2020 & 2033
- Table 28: Global APAC Non-Woven Fabrics Industry Volume K Tons Forecast, by Geography 2020 & 2033
- Table 29: Global APAC Non-Woven Fabrics Industry Revenue Million Forecast, by Country 2020 & 2033
- Table 30: Global APAC Non-Woven Fabrics Industry Volume K Tons Forecast, by Country 2020 & 2033
- Table 31: Global APAC Non-Woven Fabrics Industry Revenue Million Forecast, by Technology 2020 & 2033
- Table 32: Global APAC Non-Woven Fabrics Industry Volume K Tons Forecast, by Technology 2020 & 2033
- Table 33: Global APAC Non-Woven Fabrics Industry Revenue Million Forecast, by Material 2020 & 2033
- Table 34: Global APAC Non-Woven Fabrics Industry Volume K Tons Forecast, by Material 2020 & 2033
- Table 35: Global APAC Non-Woven Fabrics Industry Revenue Million Forecast, by End-User Industry 2020 & 2033
- Table 36: Global APAC Non-Woven Fabrics Industry Volume K Tons Forecast, by End-User Industry 2020 & 2033
- Table 37: Global APAC Non-Woven Fabrics Industry Revenue Million Forecast, by Geography 2020 & 2033
- Table 38: Global APAC Non-Woven Fabrics Industry Volume K Tons Forecast, by Geography 2020 & 2033
- Table 39: Global APAC Non-Woven Fabrics Industry Revenue Million Forecast, by Country 2020 & 2033
- Table 40: Global APAC Non-Woven Fabrics Industry Volume K Tons Forecast, by Country 2020 & 2033
- Table 41: Global APAC Non-Woven Fabrics Industry Revenue Million Forecast, by Technology 2020 & 2033
- Table 42: Global APAC Non-Woven Fabrics Industry Volume K Tons Forecast, by Technology 2020 & 2033
- Table 43: Global APAC Non-Woven Fabrics Industry Revenue Million Forecast, by Material 2020 & 2033
- Table 44: Global APAC Non-Woven Fabrics Industry Volume K Tons Forecast, by Material 2020 & 2033
- Table 45: Global APAC Non-Woven Fabrics Industry Revenue Million Forecast, by End-User Industry 2020 & 2033
- Table 46: Global APAC Non-Woven Fabrics Industry Volume K Tons Forecast, by End-User Industry 2020 & 2033
- Table 47: Global APAC Non-Woven Fabrics Industry Revenue Million Forecast, by Geography 2020 & 2033
- Table 48: Global APAC Non-Woven Fabrics Industry Volume K Tons Forecast, by Geography 2020 & 2033
- Table 49: Global APAC Non-Woven Fabrics Industry Revenue Million Forecast, by Country 2020 & 2033
- Table 50: Global APAC Non-Woven Fabrics Industry Volume K Tons Forecast, by Country 2020 & 2033
- Table 51: Global APAC Non-Woven Fabrics Industry Revenue Million Forecast, by Technology 2020 & 2033
- Table 52: Global APAC Non-Woven Fabrics Industry Volume K Tons Forecast, by Technology 2020 & 2033
- Table 53: Global APAC Non-Woven Fabrics Industry Revenue Million Forecast, by Material 2020 & 2033
- Table 54: Global APAC Non-Woven Fabrics Industry Volume K Tons Forecast, by Material 2020 & 2033
- Table 55: Global APAC Non-Woven Fabrics Industry Revenue Million Forecast, by End-User Industry 2020 & 2033
- Table 56: Global APAC Non-Woven Fabrics Industry Volume K Tons Forecast, by End-User Industry 2020 & 2033
- Table 57: Global APAC Non-Woven Fabrics Industry Revenue Million Forecast, by Geography 2020 & 2033
- Table 58: Global APAC Non-Woven Fabrics Industry Volume K Tons Forecast, by Geography 2020 & 2033
- Table 59: Global APAC Non-Woven Fabrics Industry Revenue Million Forecast, by Country 2020 & 2033
- Table 60: Global APAC Non-Woven Fabrics Industry Volume K Tons Forecast, by Country 2020 & 2033
- Table 61: Global APAC Non-Woven Fabrics Industry Revenue Million Forecast, by Technology 2020 & 2033
- Table 62: Global APAC Non-Woven Fabrics Industry Volume K Tons Forecast, by Technology 2020 & 2033
- Table 63: Global APAC Non-Woven Fabrics Industry Revenue Million Forecast, by Material 2020 & 2033
- Table 64: Global APAC Non-Woven Fabrics Industry Volume K Tons Forecast, by Material 2020 & 2033
- Table 65: Global APAC Non-Woven Fabrics Industry Revenue Million Forecast, by End-User Industry 2020 & 2033
- Table 66: Global APAC Non-Woven Fabrics Industry Volume K Tons Forecast, by End-User Industry 2020 & 2033
- Table 67: Global APAC Non-Woven Fabrics Industry Revenue Million Forecast, by Geography 2020 & 2033
- Table 68: Global APAC Non-Woven Fabrics Industry Volume K Tons Forecast, by Geography 2020 & 2033
- Table 69: Global APAC Non-Woven Fabrics Industry Revenue Million Forecast, by Country 2020 & 2033
- Table 70: Global APAC Non-Woven Fabrics Industry Volume K Tons Forecast, by Country 2020 & 2033
- Table 71: Global APAC Non-Woven Fabrics Industry Revenue Million Forecast, by Technology 2020 & 2033
- Table 72: Global APAC Non-Woven Fabrics Industry Volume K Tons Forecast, by Technology 2020 & 2033
- Table 73: Global APAC Non-Woven Fabrics Industry Revenue Million Forecast, by Material 2020 & 2033
- Table 74: Global APAC Non-Woven Fabrics Industry Volume K Tons Forecast, by Material 2020 & 2033
- Table 75: Global APAC Non-Woven Fabrics Industry Revenue Million Forecast, by End-User Industry 2020 & 2033
- Table 76: Global APAC Non-Woven Fabrics Industry Volume K Tons Forecast, by End-User Industry 2020 & 2033
- Table 77: Global APAC Non-Woven Fabrics Industry Revenue Million Forecast, by Geography 2020 & 2033
- Table 78: Global APAC Non-Woven Fabrics Industry Volume K Tons Forecast, by Geography 2020 & 2033
- Table 79: Global APAC Non-Woven Fabrics Industry Revenue Million Forecast, by Country 2020 & 2033
- Table 80: Global APAC Non-Woven Fabrics Industry Volume K Tons Forecast, by Country 2020 & 2033
- Table 81: Global APAC Non-Woven Fabrics Industry Revenue Million Forecast, by Technology 2020 & 2033
- Table 82: Global APAC Non-Woven Fabrics Industry Volume K Tons Forecast, by Technology 2020 & 2033
- Table 83: Global APAC Non-Woven Fabrics Industry Revenue Million Forecast, by Material 2020 & 2033
- Table 84: Global APAC Non-Woven Fabrics Industry Volume K Tons Forecast, by Material 2020 & 2033
- Table 85: Global APAC Non-Woven Fabrics Industry Revenue Million Forecast, by End-User Industry 2020 & 2033
- Table 86: Global APAC Non-Woven Fabrics Industry Volume K Tons Forecast, by End-User Industry 2020 & 2033
- Table 87: Global APAC Non-Woven Fabrics Industry Revenue Million Forecast, by Geography 2020 & 2033
- Table 88: Global APAC Non-Woven Fabrics Industry Volume K Tons Forecast, by Geography 2020 & 2033
- Table 89: Global APAC Non-Woven Fabrics Industry Revenue Million Forecast, by Country 2020 & 2033
- Table 90: Global APAC Non-Woven Fabrics Industry Volume K Tons Forecast, by Country 2020 & 2033
- Table 91: Global APAC Non-Woven Fabrics Industry Revenue Million Forecast, by Technology 2020 & 2033
- Table 92: Global APAC Non-Woven Fabrics Industry Volume K Tons Forecast, by Technology 2020 & 2033
- Table 93: Global APAC Non-Woven Fabrics Industry Revenue Million Forecast, by Material 2020 & 2033
- Table 94: Global APAC Non-Woven Fabrics Industry Volume K Tons Forecast, by Material 2020 & 2033
- Table 95: Global APAC Non-Woven Fabrics Industry Revenue Million Forecast, by End-User Industry 2020 & 2033
- Table 96: Global APAC Non-Woven Fabrics Industry Volume K Tons Forecast, by End-User Industry 2020 & 2033
- Table 97: Global APAC Non-Woven Fabrics Industry Revenue Million Forecast, by Geography 2020 & 2033
- Table 98: Global APAC Non-Woven Fabrics Industry Volume K Tons Forecast, by Geography 2020 & 2033
- Table 99: Global APAC Non-Woven Fabrics Industry Revenue Million Forecast, by Country 2020 & 2033
- Table 100: Global APAC Non-Woven Fabrics Industry Volume K Tons Forecast, by Country 2020 & 2033
Frequently Asked Questions
1. What is the projected Compound Annual Growth Rate (CAGR) of the APAC Non-Woven Fabrics Industry?
The projected CAGR is approximately > 8.00%.
2. Which companies are prominent players in the APAC Non-Woven Fabrics Industry?
Key companies in the market include Ahlstrom, Glatfelter Corporation, Global Non Wovens Limited, Ginni Filaments, Freudenberg Performance Materials, Cygnus Group, Eximius Innovative Pvt Ltd, Fitesa S A, DuPont, Autotech Nonwovens Pvt Ltd, TORAY INDUSTRIES INC *List Not Exhaustive, Johns Manville, Berry Global Inc, Reliance Non-woven Industry LLC.
3. What are the main segments of the APAC Non-Woven Fabrics Industry?
The market segments include Technology, Material, End-User Industry, Geography.
4. Can you provide details about the market size?
The market size is estimated to be USD 36.76 Million as of 2022.
5. What are some drivers contributing to market growth?
Increasing Application Base in the Healthcare Industry; Growth in The Automotive Industry; Increasing Demand for Non-Woven Fabrics in The Textile Industry.
6. What are the notable trends driving market growth?
Healthcare End-User Industry to Dominate The Market.
7. Are there any restraints impacting market growth?
Lack of Awareness Among Consumers; Volatility in Raw Material Prices.
8. Can you provide examples of recent developments in the market?
November 2022: Fitesa announced the expansion of its production capacity for nonwoven fabrics for medical applications. The company is expected to invest in new machinery to meet the growing demand for these products.
9. What pricing options are available for accessing the report?
Pricing options include single-user, multi-user, and enterprise licenses priced at USD 4750, USD 5250, and USD 8750 respectively.
10. Is the market size provided in terms of value or volume?
The market size is provided in terms of value, measured in Million and volume, measured in K Tons.
11. Are there any specific market keywords associated with the report?
Yes, the market keyword associated with the report is "APAC Non-Woven Fabrics Industry," which aids in identifying and referencing the specific market segment covered.
12. How do I determine which pricing option suits my needs best?
The pricing options vary based on user requirements and access needs. Individual users may opt for single-user licenses, while businesses requiring broader access may choose multi-user or enterprise licenses for cost-effective access to the report.
13. Are there any additional resources or data provided in the APAC Non-Woven Fabrics Industry report?
While the report offers comprehensive insights, it's advisable to review the specific contents or supplementary materials provided to ascertain if additional resources or data are available.
14. How can I stay updated on further developments or reports in the APAC Non-Woven Fabrics Industry?
To stay informed about further developments, trends, and reports in the APAC Non-Woven Fabrics Industry, consider subscribing to industry newsletters, following relevant companies and organizations, or regularly checking reputable industry news sources and publications.
Methodology
Step 1 - Identification of Relevant Samples Size from Population Database


Step 2 - Approaches for Defining Global Market Size (Value, Volume* & Price*)

Note*: In applicable scenarios
Step 3 - Data Sources
Primary Research
- Web Analytics
- Survey Reports
- Research Institute
- Latest Research Reports
- Opinion Leaders
Secondary Research
- Annual Reports
- White Paper
- Latest Press Release
- Industry Association
- Paid Database
- Investor Presentations

Step 4 - Data Triangulation
Involves using different sources of information in order to increase the validity of a study
These sources are likely to be stakeholders in a program - participants, other researchers, program staff, other community members, and so on.
Then we put all data in single framework & apply various statistical tools to find out the dynamic on the market.
During the analysis stage, feedback from the stakeholder groups would be compared to determine areas of agreement as well as areas of divergence