

Key Insights
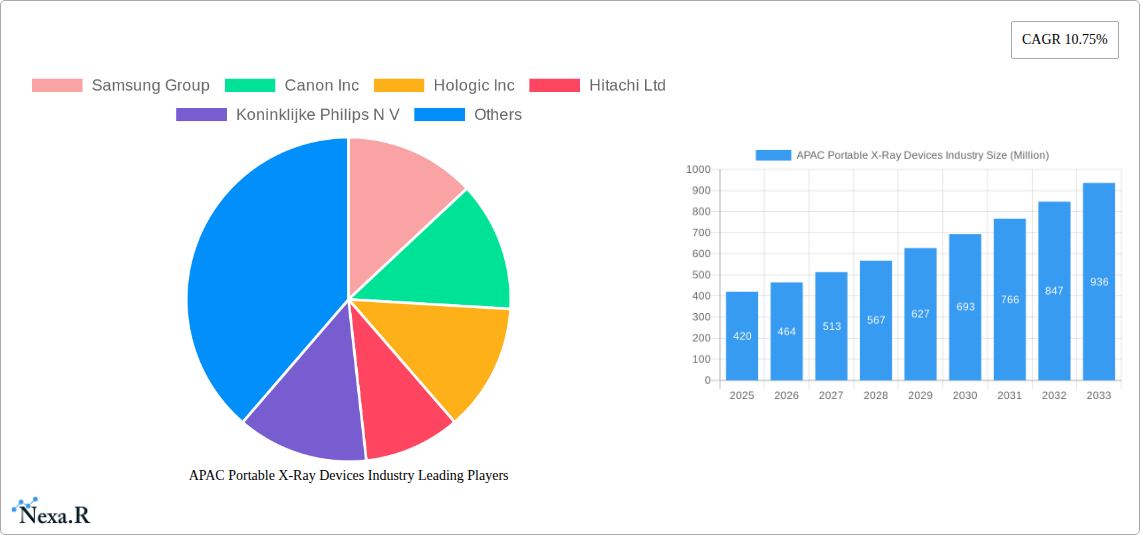
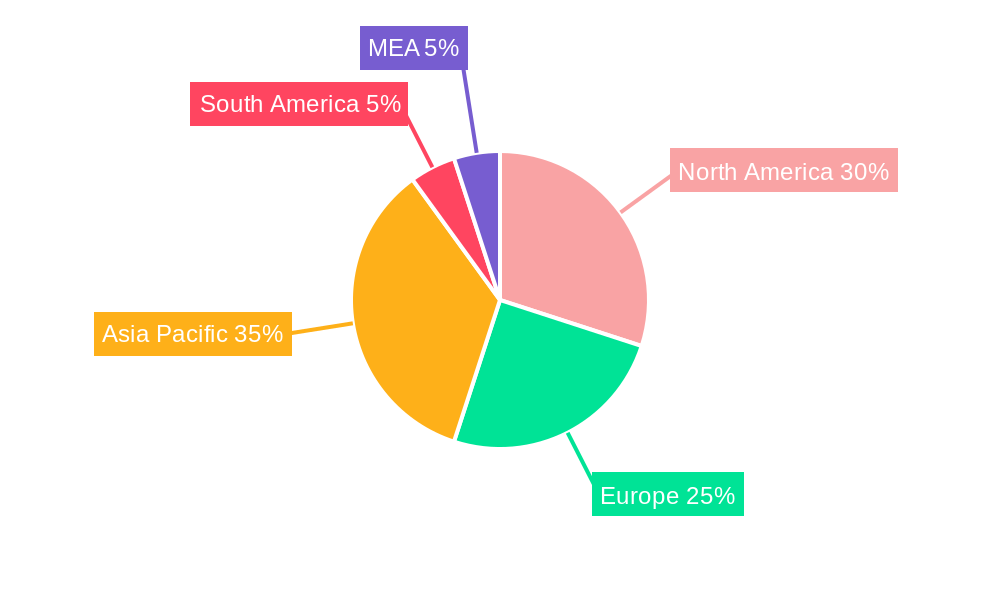
The Asia-Pacific (APAC) portable X-ray devices market is experiencing robust growth, driven by increasing demand for point-of-care diagnostics, rising prevalence of chronic diseases requiring frequent imaging, and advancements in portable X-ray technology. The market's expansion is particularly fueled by the region's diverse healthcare landscape, ranging from sophisticated urban hospitals to remote rural clinics, where portable devices offer crucial accessibility. Factors like improving healthcare infrastructure in developing nations within APAC, coupled with a growing preference for minimally invasive procedures, are further boosting market growth. While the overall global market size is estimated at $1.54 billion in 2025, a reasonable estimation for the APAC regional market share, considering its large and rapidly developing population, could be approximately 25-30% of the global market. This translates to a market size of between $385 million and $462 million in 2025. With a Compound Annual Growth Rate (CAGR) of 10.75%, significant growth is projected throughout the forecast period (2025-2033), particularly in countries like India, China, and Japan, where healthcare expenditure is rising and technological adoption is accelerating.
The market segmentation within APAC shows a strong preference for digital X-ray technology over analog, reflecting a global trend toward higher image quality and efficiency. Applications like dental X-rays and chest X-rays are expected to maintain high demand, driven by routine screenings and the increasing prevalence of respiratory illnesses. The popularity of handheld and mobile X-ray devices is further propelled by their ease of use and portability, allowing for efficient diagnosis in various settings, including ambulances, clinics, and even homes. However, challenges remain, such as uneven distribution of healthcare resources across the region and the relatively high cost of advanced digital X-ray systems, especially in less developed nations. Nevertheless, ongoing technological advancements, coupled with supportive government initiatives promoting healthcare infrastructure development, are poised to mitigate these restraints and propel the APAC portable X-ray devices market towards sustained and significant growth in the coming years.
APAC Portable X-Ray Devices Industry: A Comprehensive Market Report (2019-2033)
This comprehensive report offers an in-depth analysis of the Asia-Pacific (APAC) portable X-ray devices market, encompassing market dynamics, growth trends, regional dominance, product landscape, and future outlook. Targeting industry professionals, investors, and researchers, this report provides actionable insights for strategic decision-making within this rapidly evolving sector. The study period covers 2019-2033, with 2025 as the base and estimated year. The report projects a market value of xx Million units by 2033.
APAC Portable X-Ray Devices Industry Market Dynamics & Structure
This section analyzes the competitive landscape of the APAC portable X-ray devices market, considering market concentration, technological innovation, regulatory influences, and industry trends. The market is moderately concentrated, with key players such as Samsung Group, Canon Inc, Hologic Inc, Hitachi Ltd, Koninklijke Philips N.V., Siemens AG, GE Healthcare, Carestream Health Inc, Shimadzu Corporation, and Fujifilm Holdings Corporation vying for market share.
- Market Concentration: xx% market share held by top 5 players in 2024.
- Technological Innovation: Continuous advancements in digital X-ray technology, miniaturization, and wireless capabilities are driving market growth. Innovation barriers include high R&D costs and regulatory approvals.
- Regulatory Frameworks: Stringent regulatory approvals and safety standards influence market dynamics. Variations in regulatory requirements across different APAC countries impact market penetration.
- Competitive Product Substitutes: Advancements in ultrasound and MRI technologies present some level of substitution, though X-ray remains crucial for certain applications.
- End-User Demographics: Growth is driven by rising prevalence of chronic diseases, increasing geriatric population, and expanding healthcare infrastructure across APAC.
- M&A Trends: The past five years have seen xx M&A deals in the APAC medical imaging sector, indicating consolidation and expansion strategies among key players.
APAC Portable X-Ray Devices Industry Growth Trends & Insights
The APAC portable X-ray devices market witnessed substantial growth during the historical period (2019-2024), driven by increasing demand for efficient and portable diagnostic solutions. The market is projected to maintain a healthy Compound Annual Growth Rate (CAGR) of xx% during the forecast period (2025-2033), reaching xx Million units by 2033. This growth is fueled by factors such as rising healthcare expenditure, technological advancements, and increasing adoption of digital X-ray systems. Market penetration of digital X-ray systems is expected to increase from xx% in 2024 to xx% by 2033. Consumer behavior shifts towards greater preference for portable and wireless devices are further accelerating market expansion. The report leverages extensive market research data to provide a deep dive into specific regional trends and adoption rates.

Dominant Regions, Countries, or Segments in APAC Portable X-Ray Devices Industry
Within the APAC region, India and China are the leading markets for portable X-ray devices, fueled by substantial investments in healthcare infrastructure and growing demand for improved healthcare access. The digital X-ray segment is experiencing the fastest growth, driven by superior image quality and improved diagnostic capabilities. Within applications, mammography and chest X-ray dominate the market. Mobile X-ray devices are gaining prominence due to their flexibility and portability.
- Key Drivers in India & China:
- Increasing government initiatives to improve healthcare infrastructure.
- Rising prevalence of chronic diseases.
- Growing investments in private healthcare facilities.
- Favorable economic conditions.
- Segment Dominance: Digital X-ray technology (xx% market share in 2024) is outpacing analog X-ray, driven by improved image quality and diagnostic capabilities. Chest X-ray and mammography applications hold significant market share due to widespread usage. Mobile X-ray devices hold a larger share than handheld devices due to their versatility and ease of use in diverse settings.
APAC Portable X-Ray Devices Industry Product Landscape
The APAC portable X-ray device market showcases a range of products offering diverse features, including advanced digital imaging capabilities, wireless connectivity, and user-friendly interfaces. Recent innovations focus on improved image quality, reduced radiation exposure, and enhanced portability. Unique selling propositions include features like AI-powered image analysis, remote diagnostics, and compact designs optimized for various settings, from hospitals to ambulances.
Key Drivers, Barriers & Challenges in APAC Portable X-Ray Devices Industry
Key Drivers: Rising prevalence of chronic diseases, increasing demand for point-of-care diagnostics, advancements in digital imaging technology, and government initiatives to improve healthcare infrastructure are driving market growth.
Challenges: High initial investment costs for advanced systems, stringent regulatory approvals, competition from established players, and potential supply chain disruptions pose significant challenges. The impact of these challenges on market growth is estimated at xx% reduction in market expansion during the forecast period.
Emerging Opportunities in APAP Portable X-Ray Devices Industry
Untapped potential exists in rural and remote areas with limited access to healthcare facilities. Innovative applications, such as tele-radiology and integration with electronic health records (EHRs), are emerging opportunities. Evolving consumer preferences towards convenient and user-friendly devices will further shape future market dynamics.
Growth Accelerators in the APAC Portable X-Ray Devices Industry
Technological breakthroughs, particularly in AI-powered image analysis and miniaturization, are key growth catalysts. Strategic partnerships between device manufacturers and healthcare providers are fostering market expansion. Government initiatives promoting healthcare infrastructure development and access are vital for sustained market growth.
Key Players Shaping the APAC Portable X-Ray Devices Market
- Samsung Group
- Canon Inc
- Hologic Inc
- Hitachi Ltd
- Koninklijke Philips N.V.
- Siemens AG
- GE Healthcare
- Carestream Health Inc
- Shimadzu Corporation
- Fujifilm Holdings Corporation
Notable Milestones in APAC Portable X-Ray Devices Industry Sector
- February 2023: Carestream Health India launched its high-powered Carestream Motion Mobile X-ray system, expanding access to advanced radiography.
- July 2022: FUJIFILM Corporation opened two new NURA health screening centers in India, equipped with advanced mammography systems, signifying investment in early cancer detection.
In-Depth APAC Portable X-Ray Devices Industry Market Outlook
The APAC portable X-ray devices market holds substantial future potential, driven by continuous technological innovation, increasing healthcare expenditure, and expanding access to healthcare in underserved regions. Strategic opportunities exist for companies focusing on developing affordable, user-friendly, and technologically advanced devices. The market's future growth trajectory hinges on addressing existing challenges related to regulatory approvals, cost-effectiveness, and ensuring equitable access to advanced diagnostic technologies across the diverse APAC landscape.
APAC Portable X-Ray Devices Industry Segmentation
-
1. Technology
- 1.1. Analog X-ray
- 1.2. Digital X-ray
-
2. Application
- 2.1. Dental X-ray
- 2.2. Mammography
- 2.3. Chest X-ray
- 2.4. Abdomen X-ray
-
3. Modality
- 3.1. Handheld X-ray Devices
- 3.2. Mobile X-ray Devices
-
4. Geography
- 4.1. China
- 4.2. Japan
- 4.3. India
- 4.4. Australia
- 4.5. South Korea
- 4.6. Rest of Asia-Pacific
APAC Portable X-Ray Devices Industry Segmentation By Geography
- 1. China
- 2. Japan
- 3. India
- 4. Australia
- 5. South Korea
- 6. Rest of Asia Pacific
APAC Portable X-Ray Devices Industry REPORT HIGHLIGHTS
| Aspects | Details |
|---|---|
| Study Period | 2019-2033 |
| Base Year | 2024 |
| Estimated Year | 2025 |
| Forecast Period | 2025-2033 |
| Historical Period | 2019-2024 |
| Growth Rate | CAGR of 10.75% from 2019-2033 |
| Segmentation |
|
Table of Contents
- 1. Introduction
- 1.1. Research Scope
- 1.2. Market Segmentation
- 1.3. Research Methodology
- 1.4. Definitions and Assumptions
- 2. Executive Summary
- 2.1. Introduction
- 3. Market Dynamics
- 3.1. Introduction
- 3.2. Market Drivers
- 3.2.1. Rising Burden of Diseases Requiring Diagnosis; Rising Technological Advancement of X-Ray Devices
- 3.3. Market Restrains
- 3.3.1. High Costs of Devices
- 3.4. Market Trends
- 3.4.1. Mammography Segment is Expected to Grow With a Significant CAGR Over the Forecast Period of the Study
- 4. Market Factor Analysis
- 4.1. Porters Five Forces
- 4.2. Supply/Value Chain
- 4.3. PESTEL analysis
- 4.4. Market Entropy
- 4.5. Patent/Trademark Analysis
- 5. Global APAC Portable X-Ray Devices Industry Analysis, Insights and Forecast, 2019-2031
- 5.1. Market Analysis, Insights and Forecast - by Technology
- 5.1.1. Analog X-ray
- 5.1.2. Digital X-ray
- 5.2. Market Analysis, Insights and Forecast - by Application
- 5.2.1. Dental X-ray
- 5.2.2. Mammography
- 5.2.3. Chest X-ray
- 5.2.4. Abdomen X-ray
- 5.3. Market Analysis, Insights and Forecast - by Modality
- 5.3.1. Handheld X-ray Devices
- 5.3.2. Mobile X-ray Devices
- 5.4. Market Analysis, Insights and Forecast - by Geography
- 5.4.1. China
- 5.4.2. Japan
- 5.4.3. India
- 5.4.4. Australia
- 5.4.5. South Korea
- 5.4.6. Rest of Asia-Pacific
- 5.5. Market Analysis, Insights and Forecast - by Region
- 5.5.1. China
- 5.5.2. Japan
- 5.5.3. India
- 5.5.4. Australia
- 5.5.5. South Korea
- 5.5.6. Rest of Asia Pacific
- 5.1. Market Analysis, Insights and Forecast - by Technology
- 6. China APAC Portable X-Ray Devices Industry Analysis, Insights and Forecast, 2019-2031
- 6.1. Market Analysis, Insights and Forecast - by Technology
- 6.1.1. Analog X-ray
- 6.1.2. Digital X-ray
- 6.2. Market Analysis, Insights and Forecast - by Application
- 6.2.1. Dental X-ray
- 6.2.2. Mammography
- 6.2.3. Chest X-ray
- 6.2.4. Abdomen X-ray
- 6.3. Market Analysis, Insights and Forecast - by Modality
- 6.3.1. Handheld X-ray Devices
- 6.3.2. Mobile X-ray Devices
- 6.4. Market Analysis, Insights and Forecast - by Geography
- 6.4.1. China
- 6.4.2. Japan
- 6.4.3. India
- 6.4.4. Australia
- 6.4.5. South Korea
- 6.4.6. Rest of Asia-Pacific
- 6.1. Market Analysis, Insights and Forecast - by Technology
- 7. Japan APAC Portable X-Ray Devices Industry Analysis, Insights and Forecast, 2019-2031
- 7.1. Market Analysis, Insights and Forecast - by Technology
- 7.1.1. Analog X-ray
- 7.1.2. Digital X-ray
- 7.2. Market Analysis, Insights and Forecast - by Application
- 7.2.1. Dental X-ray
- 7.2.2. Mammography
- 7.2.3. Chest X-ray
- 7.2.4. Abdomen X-ray
- 7.3. Market Analysis, Insights and Forecast - by Modality
- 7.3.1. Handheld X-ray Devices
- 7.3.2. Mobile X-ray Devices
- 7.4. Market Analysis, Insights and Forecast - by Geography
- 7.4.1. China
- 7.4.2. Japan
- 7.4.3. India
- 7.4.4. Australia
- 7.4.5. South Korea
- 7.4.6. Rest of Asia-Pacific
- 7.1. Market Analysis, Insights and Forecast - by Technology
- 8. India APAC Portable X-Ray Devices Industry Analysis, Insights and Forecast, 2019-2031
- 8.1. Market Analysis, Insights and Forecast - by Technology
- 8.1.1. Analog X-ray
- 8.1.2. Digital X-ray
- 8.2. Market Analysis, Insights and Forecast - by Application
- 8.2.1. Dental X-ray
- 8.2.2. Mammography
- 8.2.3. Chest X-ray
- 8.2.4. Abdomen X-ray
- 8.3. Market Analysis, Insights and Forecast - by Modality
- 8.3.1. Handheld X-ray Devices
- 8.3.2. Mobile X-ray Devices
- 8.4. Market Analysis, Insights and Forecast - by Geography
- 8.4.1. China
- 8.4.2. Japan
- 8.4.3. India
- 8.4.4. Australia
- 8.4.5. South Korea
- 8.4.6. Rest of Asia-Pacific
- 8.1. Market Analysis, Insights and Forecast - by Technology
- 9. Australia APAC Portable X-Ray Devices Industry Analysis, Insights and Forecast, 2019-2031
- 9.1. Market Analysis, Insights and Forecast - by Technology
- 9.1.1. Analog X-ray
- 9.1.2. Digital X-ray
- 9.2. Market Analysis, Insights and Forecast - by Application
- 9.2.1. Dental X-ray
- 9.2.2. Mammography
- 9.2.3. Chest X-ray
- 9.2.4. Abdomen X-ray
- 9.3. Market Analysis, Insights and Forecast - by Modality
- 9.3.1. Handheld X-ray Devices
- 9.3.2. Mobile X-ray Devices
- 9.4. Market Analysis, Insights and Forecast - by Geography
- 9.4.1. China
- 9.4.2. Japan
- 9.4.3. India
- 9.4.4. Australia
- 9.4.5. South Korea
- 9.4.6. Rest of Asia-Pacific
- 9.1. Market Analysis, Insights and Forecast - by Technology
- 10. South Korea APAC Portable X-Ray Devices Industry Analysis, Insights and Forecast, 2019-2031
- 10.1. Market Analysis, Insights and Forecast - by Technology
- 10.1.1. Analog X-ray
- 10.1.2. Digital X-ray
- 10.2. Market Analysis, Insights and Forecast - by Application
- 10.2.1. Dental X-ray
- 10.2.2. Mammography
- 10.2.3. Chest X-ray
- 10.2.4. Abdomen X-ray
- 10.3. Market Analysis, Insights and Forecast - by Modality
- 10.3.1. Handheld X-ray Devices
- 10.3.2. Mobile X-ray Devices
- 10.4. Market Analysis, Insights and Forecast - by Geography
- 10.4.1. China
- 10.4.2. Japan
- 10.4.3. India
- 10.4.4. Australia
- 10.4.5. South Korea
- 10.4.6. Rest of Asia-Pacific
- 10.1. Market Analysis, Insights and Forecast - by Technology
- 11. Rest of Asia Pacific APAC Portable X-Ray Devices Industry Analysis, Insights and Forecast, 2019-2031
- 11.1. Market Analysis, Insights and Forecast - by Technology
- 11.1.1. Analog X-ray
- 11.1.2. Digital X-ray
- 11.2. Market Analysis, Insights and Forecast - by Application
- 11.2.1. Dental X-ray
- 11.2.2. Mammography
- 11.2.3. Chest X-ray
- 11.2.4. Abdomen X-ray
- 11.3. Market Analysis, Insights and Forecast - by Modality
- 11.3.1. Handheld X-ray Devices
- 11.3.2. Mobile X-ray Devices
- 11.4. Market Analysis, Insights and Forecast - by Geography
- 11.4.1. China
- 11.4.2. Japan
- 11.4.3. India
- 11.4.4. Australia
- 11.4.5. South Korea
- 11.4.6. Rest of Asia-Pacific
- 11.1. Market Analysis, Insights and Forecast - by Technology
- 12. North America APAC Portable X-Ray Devices Industry Analysis, Insights and Forecast, 2019-2031
- 12.1. Market Analysis, Insights and Forecast - By Country/Sub-region
- 12.1.1 United States
- 12.1.2 Canada
- 12.1.3 Mexico
- 13. Europe APAC Portable X-Ray Devices Industry Analysis, Insights and Forecast, 2019-2031
- 13.1. Market Analysis, Insights and Forecast - By Country/Sub-region
- 13.1.1 Germany
- 13.1.2 United Kingdom
- 13.1.3 France
- 13.1.4 Spain
- 13.1.5 Italy
- 13.1.6 Spain
- 13.1.7 Belgium
- 13.1.8 Netherland
- 13.1.9 Nordics
- 13.1.10 Rest of Europe
- 14. Asia Pacific APAC Portable X-Ray Devices Industry Analysis, Insights and Forecast, 2019-2031
- 14.1. Market Analysis, Insights and Forecast - By Country/Sub-region
- 14.1.1 China
- 14.1.2 Japan
- 14.1.3 India
- 14.1.4 South Korea
- 14.1.5 Southeast Asia
- 14.1.6 Australia
- 14.1.7 Indonesia
- 14.1.8 Phillipes
- 14.1.9 Singapore
- 14.1.10 Thailandc
- 14.1.11 Rest of Asia Pacific
- 15. South America APAC Portable X-Ray Devices Industry Analysis, Insights and Forecast, 2019-2031
- 15.1. Market Analysis, Insights and Forecast - By Country/Sub-region
- 15.1.1 Brazil
- 15.1.2 Argentina
- 15.1.3 Peru
- 15.1.4 Chile
- 15.1.5 Colombia
- 15.1.6 Ecuador
- 15.1.7 Venezuela
- 15.1.8 Rest of South America
- 16. MEA APAC Portable X-Ray Devices Industry Analysis, Insights and Forecast, 2019-2031
- 16.1. Market Analysis, Insights and Forecast - By Country/Sub-region
- 16.1.1 United Arab Emirates
- 16.1.2 Saudi Arabia
- 16.1.3 South Africa
- 16.1.4 Rest of Middle East and Africa
- 17. Competitive Analysis
- 17.1. Global Market Share Analysis 2024
- 17.2. Company Profiles
- 17.2.1 Samsung Group
- 17.2.1.1. Overview
- 17.2.1.2. Products
- 17.2.1.3. SWOT Analysis
- 17.2.1.4. Recent Developments
- 17.2.1.5. Financials (Based on Availability)
- 17.2.2 Canon Inc
- 17.2.2.1. Overview
- 17.2.2.2. Products
- 17.2.2.3. SWOT Analysis
- 17.2.2.4. Recent Developments
- 17.2.2.5. Financials (Based on Availability)
- 17.2.3 Hologic Inc
- 17.2.3.1. Overview
- 17.2.3.2. Products
- 17.2.3.3. SWOT Analysis
- 17.2.3.4. Recent Developments
- 17.2.3.5. Financials (Based on Availability)
- 17.2.4 Hitachi Ltd
- 17.2.4.1. Overview
- 17.2.4.2. Products
- 17.2.4.3. SWOT Analysis
- 17.2.4.4. Recent Developments
- 17.2.4.5. Financials (Based on Availability)
- 17.2.5 Koninklijke Philips N V
- 17.2.5.1. Overview
- 17.2.5.2. Products
- 17.2.5.3. SWOT Analysis
- 17.2.5.4. Recent Developments
- 17.2.5.5. Financials (Based on Availability)
- 17.2.6 Siemens AG
- 17.2.6.1. Overview
- 17.2.6.2. Products
- 17.2.6.3. SWOT Analysis
- 17.2.6.4. Recent Developments
- 17.2.6.5. Financials (Based on Availability)
- 17.2.7 GE Healthcare
- 17.2.7.1. Overview
- 17.2.7.2. Products
- 17.2.7.3. SWOT Analysis
- 17.2.7.4. Recent Developments
- 17.2.7.5. Financials (Based on Availability)
- 17.2.8 Carestream Health Inc
- 17.2.8.1. Overview
- 17.2.8.2. Products
- 17.2.8.3. SWOT Analysis
- 17.2.8.4. Recent Developments
- 17.2.8.5. Financials (Based on Availability)
- 17.2.9 Shimadzu Corporation
- 17.2.9.1. Overview
- 17.2.9.2. Products
- 17.2.9.3. SWOT Analysis
- 17.2.9.4. Recent Developments
- 17.2.9.5. Financials (Based on Availability)
- 17.2.10 Fujifilm Holdings Corporation
- 17.2.10.1. Overview
- 17.2.10.2. Products
- 17.2.10.3. SWOT Analysis
- 17.2.10.4. Recent Developments
- 17.2.10.5. Financials (Based on Availability)
- 17.2.1 Samsung Group
List of Figures
- Figure 1: Global APAC Portable X-Ray Devices Industry Revenue Breakdown (Million, %) by Region 2024 & 2032
- Figure 2: Global APAC Portable X-Ray Devices Industry Volume Breakdown (K Unit, %) by Region 2024 & 2032
- Figure 3: North America APAC Portable X-Ray Devices Industry Revenue (Million), by Country 2024 & 2032
- Figure 4: North America APAC Portable X-Ray Devices Industry Volume (K Unit), by Country 2024 & 2032
- Figure 5: North America APAC Portable X-Ray Devices Industry Revenue Share (%), by Country 2024 & 2032
- Figure 6: North America APAC Portable X-Ray Devices Industry Volume Share (%), by Country 2024 & 2032
- Figure 7: Europe APAC Portable X-Ray Devices Industry Revenue (Million), by Country 2024 & 2032
- Figure 8: Europe APAC Portable X-Ray Devices Industry Volume (K Unit), by Country 2024 & 2032
- Figure 9: Europe APAC Portable X-Ray Devices Industry Revenue Share (%), by Country 2024 & 2032
- Figure 10: Europe APAC Portable X-Ray Devices Industry Volume Share (%), by Country 2024 & 2032
- Figure 11: Asia Pacific APAC Portable X-Ray Devices Industry Revenue (Million), by Country 2024 & 2032
- Figure 12: Asia Pacific APAC Portable X-Ray Devices Industry Volume (K Unit), by Country 2024 & 2032
- Figure 13: Asia Pacific APAC Portable X-Ray Devices Industry Revenue Share (%), by Country 2024 & 2032
- Figure 14: Asia Pacific APAC Portable X-Ray Devices Industry Volume Share (%), by Country 2024 & 2032
- Figure 15: South America APAC Portable X-Ray Devices Industry Revenue (Million), by Country 2024 & 2032
- Figure 16: South America APAC Portable X-Ray Devices Industry Volume (K Unit), by Country 2024 & 2032
- Figure 17: South America APAC Portable X-Ray Devices Industry Revenue Share (%), by Country 2024 & 2032
- Figure 18: South America APAC Portable X-Ray Devices Industry Volume Share (%), by Country 2024 & 2032
- Figure 19: MEA APAC Portable X-Ray Devices Industry Revenue (Million), by Country 2024 & 2032
- Figure 20: MEA APAC Portable X-Ray Devices Industry Volume (K Unit), by Country 2024 & 2032
- Figure 21: MEA APAC Portable X-Ray Devices Industry Revenue Share (%), by Country 2024 & 2032
- Figure 22: MEA APAC Portable X-Ray Devices Industry Volume Share (%), by Country 2024 & 2032
- Figure 23: China APAC Portable X-Ray Devices Industry Revenue (Million), by Technology 2024 & 2032
- Figure 24: China APAC Portable X-Ray Devices Industry Volume (K Unit), by Technology 2024 & 2032
- Figure 25: China APAC Portable X-Ray Devices Industry Revenue Share (%), by Technology 2024 & 2032
- Figure 26: China APAC Portable X-Ray Devices Industry Volume Share (%), by Technology 2024 & 2032
- Figure 27: China APAC Portable X-Ray Devices Industry Revenue (Million), by Application 2024 & 2032
- Figure 28: China APAC Portable X-Ray Devices Industry Volume (K Unit), by Application 2024 & 2032
- Figure 29: China APAC Portable X-Ray Devices Industry Revenue Share (%), by Application 2024 & 2032
- Figure 30: China APAC Portable X-Ray Devices Industry Volume Share (%), by Application 2024 & 2032
- Figure 31: China APAC Portable X-Ray Devices Industry Revenue (Million), by Modality 2024 & 2032
- Figure 32: China APAC Portable X-Ray Devices Industry Volume (K Unit), by Modality 2024 & 2032
- Figure 33: China APAC Portable X-Ray Devices Industry Revenue Share (%), by Modality 2024 & 2032
- Figure 34: China APAC Portable X-Ray Devices Industry Volume Share (%), by Modality 2024 & 2032
- Figure 35: China APAC Portable X-Ray Devices Industry Revenue (Million), by Geography 2024 & 2032
- Figure 36: China APAC Portable X-Ray Devices Industry Volume (K Unit), by Geography 2024 & 2032
- Figure 37: China APAC Portable X-Ray Devices Industry Revenue Share (%), by Geography 2024 & 2032
- Figure 38: China APAC Portable X-Ray Devices Industry Volume Share (%), by Geography 2024 & 2032
- Figure 39: China APAC Portable X-Ray Devices Industry Revenue (Million), by Country 2024 & 2032
- Figure 40: China APAC Portable X-Ray Devices Industry Volume (K Unit), by Country 2024 & 2032
- Figure 41: China APAC Portable X-Ray Devices Industry Revenue Share (%), by Country 2024 & 2032
- Figure 42: China APAC Portable X-Ray Devices Industry Volume Share (%), by Country 2024 & 2032
- Figure 43: Japan APAC Portable X-Ray Devices Industry Revenue (Million), by Technology 2024 & 2032
- Figure 44: Japan APAC Portable X-Ray Devices Industry Volume (K Unit), by Technology 2024 & 2032
- Figure 45: Japan APAC Portable X-Ray Devices Industry Revenue Share (%), by Technology 2024 & 2032
- Figure 46: Japan APAC Portable X-Ray Devices Industry Volume Share (%), by Technology 2024 & 2032
- Figure 47: Japan APAC Portable X-Ray Devices Industry Revenue (Million), by Application 2024 & 2032
- Figure 48: Japan APAC Portable X-Ray Devices Industry Volume (K Unit), by Application 2024 & 2032
- Figure 49: Japan APAC Portable X-Ray Devices Industry Revenue Share (%), by Application 2024 & 2032
- Figure 50: Japan APAC Portable X-Ray Devices Industry Volume Share (%), by Application 2024 & 2032
- Figure 51: Japan APAC Portable X-Ray Devices Industry Revenue (Million), by Modality 2024 & 2032
- Figure 52: Japan APAC Portable X-Ray Devices Industry Volume (K Unit), by Modality 2024 & 2032
- Figure 53: Japan APAC Portable X-Ray Devices Industry Revenue Share (%), by Modality 2024 & 2032
- Figure 54: Japan APAC Portable X-Ray Devices Industry Volume Share (%), by Modality 2024 & 2032
- Figure 55: Japan APAC Portable X-Ray Devices Industry Revenue (Million), by Geography 2024 & 2032
- Figure 56: Japan APAC Portable X-Ray Devices Industry Volume (K Unit), by Geography 2024 & 2032
- Figure 57: Japan APAC Portable X-Ray Devices Industry Revenue Share (%), by Geography 2024 & 2032
- Figure 58: Japan APAC Portable X-Ray Devices Industry Volume Share (%), by Geography 2024 & 2032
- Figure 59: Japan APAC Portable X-Ray Devices Industry Revenue (Million), by Country 2024 & 2032
- Figure 60: Japan APAC Portable X-Ray Devices Industry Volume (K Unit), by Country 2024 & 2032
- Figure 61: Japan APAC Portable X-Ray Devices Industry Revenue Share (%), by Country 2024 & 2032
- Figure 62: Japan APAC Portable X-Ray Devices Industry Volume Share (%), by Country 2024 & 2032
- Figure 63: India APAC Portable X-Ray Devices Industry Revenue (Million), by Technology 2024 & 2032
- Figure 64: India APAC Portable X-Ray Devices Industry Volume (K Unit), by Technology 2024 & 2032
- Figure 65: India APAC Portable X-Ray Devices Industry Revenue Share (%), by Technology 2024 & 2032
- Figure 66: India APAC Portable X-Ray Devices Industry Volume Share (%), by Technology 2024 & 2032
- Figure 67: India APAC Portable X-Ray Devices Industry Revenue (Million), by Application 2024 & 2032
- Figure 68: India APAC Portable X-Ray Devices Industry Volume (K Unit), by Application 2024 & 2032
- Figure 69: India APAC Portable X-Ray Devices Industry Revenue Share (%), by Application 2024 & 2032
- Figure 70: India APAC Portable X-Ray Devices Industry Volume Share (%), by Application 2024 & 2032
- Figure 71: India APAC Portable X-Ray Devices Industry Revenue (Million), by Modality 2024 & 2032
- Figure 72: India APAC Portable X-Ray Devices Industry Volume (K Unit), by Modality 2024 & 2032
- Figure 73: India APAC Portable X-Ray Devices Industry Revenue Share (%), by Modality 2024 & 2032
- Figure 74: India APAC Portable X-Ray Devices Industry Volume Share (%), by Modality 2024 & 2032
- Figure 75: India APAC Portable X-Ray Devices Industry Revenue (Million), by Geography 2024 & 2032
- Figure 76: India APAC Portable X-Ray Devices Industry Volume (K Unit), by Geography 2024 & 2032
- Figure 77: India APAC Portable X-Ray Devices Industry Revenue Share (%), by Geography 2024 & 2032
- Figure 78: India APAC Portable X-Ray Devices Industry Volume Share (%), by Geography 2024 & 2032
- Figure 79: India APAC Portable X-Ray Devices Industry Revenue (Million), by Country 2024 & 2032
- Figure 80: India APAC Portable X-Ray Devices Industry Volume (K Unit), by Country 2024 & 2032
- Figure 81: India APAC Portable X-Ray Devices Industry Revenue Share (%), by Country 2024 & 2032
- Figure 82: India APAC Portable X-Ray Devices Industry Volume Share (%), by Country 2024 & 2032
- Figure 83: Australia APAC Portable X-Ray Devices Industry Revenue (Million), by Technology 2024 & 2032
- Figure 84: Australia APAC Portable X-Ray Devices Industry Volume (K Unit), by Technology 2024 & 2032
- Figure 85: Australia APAC Portable X-Ray Devices Industry Revenue Share (%), by Technology 2024 & 2032
- Figure 86: Australia APAC Portable X-Ray Devices Industry Volume Share (%), by Technology 2024 & 2032
- Figure 87: Australia APAC Portable X-Ray Devices Industry Revenue (Million), by Application 2024 & 2032
- Figure 88: Australia APAC Portable X-Ray Devices Industry Volume (K Unit), by Application 2024 & 2032
- Figure 89: Australia APAC Portable X-Ray Devices Industry Revenue Share (%), by Application 2024 & 2032
- Figure 90: Australia APAC Portable X-Ray Devices Industry Volume Share (%), by Application 2024 & 2032
- Figure 91: Australia APAC Portable X-Ray Devices Industry Revenue (Million), by Modality 2024 & 2032
- Figure 92: Australia APAC Portable X-Ray Devices Industry Volume (K Unit), by Modality 2024 & 2032
- Figure 93: Australia APAC Portable X-Ray Devices Industry Revenue Share (%), by Modality 2024 & 2032
- Figure 94: Australia APAC Portable X-Ray Devices Industry Volume Share (%), by Modality 2024 & 2032
- Figure 95: Australia APAC Portable X-Ray Devices Industry Revenue (Million), by Geography 2024 & 2032
- Figure 96: Australia APAC Portable X-Ray Devices Industry Volume (K Unit), by Geography 2024 & 2032
- Figure 97: Australia APAC Portable X-Ray Devices Industry Revenue Share (%), by Geography 2024 & 2032
- Figure 98: Australia APAC Portable X-Ray Devices Industry Volume Share (%), by Geography 2024 & 2032
- Figure 99: Australia APAC Portable X-Ray Devices Industry Revenue (Million), by Country 2024 & 2032
- Figure 100: Australia APAC Portable X-Ray Devices Industry Volume (K Unit), by Country 2024 & 2032
- Figure 101: Australia APAC Portable X-Ray Devices Industry Revenue Share (%), by Country 2024 & 2032
- Figure 102: Australia APAC Portable X-Ray Devices Industry Volume Share (%), by Country 2024 & 2032
- Figure 103: South Korea APAC Portable X-Ray Devices Industry Revenue (Million), by Technology 2024 & 2032
- Figure 104: South Korea APAC Portable X-Ray Devices Industry Volume (K Unit), by Technology 2024 & 2032
- Figure 105: South Korea APAC Portable X-Ray Devices Industry Revenue Share (%), by Technology 2024 & 2032
- Figure 106: South Korea APAC Portable X-Ray Devices Industry Volume Share (%), by Technology 2024 & 2032
- Figure 107: South Korea APAC Portable X-Ray Devices Industry Revenue (Million), by Application 2024 & 2032
- Figure 108: South Korea APAC Portable X-Ray Devices Industry Volume (K Unit), by Application 2024 & 2032
- Figure 109: South Korea APAC Portable X-Ray Devices Industry Revenue Share (%), by Application 2024 & 2032
- Figure 110: South Korea APAC Portable X-Ray Devices Industry Volume Share (%), by Application 2024 & 2032
- Figure 111: South Korea APAC Portable X-Ray Devices Industry Revenue (Million), by Modality 2024 & 2032
- Figure 112: South Korea APAC Portable X-Ray Devices Industry Volume (K Unit), by Modality 2024 & 2032
- Figure 113: South Korea APAC Portable X-Ray Devices Industry Revenue Share (%), by Modality 2024 & 2032
- Figure 114: South Korea APAC Portable X-Ray Devices Industry Volume Share (%), by Modality 2024 & 2032
- Figure 115: South Korea APAC Portable X-Ray Devices Industry Revenue (Million), by Geography 2024 & 2032
- Figure 116: South Korea APAC Portable X-Ray Devices Industry Volume (K Unit), by Geography 2024 & 2032
- Figure 117: South Korea APAC Portable X-Ray Devices Industry Revenue Share (%), by Geography 2024 & 2032
- Figure 118: South Korea APAC Portable X-Ray Devices Industry Volume Share (%), by Geography 2024 & 2032
- Figure 119: South Korea APAC Portable X-Ray Devices Industry Revenue (Million), by Country 2024 & 2032
- Figure 120: South Korea APAC Portable X-Ray Devices Industry Volume (K Unit), by Country 2024 & 2032
- Figure 121: South Korea APAC Portable X-Ray Devices Industry Revenue Share (%), by Country 2024 & 2032
- Figure 122: South Korea APAC Portable X-Ray Devices Industry Volume Share (%), by Country 2024 & 2032
- Figure 123: Rest of Asia Pacific APAC Portable X-Ray Devices Industry Revenue (Million), by Technology 2024 & 2032
- Figure 124: Rest of Asia Pacific APAC Portable X-Ray Devices Industry Volume (K Unit), by Technology 2024 & 2032
- Figure 125: Rest of Asia Pacific APAC Portable X-Ray Devices Industry Revenue Share (%), by Technology 2024 & 2032
- Figure 126: Rest of Asia Pacific APAC Portable X-Ray Devices Industry Volume Share (%), by Technology 2024 & 2032
- Figure 127: Rest of Asia Pacific APAC Portable X-Ray Devices Industry Revenue (Million), by Application 2024 & 2032
- Figure 128: Rest of Asia Pacific APAC Portable X-Ray Devices Industry Volume (K Unit), by Application 2024 & 2032
- Figure 129: Rest of Asia Pacific APAC Portable X-Ray Devices Industry Revenue Share (%), by Application 2024 & 2032
- Figure 130: Rest of Asia Pacific APAC Portable X-Ray Devices Industry Volume Share (%), by Application 2024 & 2032
- Figure 131: Rest of Asia Pacific APAC Portable X-Ray Devices Industry Revenue (Million), by Modality 2024 & 2032
- Figure 132: Rest of Asia Pacific APAC Portable X-Ray Devices Industry Volume (K Unit), by Modality 2024 & 2032
- Figure 133: Rest of Asia Pacific APAC Portable X-Ray Devices Industry Revenue Share (%), by Modality 2024 & 2032
- Figure 134: Rest of Asia Pacific APAC Portable X-Ray Devices Industry Volume Share (%), by Modality 2024 & 2032
- Figure 135: Rest of Asia Pacific APAC Portable X-Ray Devices Industry Revenue (Million), by Geography 2024 & 2032
- Figure 136: Rest of Asia Pacific APAC Portable X-Ray Devices Industry Volume (K Unit), by Geography 2024 & 2032
- Figure 137: Rest of Asia Pacific APAC Portable X-Ray Devices Industry Revenue Share (%), by Geography 2024 & 2032
- Figure 138: Rest of Asia Pacific APAC Portable X-Ray Devices Industry Volume Share (%), by Geography 2024 & 2032
- Figure 139: Rest of Asia Pacific APAC Portable X-Ray Devices Industry Revenue (Million), by Country 2024 & 2032
- Figure 140: Rest of Asia Pacific APAC Portable X-Ray Devices Industry Volume (K Unit), by Country 2024 & 2032
- Figure 141: Rest of Asia Pacific APAC Portable X-Ray Devices Industry Revenue Share (%), by Country 2024 & 2032
- Figure 142: Rest of Asia Pacific APAC Portable X-Ray Devices Industry Volume Share (%), by Country 2024 & 2032
List of Tables
- Table 1: Global APAC Portable X-Ray Devices Industry Revenue Million Forecast, by Region 2019 & 2032
- Table 2: Global APAC Portable X-Ray Devices Industry Volume K Unit Forecast, by Region 2019 & 2032
- Table 3: Global APAC Portable X-Ray Devices Industry Revenue Million Forecast, by Technology 2019 & 2032
- Table 4: Global APAC Portable X-Ray Devices Industry Volume K Unit Forecast, by Technology 2019 & 2032
- Table 5: Global APAC Portable X-Ray Devices Industry Revenue Million Forecast, by Application 2019 & 2032
- Table 6: Global APAC Portable X-Ray Devices Industry Volume K Unit Forecast, by Application 2019 & 2032
- Table 7: Global APAC Portable X-Ray Devices Industry Revenue Million Forecast, by Modality 2019 & 2032
- Table 8: Global APAC Portable X-Ray Devices Industry Volume K Unit Forecast, by Modality 2019 & 2032
- Table 9: Global APAC Portable X-Ray Devices Industry Revenue Million Forecast, by Geography 2019 & 2032
- Table 10: Global APAC Portable X-Ray Devices Industry Volume K Unit Forecast, by Geography 2019 & 2032
- Table 11: Global APAC Portable X-Ray Devices Industry Revenue Million Forecast, by Region 2019 & 2032
- Table 12: Global APAC Portable X-Ray Devices Industry Volume K Unit Forecast, by Region 2019 & 2032
- Table 13: Global APAC Portable X-Ray Devices Industry Revenue Million Forecast, by Country 2019 & 2032
- Table 14: Global APAC Portable X-Ray Devices Industry Volume K Unit Forecast, by Country 2019 & 2032
- Table 15: United States APAC Portable X-Ray Devices Industry Revenue (Million) Forecast, by Application 2019 & 2032
- Table 16: United States APAC Portable X-Ray Devices Industry Volume (K Unit) Forecast, by Application 2019 & 2032
- Table 17: Canada APAC Portable X-Ray Devices Industry Revenue (Million) Forecast, by Application 2019 & 2032
- Table 18: Canada APAC Portable X-Ray Devices Industry Volume (K Unit) Forecast, by Application 2019 & 2032
- Table 19: Mexico APAC Portable X-Ray Devices Industry Revenue (Million) Forecast, by Application 2019 & 2032
- Table 20: Mexico APAC Portable X-Ray Devices Industry Volume (K Unit) Forecast, by Application 2019 & 2032
- Table 21: Global APAC Portable X-Ray Devices Industry Revenue Million Forecast, by Country 2019 & 2032
- Table 22: Global APAC Portable X-Ray Devices Industry Volume K Unit Forecast, by Country 2019 & 2032
- Table 23: Germany APAC Portable X-Ray Devices Industry Revenue (Million) Forecast, by Application 2019 & 2032
- Table 24: Germany APAC Portable X-Ray Devices Industry Volume (K Unit) Forecast, by Application 2019 & 2032
- Table 25: United Kingdom APAC Portable X-Ray Devices Industry Revenue (Million) Forecast, by Application 2019 & 2032
- Table 26: United Kingdom APAC Portable X-Ray Devices Industry Volume (K Unit) Forecast, by Application 2019 & 2032
- Table 27: France APAC Portable X-Ray Devices Industry Revenue (Million) Forecast, by Application 2019 & 2032
- Table 28: France APAC Portable X-Ray Devices Industry Volume (K Unit) Forecast, by Application 2019 & 2032
- Table 29: Spain APAC Portable X-Ray Devices Industry Revenue (Million) Forecast, by Application 2019 & 2032
- Table 30: Spain APAC Portable X-Ray Devices Industry Volume (K Unit) Forecast, by Application 2019 & 2032
- Table 31: Italy APAC Portable X-Ray Devices Industry Revenue (Million) Forecast, by Application 2019 & 2032
- Table 32: Italy APAC Portable X-Ray Devices Industry Volume (K Unit) Forecast, by Application 2019 & 2032
- Table 33: Spain APAC Portable X-Ray Devices Industry Revenue (Million) Forecast, by Application 2019 & 2032
- Table 34: Spain APAC Portable X-Ray Devices Industry Volume (K Unit) Forecast, by Application 2019 & 2032
- Table 35: Belgium APAC Portable X-Ray Devices Industry Revenue (Million) Forecast, by Application 2019 & 2032
- Table 36: Belgium APAC Portable X-Ray Devices Industry Volume (K Unit) Forecast, by Application 2019 & 2032
- Table 37: Netherland APAC Portable X-Ray Devices Industry Revenue (Million) Forecast, by Application 2019 & 2032
- Table 38: Netherland APAC Portable X-Ray Devices Industry Volume (K Unit) Forecast, by Application 2019 & 2032
- Table 39: Nordics APAC Portable X-Ray Devices Industry Revenue (Million) Forecast, by Application 2019 & 2032
- Table 40: Nordics APAC Portable X-Ray Devices Industry Volume (K Unit) Forecast, by Application 2019 & 2032
- Table 41: Rest of Europe APAC Portable X-Ray Devices Industry Revenue (Million) Forecast, by Application 2019 & 2032
- Table 42: Rest of Europe APAC Portable X-Ray Devices Industry Volume (K Unit) Forecast, by Application 2019 & 2032
- Table 43: Global APAC Portable X-Ray Devices Industry Revenue Million Forecast, by Country 2019 & 2032
- Table 44: Global APAC Portable X-Ray Devices Industry Volume K Unit Forecast, by Country 2019 & 2032
- Table 45: China APAC Portable X-Ray Devices Industry Revenue (Million) Forecast, by Application 2019 & 2032
- Table 46: China APAC Portable X-Ray Devices Industry Volume (K Unit) Forecast, by Application 2019 & 2032
- Table 47: Japan APAC Portable X-Ray Devices Industry Revenue (Million) Forecast, by Application 2019 & 2032
- Table 48: Japan APAC Portable X-Ray Devices Industry Volume (K Unit) Forecast, by Application 2019 & 2032
- Table 49: India APAC Portable X-Ray Devices Industry Revenue (Million) Forecast, by Application 2019 & 2032
- Table 50: India APAC Portable X-Ray Devices Industry Volume (K Unit) Forecast, by Application 2019 & 2032
- Table 51: South Korea APAC Portable X-Ray Devices Industry Revenue (Million) Forecast, by Application 2019 & 2032
- Table 52: South Korea APAC Portable X-Ray Devices Industry Volume (K Unit) Forecast, by Application 2019 & 2032
- Table 53: Southeast Asia APAC Portable X-Ray Devices Industry Revenue (Million) Forecast, by Application 2019 & 2032
- Table 54: Southeast Asia APAC Portable X-Ray Devices Industry Volume (K Unit) Forecast, by Application 2019 & 2032
- Table 55: Australia APAC Portable X-Ray Devices Industry Revenue (Million) Forecast, by Application 2019 & 2032
- Table 56: Australia APAC Portable X-Ray Devices Industry Volume (K Unit) Forecast, by Application 2019 & 2032
- Table 57: Indonesia APAC Portable X-Ray Devices Industry Revenue (Million) Forecast, by Application 2019 & 2032
- Table 58: Indonesia APAC Portable X-Ray Devices Industry Volume (K Unit) Forecast, by Application 2019 & 2032
- Table 59: Phillipes APAC Portable X-Ray Devices Industry Revenue (Million) Forecast, by Application 2019 & 2032
- Table 60: Phillipes APAC Portable X-Ray Devices Industry Volume (K Unit) Forecast, by Application 2019 & 2032
- Table 61: Singapore APAC Portable X-Ray Devices Industry Revenue (Million) Forecast, by Application 2019 & 2032
- Table 62: Singapore APAC Portable X-Ray Devices Industry Volume (K Unit) Forecast, by Application 2019 & 2032
- Table 63: Thailandc APAC Portable X-Ray Devices Industry Revenue (Million) Forecast, by Application 2019 & 2032
- Table 64: Thailandc APAC Portable X-Ray Devices Industry Volume (K Unit) Forecast, by Application 2019 & 2032
- Table 65: Rest of Asia Pacific APAC Portable X-Ray Devices Industry Revenue (Million) Forecast, by Application 2019 & 2032
- Table 66: Rest of Asia Pacific APAC Portable X-Ray Devices Industry Volume (K Unit) Forecast, by Application 2019 & 2032
- Table 67: Global APAC Portable X-Ray Devices Industry Revenue Million Forecast, by Country 2019 & 2032
- Table 68: Global APAC Portable X-Ray Devices Industry Volume K Unit Forecast, by Country 2019 & 2032
- Table 69: Brazil APAC Portable X-Ray Devices Industry Revenue (Million) Forecast, by Application 2019 & 2032
- Table 70: Brazil APAC Portable X-Ray Devices Industry Volume (K Unit) Forecast, by Application 2019 & 2032
- Table 71: Argentina APAC Portable X-Ray Devices Industry Revenue (Million) Forecast, by Application 2019 & 2032
- Table 72: Argentina APAC Portable X-Ray Devices Industry Volume (K Unit) Forecast, by Application 2019 & 2032
- Table 73: Peru APAC Portable X-Ray Devices Industry Revenue (Million) Forecast, by Application 2019 & 2032
- Table 74: Peru APAC Portable X-Ray Devices Industry Volume (K Unit) Forecast, by Application 2019 & 2032
- Table 75: Chile APAC Portable X-Ray Devices Industry Revenue (Million) Forecast, by Application 2019 & 2032
- Table 76: Chile APAC Portable X-Ray Devices Industry Volume (K Unit) Forecast, by Application 2019 & 2032
- Table 77: Colombia APAC Portable X-Ray Devices Industry Revenue (Million) Forecast, by Application 2019 & 2032
- Table 78: Colombia APAC Portable X-Ray Devices Industry Volume (K Unit) Forecast, by Application 2019 & 2032
- Table 79: Ecuador APAC Portable X-Ray Devices Industry Revenue (Million) Forecast, by Application 2019 & 2032
- Table 80: Ecuador APAC Portable X-Ray Devices Industry Volume (K Unit) Forecast, by Application 2019 & 2032
- Table 81: Venezuela APAC Portable X-Ray Devices Industry Revenue (Million) Forecast, by Application 2019 & 2032
- Table 82: Venezuela APAC Portable X-Ray Devices Industry Volume (K Unit) Forecast, by Application 2019 & 2032
- Table 83: Rest of South America APAC Portable X-Ray Devices Industry Revenue (Million) Forecast, by Application 2019 & 2032
- Table 84: Rest of South America APAC Portable X-Ray Devices Industry Volume (K Unit) Forecast, by Application 2019 & 2032
- Table 85: Global APAC Portable X-Ray Devices Industry Revenue Million Forecast, by Country 2019 & 2032
- Table 86: Global APAC Portable X-Ray Devices Industry Volume K Unit Forecast, by Country 2019 & 2032
- Table 87: United Arab Emirates APAC Portable X-Ray Devices Industry Revenue (Million) Forecast, by Application 2019 & 2032
- Table 88: United Arab Emirates APAC Portable X-Ray Devices Industry Volume (K Unit) Forecast, by Application 2019 & 2032
- Table 89: Saudi Arabia APAC Portable X-Ray Devices Industry Revenue (Million) Forecast, by Application 2019 & 2032
- Table 90: Saudi Arabia APAC Portable X-Ray Devices Industry Volume (K Unit) Forecast, by Application 2019 & 2032
- Table 91: South Africa APAC Portable X-Ray Devices Industry Revenue (Million) Forecast, by Application 2019 & 2032
- Table 92: South Africa APAC Portable X-Ray Devices Industry Volume (K Unit) Forecast, by Application 2019 & 2032
- Table 93: Rest of Middle East and Africa APAC Portable X-Ray Devices Industry Revenue (Million) Forecast, by Application 2019 & 2032
- Table 94: Rest of Middle East and Africa APAC Portable X-Ray Devices Industry Volume (K Unit) Forecast, by Application 2019 & 2032
- Table 95: Global APAC Portable X-Ray Devices Industry Revenue Million Forecast, by Technology 2019 & 2032
- Table 96: Global APAC Portable X-Ray Devices Industry Volume K Unit Forecast, by Technology 2019 & 2032
- Table 97: Global APAC Portable X-Ray Devices Industry Revenue Million Forecast, by Application 2019 & 2032
- Table 98: Global APAC Portable X-Ray Devices Industry Volume K Unit Forecast, by Application 2019 & 2032
- Table 99: Global APAC Portable X-Ray Devices Industry Revenue Million Forecast, by Modality 2019 & 2032
- Table 100: Global APAC Portable X-Ray Devices Industry Volume K Unit Forecast, by Modality 2019 & 2032
- Table 101: Global APAC Portable X-Ray Devices Industry Revenue Million Forecast, by Geography 2019 & 2032
- Table 102: Global APAC Portable X-Ray Devices Industry Volume K Unit Forecast, by Geography 2019 & 2032
- Table 103: Global APAC Portable X-Ray Devices Industry Revenue Million Forecast, by Country 2019 & 2032
- Table 104: Global APAC Portable X-Ray Devices Industry Volume K Unit Forecast, by Country 2019 & 2032
- Table 105: Global APAC Portable X-Ray Devices Industry Revenue Million Forecast, by Technology 2019 & 2032
- Table 106: Global APAC Portable X-Ray Devices Industry Volume K Unit Forecast, by Technology 2019 & 2032
- Table 107: Global APAC Portable X-Ray Devices Industry Revenue Million Forecast, by Application 2019 & 2032
- Table 108: Global APAC Portable X-Ray Devices Industry Volume K Unit Forecast, by Application 2019 & 2032
- Table 109: Global APAC Portable X-Ray Devices Industry Revenue Million Forecast, by Modality 2019 & 2032
- Table 110: Global APAC Portable X-Ray Devices Industry Volume K Unit Forecast, by Modality 2019 & 2032
- Table 111: Global APAC Portable X-Ray Devices Industry Revenue Million Forecast, by Geography 2019 & 2032
- Table 112: Global APAC Portable X-Ray Devices Industry Volume K Unit Forecast, by Geography 2019 & 2032
- Table 113: Global APAC Portable X-Ray Devices Industry Revenue Million Forecast, by Country 2019 & 2032
- Table 114: Global APAC Portable X-Ray Devices Industry Volume K Unit Forecast, by Country 2019 & 2032
- Table 115: Global APAC Portable X-Ray Devices Industry Revenue Million Forecast, by Technology 2019 & 2032
- Table 116: Global APAC Portable X-Ray Devices Industry Volume K Unit Forecast, by Technology 2019 & 2032
- Table 117: Global APAC Portable X-Ray Devices Industry Revenue Million Forecast, by Application 2019 & 2032
- Table 118: Global APAC Portable X-Ray Devices Industry Volume K Unit Forecast, by Application 2019 & 2032
- Table 119: Global APAC Portable X-Ray Devices Industry Revenue Million Forecast, by Modality 2019 & 2032
- Table 120: Global APAC Portable X-Ray Devices Industry Volume K Unit Forecast, by Modality 2019 & 2032
- Table 121: Global APAC Portable X-Ray Devices Industry Revenue Million Forecast, by Geography 2019 & 2032
- Table 122: Global APAC Portable X-Ray Devices Industry Volume K Unit Forecast, by Geography 2019 & 2032
- Table 123: Global APAC Portable X-Ray Devices Industry Revenue Million Forecast, by Country 2019 & 2032
- Table 124: Global APAC Portable X-Ray Devices Industry Volume K Unit Forecast, by Country 2019 & 2032
- Table 125: Global APAC Portable X-Ray Devices Industry Revenue Million Forecast, by Technology 2019 & 2032
- Table 126: Global APAC Portable X-Ray Devices Industry Volume K Unit Forecast, by Technology 2019 & 2032
- Table 127: Global APAC Portable X-Ray Devices Industry Revenue Million Forecast, by Application 2019 & 2032
- Table 128: Global APAC Portable X-Ray Devices Industry Volume K Unit Forecast, by Application 2019 & 2032
- Table 129: Global APAC Portable X-Ray Devices Industry Revenue Million Forecast, by Modality 2019 & 2032
- Table 130: Global APAC Portable X-Ray Devices Industry Volume K Unit Forecast, by Modality 2019 & 2032
- Table 131: Global APAC Portable X-Ray Devices Industry Revenue Million Forecast, by Geography 2019 & 2032
- Table 132: Global APAC Portable X-Ray Devices Industry Volume K Unit Forecast, by Geography 2019 & 2032
- Table 133: Global APAC Portable X-Ray Devices Industry Revenue Million Forecast, by Country 2019 & 2032
- Table 134: Global APAC Portable X-Ray Devices Industry Volume K Unit Forecast, by Country 2019 & 2032
- Table 135: Global APAC Portable X-Ray Devices Industry Revenue Million Forecast, by Technology 2019 & 2032
- Table 136: Global APAC Portable X-Ray Devices Industry Volume K Unit Forecast, by Technology 2019 & 2032
- Table 137: Global APAC Portable X-Ray Devices Industry Revenue Million Forecast, by Application 2019 & 2032
- Table 138: Global APAC Portable X-Ray Devices Industry Volume K Unit Forecast, by Application 2019 & 2032
- Table 139: Global APAC Portable X-Ray Devices Industry Revenue Million Forecast, by Modality 2019 & 2032
- Table 140: Global APAC Portable X-Ray Devices Industry Volume K Unit Forecast, by Modality 2019 & 2032
- Table 141: Global APAC Portable X-Ray Devices Industry Revenue Million Forecast, by Geography 2019 & 2032
- Table 142: Global APAC Portable X-Ray Devices Industry Volume K Unit Forecast, by Geography 2019 & 2032
- Table 143: Global APAC Portable X-Ray Devices Industry Revenue Million Forecast, by Country 2019 & 2032
- Table 144: Global APAC Portable X-Ray Devices Industry Volume K Unit Forecast, by Country 2019 & 2032
- Table 145: Global APAC Portable X-Ray Devices Industry Revenue Million Forecast, by Technology 2019 & 2032
- Table 146: Global APAC Portable X-Ray Devices Industry Volume K Unit Forecast, by Technology 2019 & 2032
- Table 147: Global APAC Portable X-Ray Devices Industry Revenue Million Forecast, by Application 2019 & 2032
- Table 148: Global APAC Portable X-Ray Devices Industry Volume K Unit Forecast, by Application 2019 & 2032
- Table 149: Global APAC Portable X-Ray Devices Industry Revenue Million Forecast, by Modality 2019 & 2032
- Table 150: Global APAC Portable X-Ray Devices Industry Volume K Unit Forecast, by Modality 2019 & 2032
- Table 151: Global APAC Portable X-Ray Devices Industry Revenue Million Forecast, by Geography 2019 & 2032
- Table 152: Global APAC Portable X-Ray Devices Industry Volume K Unit Forecast, by Geography 2019 & 2032
- Table 153: Global APAC Portable X-Ray Devices Industry Revenue Million Forecast, by Country 2019 & 2032
- Table 154: Global APAC Portable X-Ray Devices Industry Volume K Unit Forecast, by Country 2019 & 2032
Frequently Asked Questions
1. What is the projected Compound Annual Growth Rate (CAGR) of the APAC Portable X-Ray Devices Industry?
The projected CAGR is approximately 10.75%.
2. Which companies are prominent players in the APAC Portable X-Ray Devices Industry?
Key companies in the market include Samsung Group, Canon Inc, Hologic Inc, Hitachi Ltd, Koninklijke Philips N V, Siemens AG, GE Healthcare, Carestream Health Inc, Shimadzu Corporation, Fujifilm Holdings Corporation.
3. What are the main segments of the APAC Portable X-Ray Devices Industry?
The market segments include Technology, Application, Modality, Geography.
4. Can you provide details about the market size?
The market size is estimated to be USD 1.54 Million as of 2022.
5. What are some drivers contributing to market growth?
Rising Burden of Diseases Requiring Diagnosis; Rising Technological Advancement of X-Ray Devices.
6. What are the notable trends driving market growth?
Mammography Segment is Expected to Grow With a Significant CAGR Over the Forecast Period of the Study.
7. Are there any restraints impacting market growth?
High Costs of Devices.
8. Can you provide examples of recent developments in the market?
February 2023: Carestream Health India launched its high-powered Carestream Motion Mobile X-ray system. The system is fully equipped to carry out a full range of general radiography examinations.
9. What pricing options are available for accessing the report?
Pricing options include single-user, multi-user, and enterprise licenses priced at USD 4750, USD 5250, and USD 8750 respectively.
10. Is the market size provided in terms of value or volume?
The market size is provided in terms of value, measured in Million and volume, measured in K Unit.
11. Are there any specific market keywords associated with the report?
Yes, the market keyword associated with the report is "APAC Portable X-Ray Devices Industry," which aids in identifying and referencing the specific market segment covered.
12. How do I determine which pricing option suits my needs best?
The pricing options vary based on user requirements and access needs. Individual users may opt for single-user licenses, while businesses requiring broader access may choose multi-user or enterprise licenses for cost-effective access to the report.
13. Are there any additional resources or data provided in the APAC Portable X-Ray Devices Industry report?
While the report offers comprehensive insights, it's advisable to review the specific contents or supplementary materials provided to ascertain if additional resources or data are available.
14. How can I stay updated on further developments or reports in the APAC Portable X-Ray Devices Industry?
To stay informed about further developments, trends, and reports in the APAC Portable X-Ray Devices Industry, consider subscribing to industry newsletters, following relevant companies and organizations, or regularly checking reputable industry news sources and publications.
Methodology
Step 1 - Identification of Relevant Samples Size from Population Database


Step 2 - Approaches for Defining Global Market Size (Value, Volume* & Price*)

Note*: In applicable scenarios
Step 3 - Data Sources
Primary Research
- Web Analytics
- Survey Reports
- Research Institute
- Latest Research Reports
- Opinion Leaders
Secondary Research
- Annual Reports
- White Paper
- Latest Press Release
- Industry Association
- Paid Database
- Investor Presentations

Step 4 - Data Triangulation
Involves using different sources of information in order to increase the validity of a study
These sources are likely to be stakeholders in a program - participants, other researchers, program staff, other community members, and so on.
Then we put all data in single framework & apply various statistical tools to find out the dynamic on the market.
During the analysis stage, feedback from the stakeholder groups would be compared to determine areas of agreement as well as areas of divergence
