

Key Insights
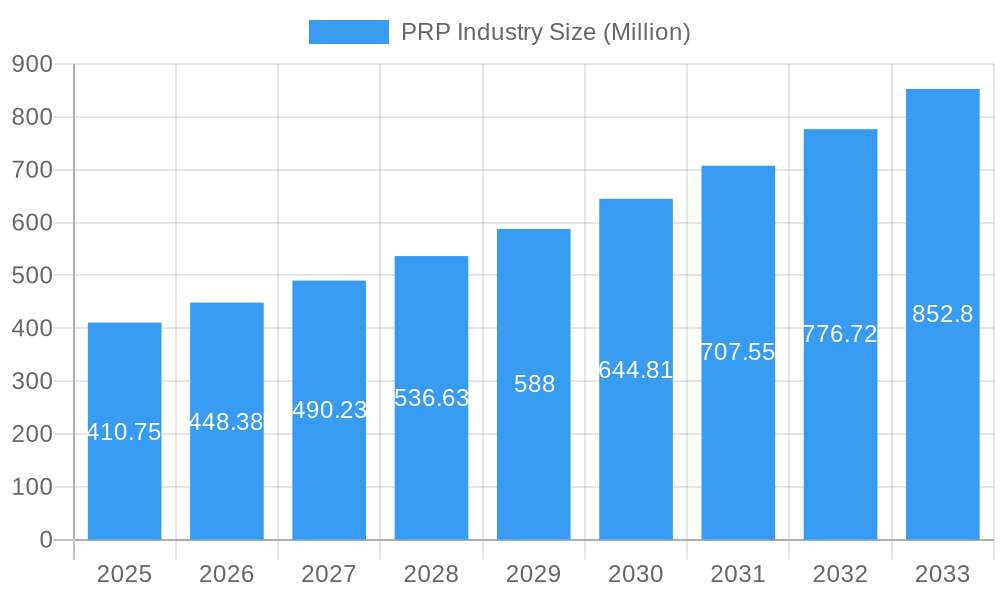
The Platelet-Rich Plasma (PRP) market is experiencing robust growth, projected to reach \$410.75 million in 2025 and exhibiting a Compound Annual Growth Rate (CAGR) of 9.03% from 2025 to 2033. This expansion is driven by several key factors. Firstly, the increasing prevalence of orthopedic injuries and conditions, coupled with the rising demand for minimally invasive and regenerative therapies, fuels significant market adoption. The efficacy of PRP in accelerating tissue healing and reducing recovery time is well-documented, making it a preferred treatment option among both patients and healthcare professionals. Furthermore, advancements in PRP preparation techniques, resulting in improved purity and efficacy of various PRP types (Pure PRP, Leukocyte-rich PRP, Leukocyte-rich Fibrin), are significantly expanding its applications across diverse fields like cosmetic surgery, cardiology, and ophthalmology. Growing investments in research and development, particularly in areas such as the combination of PRP with other regenerative therapies, further bolster market growth. The presence of established players like Terumo BCT Inc., Arthrex Inc., and Zimmer Biomet, alongside emerging companies, fosters innovation and competition, leading to a more dynamic and expanding market.
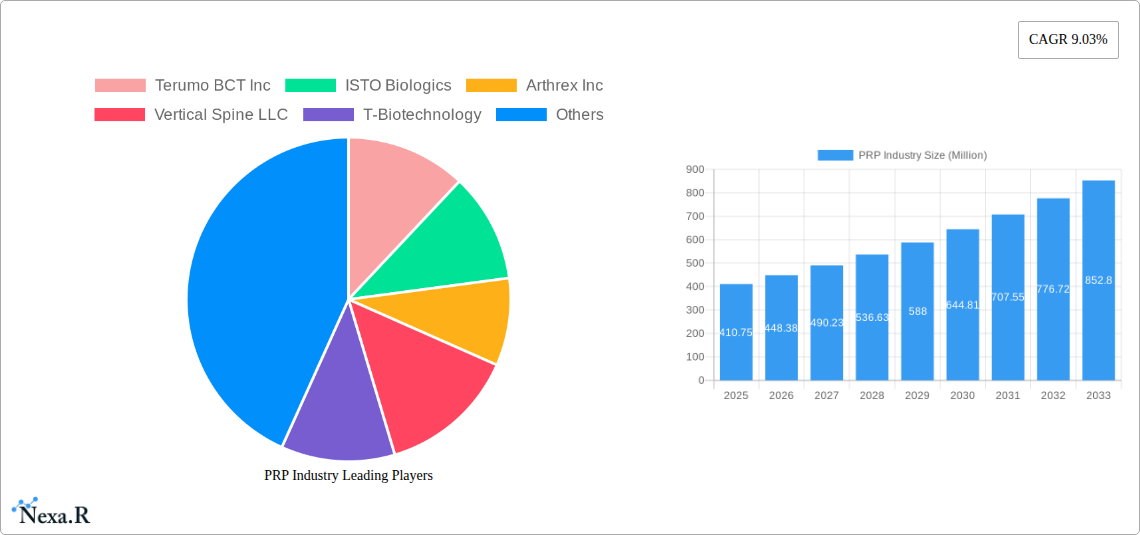
PRP Industry Market Size (In Million)
The market segmentation reveals significant opportunities within specific end-user segments. Hospitals and clinics represent a substantial portion of the market, owing to their established infrastructure and access to patients requiring PRP treatments. The orthopedic application segment dominates due to the high incidence of sports injuries and age-related degenerative joint diseases. However, increasing awareness and adoption in other therapeutic areas, such as cosmetic surgery and dermatology, and neurological and cardiovascular applications, are contributing to diversified market growth. Geographical expansion, especially across rapidly developing economies in the Asia-Pacific region, offers substantial growth potential. While regulatory hurdles and the relatively high cost of PRP treatments pose certain restraints, the overall positive clinical outcomes and growing patient demand are expected to outweigh these challenges, ensuring a sustained trajectory of growth for the PRP industry over the forecast period.
PRP Industry Company Market Share
PRP Industry Market Report: 2019-2033
This comprehensive report provides a detailed analysis of the Platelet-Rich Plasma (PRP) industry, encompassing market dynamics, growth trends, competitive landscape, and future outlook. The study period covers 2019-2033, with 2025 as the base and estimated year. This report is essential for industry professionals, investors, and researchers seeking in-depth insights into this rapidly evolving sector.
Keywords: PRP Market, Platelet-Rich Plasma, PRP Therapy, Orthopedics, Cosmetic Surgery, Regenerative Medicine, PRP Devices, PRP Kits, Market Size, Market Share, Market Growth, Terumo BCT, Arthrex, Zimmer Biomet, Isto Biologics, Market Analysis, Industry Trends, Forecast, Hospitals, Clinics, Research Institutes, Pure PRP, Leukocyte-rich PRP, Competitive Landscape, M&A
PRP Industry Market Dynamics & Structure
The PRP industry is characterized by a moderately concentrated market structure with several key players dominating various segments. Technological innovation, particularly in PRP processing and delivery systems, is a crucial driver. Regulatory frameworks vary across geographies, influencing market access and adoption rates. The presence of competitive substitutes, such as other regenerative medicine therapies, necessitates continuous product differentiation. The end-user demographic is expanding to encompass a wider range of medical applications, fueled by growing awareness and acceptance. M&A activity has been relatively moderate but strategic acquisitions have shaped the competitive landscape.
- Market Concentration: Moderately concentrated, with top 5 players holding approximately xx% market share in 2025.
- Technological Innovation: Focus on automated systems, improved PRP yield, and minimally invasive delivery methods.
- Regulatory Frameworks: Vary significantly across regions, impacting market access and product approval timelines.
- Competitive Substitutes: Stem cell therapy, hyaluronic acid injections, and other regenerative approaches pose competition.
- End-User Demographics: Expanding across various medical specialties and age groups, driven by increased awareness and acceptance.
- M&A Activity: xx major deals recorded between 2019-2024, with a projected xx deals during the forecast period (2025-2033).
PRP Industry Growth Trends & Insights
The global PRP market exhibited robust growth during the historical period (2019-2024), driven by increasing applications in orthopedics, cosmetic surgery, and other medical specialties. The market size reached xx Million in 2024, and is projected to reach xx Million by 2025. This growth is fueled by several key factors: rising prevalence of musculoskeletal disorders, growing demand for minimally invasive procedures, and technological advancements enhancing PRP efficacy and ease of use. Adoption rates are increasing steadily, particularly in developed economies, although challenges remain in terms of standardization and cost-effectiveness. Technological disruptions, such as the development of automated PRP processing systems, are accelerating market growth. Consumer behavior shifts toward minimally invasive and regenerative treatments contribute significantly to the upward trend. The CAGR during the forecast period (2025-2033) is estimated at xx%. Market penetration is expected to increase from xx% in 2025 to xx% by 2033.
Dominant Regions, Countries, or Segments in PRP Industry
North America currently dominates the global PRP market, driven by high healthcare expenditure, advanced medical infrastructure, and early adoption of innovative therapies. Within North America, the United States holds the largest market share. Europe follows as the second-largest market, with significant growth potential in emerging economies. The orthopedics segment holds the largest application share, followed by cosmetic surgery and dermatology. Among types, Leukocyte-rich PRP currently dominates, but Pure PRP is gaining traction due to its purity and efficacy in certain applications. Hospitals and clinics represent the largest end-user segment, owing to their established infrastructure and widespread access to PRP procedures.
- Key Drivers (North America): High healthcare expenditure, advanced medical infrastructure, early adoption of new technologies, strong regulatory support.
- Key Drivers (Europe): Growing awareness of regenerative medicine, increasing prevalence of musculoskeletal disorders, expanding healthcare infrastructure.
- Segment Dominance: Orthopedics (xx% market share in 2025), followed by Cosmetic Surgery and Dermatology (xx%). Leukocyte-rich PRP holds the majority share in the product type segment.
- Growth Potential: Emerging markets in Asia-Pacific and Latin America offer significant growth opportunities.
PRP Industry Product Landscape
The PRP industry offers a range of products, from simple PRP kits for manual preparation to advanced automated systems capable of high-volume processing. These products vary in terms of features, ease of use, and cost. Significant advancements include closed-system processing, improved platelet concentration techniques, and the development of novel delivery devices for minimally invasive procedures. Key selling propositions include improved efficacy, reduced procedure time, and enhanced patient safety. Technological advancements are focused on automation, standardization, and optimizing PRP quality.
Key Drivers, Barriers & Challenges in PRP Industry
Key Drivers:
- Increasing prevalence of age-related diseases and musculoskeletal disorders.
- Growing demand for minimally invasive procedures with faster recovery times.
- Advancements in PRP processing technologies, leading to improved efficacy and ease of use.
- Rising healthcare expenditure and increased insurance coverage in several regions.
Key Barriers & Challenges:
- Lack of standardization in PRP preparation and treatment protocols.
- High cost of PRP therapies compared to conventional treatments.
- Regulatory hurdles and varying approval processes across different regions.
- Competition from other regenerative medicine therapies and surgical options. This limits market penetration in some segments (estimated impact: xx% reduction in market growth).
Emerging Opportunities in PRP Industry
- Expanding applications of PRP in new therapeutic areas, such as cardiology and neurology.
- Development of novel PRP delivery systems and combination therapies.
- Penetration into untapped markets in emerging economies with growing healthcare infrastructure.
- Increased adoption of PRP in veterinary medicine.
Growth Accelerators in the PRP Industry
Technological breakthroughs, particularly in automated processing and precise delivery methods, are accelerating market growth. Strategic partnerships between PRP manufacturers and healthcare providers are improving market access and treatment standardization. Market expansion strategies into emerging economies with high disease prevalence are creating new avenues for revenue growth.
Key Players Shaping the PRP Industry Market
- Terumo BCT Inc
- ISTO Biologics
- Arthrex Inc
- Vertical Spine LLC
- T-Biotechnology
- DePuy Synthes
- EmCyte Corporation
- Isto Biologics
- Harvest Technologies Corporation
- Glofinn Oy
- Zimmer Biomet
- Dr PRP USA LLC
Notable Milestones in PRP Industry Sector
- February 2021: Atlas Health Medical Group announced PRP (Platelet-rich Plasma) Microneedling Facelifts for patients.
- February 2020: EmCyte completed the acquisition of Cellmedix Holdings LLC, including its Centrepid Platelet Concentrator.
In-Depth PRP Industry Market Outlook
The PRP industry is poised for significant growth over the next decade, driven by continuous technological innovation, increasing awareness of its therapeutic benefits, and expansion into new applications. Strategic collaborations, focusing on research and development, will play a crucial role in driving market penetration and shaping future market dynamics. The development of standardized protocols and cost-effective treatments will be key to maximizing the market potential.
PRP Industry Segmentation
-
1. Type
- 1.1. Pure PRP
- 1.2. Leukocyte-rich PRP
- 1.3. Leukocyte-rich Fibrin
- 1.4. Other Types
-
2. Application
- 2.1. Orthopedics
- 2.2. Cosmetic Surgery and Dermatology
- 2.3. Neurology
- 2.4. Cardiology
- 2.5. Ophthalmology
- 2.6. Other Applications
-
3. End User
- 3.1. Hospitals and Clinics
- 3.2. Research Institutes
PRP Industry Segmentation By Geography
-
1. North America
- 1.1. United States
- 1.2. Canada
- 1.3. Mexico
-
2. Europe
- 2.1. Germany
- 2.2. United Kingdom
- 2.3. France
- 2.4. Italy
- 2.5. Spain
- 2.6. Rest of Europe
-
3. Asia Pacific
- 3.1. China
- 3.2. Japan
- 3.3. India
- 3.4. Australia
- 3.5. South Korea
- 3.6. Rest of Asia Pacific
- 4. Middle East
-
5. GCC
- 5.1. South Africa
- 5.2. Rest of Middle East
-
6. South America
- 6.1. Brazil
- 6.2. Argentina
- 6.3. Rest of South America
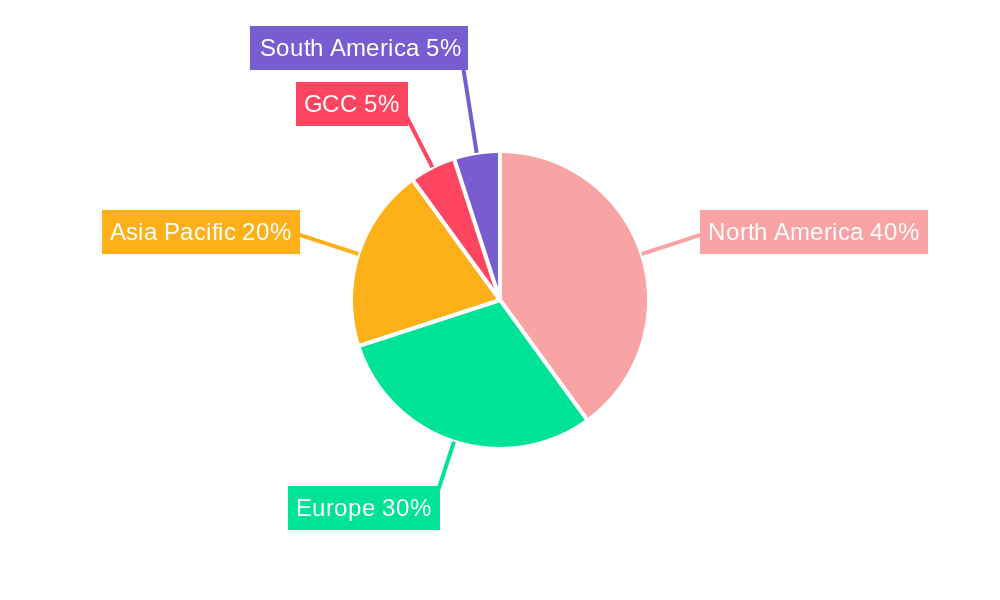
PRP Industry Regional Market Share
Geographic Coverage of PRP Industry
PRP Industry REPORT HIGHLIGHTS
| Aspects | Details |
|---|---|
| Study Period | 2020-2034 |
| Base Year | 2025 |
| Estimated Year | 2026 |
| Forecast Period | 2026-2034 |
| Historical Period | 2020-2025 |
| Growth Rate | CAGR of 9.03% from 2020-2034 |
| Segmentation |
|
Table of Contents
- 1. Introduction
- 1.1. Research Scope
- 1.2. Market Segmentation
- 1.3. Research Objective
- 1.4. Definitions and Assumptions
- 2. Executive Summary
- 2.1. Market Snapshot
- 3. Market Dynamics
- 3.1. Market Drivers
- 3.2. Market Restrains
- 3.3. Market Trends
- 3.4. Market Opportunities
- 4. Market Factor Analysis
- 4.1. Porters Five Forces
- 4.1.1. Bargaining Power of Suppliers
- 4.1.2. Bargaining Power of Buyers
- 4.1.3. Threat of New Entrants
- 4.1.4. Threat of Substitutes
- 4.1.5. Competitive Rivalry
- 4.2. PESTEL analysis
- 4.3. BCG Analysis
- 4.3.1. Stars (High Growth, High Market Share)
- 4.3.2. Cash Cows (Low Growth, High Market Share)
- 4.3.3. Question Mark (High Growth, Low Market Share)
- 4.3.4. Dogs (Low Growth, Low Market Share)
- 4.4. Ansoff Matrix Analysis
- 4.5. Supply Chain Analysis
- 4.6. Regulatory Landscape
- 4.7. Current Market Potential and Opportunity Assessment (TAM–SAM–SOM Framework)
- 4.8. NRP Analyst Note
- 4.1. Porters Five Forces
- 5. Market Analysis, Insights and Forecast 2021-2033
- 5.1. Market Analysis, Insights and Forecast - by Type
- 5.1.1. Pure PRP
- 5.1.2. Leukocyte-rich PRP
- 5.1.3. Leukocyte-rich Fibrin
- 5.1.4. Other Types
- 5.2. Market Analysis, Insights and Forecast - by Application
- 5.2.1. Orthopedics
- 5.2.2. Cosmetic Surgery and Dermatology
- 5.2.3. Neurology
- 5.2.4. Cardiology
- 5.2.5. Ophthalmology
- 5.2.6. Other Applications
- 5.3. Market Analysis, Insights and Forecast - by End User
- 5.3.1. Hospitals and Clinics
- 5.3.2. Research Institutes
- 5.4. Market Analysis, Insights and Forecast - by Region
- 5.4.1. North America
- 5.4.2. Europe
- 5.4.3. Asia Pacific
- 5.4.4. Middle East
- 5.4.5. GCC
- 5.4.6. South America
- 5.1. Market Analysis, Insights and Forecast - by Type
- 6. Global PRP Industry Analysis, Insights and Forecast, 2021-2033
- 6.1. Market Analysis, Insights and Forecast - by Type
- 6.1.1. Pure PRP
- 6.1.2. Leukocyte-rich PRP
- 6.1.3. Leukocyte-rich Fibrin
- 6.1.4. Other Types
- 6.2. Market Analysis, Insights and Forecast - by Application
- 6.2.1. Orthopedics
- 6.2.2. Cosmetic Surgery and Dermatology
- 6.2.3. Neurology
- 6.2.4. Cardiology
- 6.2.5. Ophthalmology
- 6.2.6. Other Applications
- 6.3. Market Analysis, Insights and Forecast - by End User
- 6.3.1. Hospitals and Clinics
- 6.3.2. Research Institutes
- 6.1. Market Analysis, Insights and Forecast - by Type
- 7. North America PRP Industry Analysis, Insights and Forecast, 2020-2032
- 7.1. Market Analysis, Insights and Forecast - by Type
- 7.1.1. Pure PRP
- 7.1.2. Leukocyte-rich PRP
- 7.1.3. Leukocyte-rich Fibrin
- 7.1.4. Other Types
- 7.2. Market Analysis, Insights and Forecast - by Application
- 7.2.1. Orthopedics
- 7.2.2. Cosmetic Surgery and Dermatology
- 7.2.3. Neurology
- 7.2.4. Cardiology
- 7.2.5. Ophthalmology
- 7.2.6. Other Applications
- 7.3. Market Analysis, Insights and Forecast - by End User
- 7.3.1. Hospitals and Clinics
- 7.3.2. Research Institutes
- 7.1. Market Analysis, Insights and Forecast - by Type
- 8. Europe PRP Industry Analysis, Insights and Forecast, 2020-2032
- 8.1. Market Analysis, Insights and Forecast - by Type
- 8.1.1. Pure PRP
- 8.1.2. Leukocyte-rich PRP
- 8.1.3. Leukocyte-rich Fibrin
- 8.1.4. Other Types
- 8.2. Market Analysis, Insights and Forecast - by Application
- 8.2.1. Orthopedics
- 8.2.2. Cosmetic Surgery and Dermatology
- 8.2.3. Neurology
- 8.2.4. Cardiology
- 8.2.5. Ophthalmology
- 8.2.6. Other Applications
- 8.3. Market Analysis, Insights and Forecast - by End User
- 8.3.1. Hospitals and Clinics
- 8.3.2. Research Institutes
- 8.1. Market Analysis, Insights and Forecast - by Type
- 9. Asia Pacific PRP Industry Analysis, Insights and Forecast, 2020-2032
- 9.1. Market Analysis, Insights and Forecast - by Type
- 9.1.1. Pure PRP
- 9.1.2. Leukocyte-rich PRP
- 9.1.3. Leukocyte-rich Fibrin
- 9.1.4. Other Types
- 9.2. Market Analysis, Insights and Forecast - by Application
- 9.2.1. Orthopedics
- 9.2.2. Cosmetic Surgery and Dermatology
- 9.2.3. Neurology
- 9.2.4. Cardiology
- 9.2.5. Ophthalmology
- 9.2.6. Other Applications
- 9.3. Market Analysis, Insights and Forecast - by End User
- 9.3.1. Hospitals and Clinics
- 9.3.2. Research Institutes
- 9.1. Market Analysis, Insights and Forecast - by Type
- 10. Middle East PRP Industry Analysis, Insights and Forecast, 2020-2032
- 10.1. Market Analysis, Insights and Forecast - by Type
- 10.1.1. Pure PRP
- 10.1.2. Leukocyte-rich PRP
- 10.1.3. Leukocyte-rich Fibrin
- 10.1.4. Other Types
- 10.2. Market Analysis, Insights and Forecast - by Application
- 10.2.1. Orthopedics
- 10.2.2. Cosmetic Surgery and Dermatology
- 10.2.3. Neurology
- 10.2.4. Cardiology
- 10.2.5. Ophthalmology
- 10.2.6. Other Applications
- 10.3. Market Analysis, Insights and Forecast - by End User
- 10.3.1. Hospitals and Clinics
- 10.3.2. Research Institutes
- 10.1. Market Analysis, Insights and Forecast - by Type
- 11. GCC PRP Industry Analysis, Insights and Forecast, 2020-2032
- 11.1. Market Analysis, Insights and Forecast - by Type
- 11.1.1. Pure PRP
- 11.1.2. Leukocyte-rich PRP
- 11.1.3. Leukocyte-rich Fibrin
- 11.1.4. Other Types
- 11.2. Market Analysis, Insights and Forecast - by Application
- 11.2.1. Orthopedics
- 11.2.2. Cosmetic Surgery and Dermatology
- 11.2.3. Neurology
- 11.2.4. Cardiology
- 11.2.5. Ophthalmology
- 11.2.6. Other Applications
- 11.3. Market Analysis, Insights and Forecast - by End User
- 11.3.1. Hospitals and Clinics
- 11.3.2. Research Institutes
- 11.1. Market Analysis, Insights and Forecast - by Type
- 12. South America PRP Industry Analysis, Insights and Forecast, 2020-2032
- 12.1. Market Analysis, Insights and Forecast - by Type
- 12.1.1. Pure PRP
- 12.1.2. Leukocyte-rich PRP
- 12.1.3. Leukocyte-rich Fibrin
- 12.1.4. Other Types
- 12.2. Market Analysis, Insights and Forecast - by Application
- 12.2.1. Orthopedics
- 12.2.2. Cosmetic Surgery and Dermatology
- 12.2.3. Neurology
- 12.2.4. Cardiology
- 12.2.5. Ophthalmology
- 12.2.6. Other Applications
- 12.3. Market Analysis, Insights and Forecast - by End User
- 12.3.1. Hospitals and Clinics
- 12.3.2. Research Institutes
- 12.1. Market Analysis, Insights and Forecast - by Type
- 13. Competitive Analysis
- 13.1. Company Profiles
- 13.1.1 Terumo BCT Inc
- 13.1.1.1. Company Overview
- 13.1.1.2. Products
- 13.1.1.3. Company Financials
- 13.1.1.4. SWOT Analysis
- 13.1.2 ISTO Biologics
- 13.1.2.1. Company Overview
- 13.1.2.2. Products
- 13.1.2.3. Company Financials
- 13.1.2.4. SWOT Analysis
- 13.1.3 Arthrex Inc
- 13.1.3.1. Company Overview
- 13.1.3.2. Products
- 13.1.3.3. Company Financials
- 13.1.3.4. SWOT Analysis
- 13.1.4 Vertical Spine LLC
- 13.1.4.1. Company Overview
- 13.1.4.2. Products
- 13.1.4.3. Company Financials
- 13.1.4.4. SWOT Analysis
- 13.1.5 T-Biotechnology
- 13.1.5.1. Company Overview
- 13.1.5.2. Products
- 13.1.5.3. Company Financials
- 13.1.5.4. SWOT Analysis
- 13.1.6 DePuy Synthes
- 13.1.6.1. Company Overview
- 13.1.6.2. Products
- 13.1.6.3. Company Financials
- 13.1.6.4. SWOT Analysis
- 13.1.7 EmCyte Corporation
- 13.1.7.1. Company Overview
- 13.1.7.2. Products
- 13.1.7.3. Company Financials
- 13.1.7.4. SWOT Analysis
- 13.1.8 Isto Biologics
- 13.1.8.1. Company Overview
- 13.1.8.2. Products
- 13.1.8.3. Company Financials
- 13.1.8.4. SWOT Analysis
- 13.1.9 Harvest Technologies Corporation
- 13.1.9.1. Company Overview
- 13.1.9.2. Products
- 13.1.9.3. Company Financials
- 13.1.9.4. SWOT Analysis
- 13.1.10 Glofinn Oy
- 13.1.10.1. Company Overview
- 13.1.10.2. Products
- 13.1.10.3. Company Financials
- 13.1.10.4. SWOT Analysis
- 13.1.11 Zimmer Biomet
- 13.1.11.1. Company Overview
- 13.1.11.2. Products
- 13.1.11.3. Company Financials
- 13.1.11.4. SWOT Analysis
- 13.1.12 Dr PRP USA LLC
- 13.1.12.1. Company Overview
- 13.1.12.2. Products
- 13.1.12.3. Company Financials
- 13.1.12.4. SWOT Analysis
- 13.1.1 Terumo BCT Inc
- 13.2. Market Entropy
- 13.2.1 Company's Key Areas Served
- 13.2.2 Recent Developments
- 13.3. Company Market Share Analysis 2025
- 13.3.1 Top 5 Companies Market Share Analysis
- 13.3.2 Top 3 Companies Market Share Analysis
- 13.4. List of Potential Customers
- 14. Research Methodology
List of Figures
- Figure 1: Global PRP Industry Revenue Breakdown (Million, %) by Region 2025 & 2033
- Figure 2: Global PRP Industry Volume Breakdown (K Unit, %) by Region 2025 & 2033
- Figure 3: North America PRP Industry Revenue (Million), by Type 2025 & 2033
- Figure 4: North America PRP Industry Volume (K Unit), by Type 2025 & 2033
- Figure 5: North America PRP Industry Revenue Share (%), by Type 2025 & 2033
- Figure 6: North America PRP Industry Volume Share (%), by Type 2025 & 2033
- Figure 7: North America PRP Industry Revenue (Million), by Application 2025 & 2033
- Figure 8: North America PRP Industry Volume (K Unit), by Application 2025 & 2033
- Figure 9: North America PRP Industry Revenue Share (%), by Application 2025 & 2033
- Figure 10: North America PRP Industry Volume Share (%), by Application 2025 & 2033
- Figure 11: North America PRP Industry Revenue (Million), by End User 2025 & 2033
- Figure 12: North America PRP Industry Volume (K Unit), by End User 2025 & 2033
- Figure 13: North America PRP Industry Revenue Share (%), by End User 2025 & 2033
- Figure 14: North America PRP Industry Volume Share (%), by End User 2025 & 2033
- Figure 15: North America PRP Industry Revenue (Million), by Country 2025 & 2033
- Figure 16: North America PRP Industry Volume (K Unit), by Country 2025 & 2033
- Figure 17: North America PRP Industry Revenue Share (%), by Country 2025 & 2033
- Figure 18: North America PRP Industry Volume Share (%), by Country 2025 & 2033
- Figure 19: Europe PRP Industry Revenue (Million), by Type 2025 & 2033
- Figure 20: Europe PRP Industry Volume (K Unit), by Type 2025 & 2033
- Figure 21: Europe PRP Industry Revenue Share (%), by Type 2025 & 2033
- Figure 22: Europe PRP Industry Volume Share (%), by Type 2025 & 2033
- Figure 23: Europe PRP Industry Revenue (Million), by Application 2025 & 2033
- Figure 24: Europe PRP Industry Volume (K Unit), by Application 2025 & 2033
- Figure 25: Europe PRP Industry Revenue Share (%), by Application 2025 & 2033
- Figure 26: Europe PRP Industry Volume Share (%), by Application 2025 & 2033
- Figure 27: Europe PRP Industry Revenue (Million), by End User 2025 & 2033
- Figure 28: Europe PRP Industry Volume (K Unit), by End User 2025 & 2033
- Figure 29: Europe PRP Industry Revenue Share (%), by End User 2025 & 2033
- Figure 30: Europe PRP Industry Volume Share (%), by End User 2025 & 2033
- Figure 31: Europe PRP Industry Revenue (Million), by Country 2025 & 2033
- Figure 32: Europe PRP Industry Volume (K Unit), by Country 2025 & 2033
- Figure 33: Europe PRP Industry Revenue Share (%), by Country 2025 & 2033
- Figure 34: Europe PRP Industry Volume Share (%), by Country 2025 & 2033
- Figure 35: Asia Pacific PRP Industry Revenue (Million), by Type 2025 & 2033
- Figure 36: Asia Pacific PRP Industry Volume (K Unit), by Type 2025 & 2033
- Figure 37: Asia Pacific PRP Industry Revenue Share (%), by Type 2025 & 2033
- Figure 38: Asia Pacific PRP Industry Volume Share (%), by Type 2025 & 2033
- Figure 39: Asia Pacific PRP Industry Revenue (Million), by Application 2025 & 2033
- Figure 40: Asia Pacific PRP Industry Volume (K Unit), by Application 2025 & 2033
- Figure 41: Asia Pacific PRP Industry Revenue Share (%), by Application 2025 & 2033
- Figure 42: Asia Pacific PRP Industry Volume Share (%), by Application 2025 & 2033
- Figure 43: Asia Pacific PRP Industry Revenue (Million), by End User 2025 & 2033
- Figure 44: Asia Pacific PRP Industry Volume (K Unit), by End User 2025 & 2033
- Figure 45: Asia Pacific PRP Industry Revenue Share (%), by End User 2025 & 2033
- Figure 46: Asia Pacific PRP Industry Volume Share (%), by End User 2025 & 2033
- Figure 47: Asia Pacific PRP Industry Revenue (Million), by Country 2025 & 2033
- Figure 48: Asia Pacific PRP Industry Volume (K Unit), by Country 2025 & 2033
- Figure 49: Asia Pacific PRP Industry Revenue Share (%), by Country 2025 & 2033
- Figure 50: Asia Pacific PRP Industry Volume Share (%), by Country 2025 & 2033
- Figure 51: Middle East PRP Industry Revenue (Million), by Type 2025 & 2033
- Figure 52: Middle East PRP Industry Volume (K Unit), by Type 2025 & 2033
- Figure 53: Middle East PRP Industry Revenue Share (%), by Type 2025 & 2033
- Figure 54: Middle East PRP Industry Volume Share (%), by Type 2025 & 2033
- Figure 55: Middle East PRP Industry Revenue (Million), by Application 2025 & 2033
- Figure 56: Middle East PRP Industry Volume (K Unit), by Application 2025 & 2033
- Figure 57: Middle East PRP Industry Revenue Share (%), by Application 2025 & 2033
- Figure 58: Middle East PRP Industry Volume Share (%), by Application 2025 & 2033
- Figure 59: Middle East PRP Industry Revenue (Million), by End User 2025 & 2033
- Figure 60: Middle East PRP Industry Volume (K Unit), by End User 2025 & 2033
- Figure 61: Middle East PRP Industry Revenue Share (%), by End User 2025 & 2033
- Figure 62: Middle East PRP Industry Volume Share (%), by End User 2025 & 2033
- Figure 63: Middle East PRP Industry Revenue (Million), by Country 2025 & 2033
- Figure 64: Middle East PRP Industry Volume (K Unit), by Country 2025 & 2033
- Figure 65: Middle East PRP Industry Revenue Share (%), by Country 2025 & 2033
- Figure 66: Middle East PRP Industry Volume Share (%), by Country 2025 & 2033
- Figure 67: GCC PRP Industry Revenue (Million), by Type 2025 & 2033
- Figure 68: GCC PRP Industry Volume (K Unit), by Type 2025 & 2033
- Figure 69: GCC PRP Industry Revenue Share (%), by Type 2025 & 2033
- Figure 70: GCC PRP Industry Volume Share (%), by Type 2025 & 2033
- Figure 71: GCC PRP Industry Revenue (Million), by Application 2025 & 2033
- Figure 72: GCC PRP Industry Volume (K Unit), by Application 2025 & 2033
- Figure 73: GCC PRP Industry Revenue Share (%), by Application 2025 & 2033
- Figure 74: GCC PRP Industry Volume Share (%), by Application 2025 & 2033
- Figure 75: GCC PRP Industry Revenue (Million), by End User 2025 & 2033
- Figure 76: GCC PRP Industry Volume (K Unit), by End User 2025 & 2033
- Figure 77: GCC PRP Industry Revenue Share (%), by End User 2025 & 2033
- Figure 78: GCC PRP Industry Volume Share (%), by End User 2025 & 2033
- Figure 79: GCC PRP Industry Revenue (Million), by Country 2025 & 2033
- Figure 80: GCC PRP Industry Volume (K Unit), by Country 2025 & 2033
- Figure 81: GCC PRP Industry Revenue Share (%), by Country 2025 & 2033
- Figure 82: GCC PRP Industry Volume Share (%), by Country 2025 & 2033
- Figure 83: South America PRP Industry Revenue (Million), by Type 2025 & 2033
- Figure 84: South America PRP Industry Volume (K Unit), by Type 2025 & 2033
- Figure 85: South America PRP Industry Revenue Share (%), by Type 2025 & 2033
- Figure 86: South America PRP Industry Volume Share (%), by Type 2025 & 2033
- Figure 87: South America PRP Industry Revenue (Million), by Application 2025 & 2033
- Figure 88: South America PRP Industry Volume (K Unit), by Application 2025 & 2033
- Figure 89: South America PRP Industry Revenue Share (%), by Application 2025 & 2033
- Figure 90: South America PRP Industry Volume Share (%), by Application 2025 & 2033
- Figure 91: South America PRP Industry Revenue (Million), by End User 2025 & 2033
- Figure 92: South America PRP Industry Volume (K Unit), by End User 2025 & 2033
- Figure 93: South America PRP Industry Revenue Share (%), by End User 2025 & 2033
- Figure 94: South America PRP Industry Volume Share (%), by End User 2025 & 2033
- Figure 95: South America PRP Industry Revenue (Million), by Country 2025 & 2033
- Figure 96: South America PRP Industry Volume (K Unit), by Country 2025 & 2033
- Figure 97: South America PRP Industry Revenue Share (%), by Country 2025 & 2033
- Figure 98: South America PRP Industry Volume Share (%), by Country 2025 & 2033
List of Tables
- Table 1: Global PRP Industry Revenue Million Forecast, by Type 2020 & 2033
- Table 2: Global PRP Industry Volume K Unit Forecast, by Type 2020 & 2033
- Table 3: Global PRP Industry Revenue Million Forecast, by Application 2020 & 2033
- Table 4: Global PRP Industry Volume K Unit Forecast, by Application 2020 & 2033
- Table 5: Global PRP Industry Revenue Million Forecast, by End User 2020 & 2033
- Table 6: Global PRP Industry Volume K Unit Forecast, by End User 2020 & 2033
- Table 7: Global PRP Industry Revenue Million Forecast, by Region 2020 & 2033
- Table 8: Global PRP Industry Volume K Unit Forecast, by Region 2020 & 2033
- Table 9: Global PRP Industry Revenue Million Forecast, by Type 2020 & 2033
- Table 10: Global PRP Industry Volume K Unit Forecast, by Type 2020 & 2033
- Table 11: Global PRP Industry Revenue Million Forecast, by Application 2020 & 2033
- Table 12: Global PRP Industry Volume K Unit Forecast, by Application 2020 & 2033
- Table 13: Global PRP Industry Revenue Million Forecast, by End User 2020 & 2033
- Table 14: Global PRP Industry Volume K Unit Forecast, by End User 2020 & 2033
- Table 15: Global PRP Industry Revenue Million Forecast, by Country 2020 & 2033
- Table 16: Global PRP Industry Volume K Unit Forecast, by Country 2020 & 2033
- Table 17: United States PRP Industry Revenue (Million) Forecast, by Application 2020 & 2033
- Table 18: United States PRP Industry Volume (K Unit) Forecast, by Application 2020 & 2033
- Table 19: Canada PRP Industry Revenue (Million) Forecast, by Application 2020 & 2033
- Table 20: Canada PRP Industry Volume (K Unit) Forecast, by Application 2020 & 2033
- Table 21: Mexico PRP Industry Revenue (Million) Forecast, by Application 2020 & 2033
- Table 22: Mexico PRP Industry Volume (K Unit) Forecast, by Application 2020 & 2033
- Table 23: Global PRP Industry Revenue Million Forecast, by Type 2020 & 2033
- Table 24: Global PRP Industry Volume K Unit Forecast, by Type 2020 & 2033
- Table 25: Global PRP Industry Revenue Million Forecast, by Application 2020 & 2033
- Table 26: Global PRP Industry Volume K Unit Forecast, by Application 2020 & 2033
- Table 27: Global PRP Industry Revenue Million Forecast, by End User 2020 & 2033
- Table 28: Global PRP Industry Volume K Unit Forecast, by End User 2020 & 2033
- Table 29: Global PRP Industry Revenue Million Forecast, by Country 2020 & 2033
- Table 30: Global PRP Industry Volume K Unit Forecast, by Country 2020 & 2033
- Table 31: Germany PRP Industry Revenue (Million) Forecast, by Application 2020 & 2033
- Table 32: Germany PRP Industry Volume (K Unit) Forecast, by Application 2020 & 2033
- Table 33: United Kingdom PRP Industry Revenue (Million) Forecast, by Application 2020 & 2033
- Table 34: United Kingdom PRP Industry Volume (K Unit) Forecast, by Application 2020 & 2033
- Table 35: France PRP Industry Revenue (Million) Forecast, by Application 2020 & 2033
- Table 36: France PRP Industry Volume (K Unit) Forecast, by Application 2020 & 2033
- Table 37: Italy PRP Industry Revenue (Million) Forecast, by Application 2020 & 2033
- Table 38: Italy PRP Industry Volume (K Unit) Forecast, by Application 2020 & 2033
- Table 39: Spain PRP Industry Revenue (Million) Forecast, by Application 2020 & 2033
- Table 40: Spain PRP Industry Volume (K Unit) Forecast, by Application 2020 & 2033
- Table 41: Rest of Europe PRP Industry Revenue (Million) Forecast, by Application 2020 & 2033
- Table 42: Rest of Europe PRP Industry Volume (K Unit) Forecast, by Application 2020 & 2033
- Table 43: Global PRP Industry Revenue Million Forecast, by Type 2020 & 2033
- Table 44: Global PRP Industry Volume K Unit Forecast, by Type 2020 & 2033
- Table 45: Global PRP Industry Revenue Million Forecast, by Application 2020 & 2033
- Table 46: Global PRP Industry Volume K Unit Forecast, by Application 2020 & 2033
- Table 47: Global PRP Industry Revenue Million Forecast, by End User 2020 & 2033
- Table 48: Global PRP Industry Volume K Unit Forecast, by End User 2020 & 2033
- Table 49: Global PRP Industry Revenue Million Forecast, by Country 2020 & 2033
- Table 50: Global PRP Industry Volume K Unit Forecast, by Country 2020 & 2033
- Table 51: China PRP Industry Revenue (Million) Forecast, by Application 2020 & 2033
- Table 52: China PRP Industry Volume (K Unit) Forecast, by Application 2020 & 2033
- Table 53: Japan PRP Industry Revenue (Million) Forecast, by Application 2020 & 2033
- Table 54: Japan PRP Industry Volume (K Unit) Forecast, by Application 2020 & 2033
- Table 55: India PRP Industry Revenue (Million) Forecast, by Application 2020 & 2033
- Table 56: India PRP Industry Volume (K Unit) Forecast, by Application 2020 & 2033
- Table 57: Australia PRP Industry Revenue (Million) Forecast, by Application 2020 & 2033
- Table 58: Australia PRP Industry Volume (K Unit) Forecast, by Application 2020 & 2033
- Table 59: South Korea PRP Industry Revenue (Million) Forecast, by Application 2020 & 2033
- Table 60: South Korea PRP Industry Volume (K Unit) Forecast, by Application 2020 & 2033
- Table 61: Rest of Asia Pacific PRP Industry Revenue (Million) Forecast, by Application 2020 & 2033
- Table 62: Rest of Asia Pacific PRP Industry Volume (K Unit) Forecast, by Application 2020 & 2033
- Table 63: Global PRP Industry Revenue Million Forecast, by Type 2020 & 2033
- Table 64: Global PRP Industry Volume K Unit Forecast, by Type 2020 & 2033
- Table 65: Global PRP Industry Revenue Million Forecast, by Application 2020 & 2033
- Table 66: Global PRP Industry Volume K Unit Forecast, by Application 2020 & 2033
- Table 67: Global PRP Industry Revenue Million Forecast, by End User 2020 & 2033
- Table 68: Global PRP Industry Volume K Unit Forecast, by End User 2020 & 2033
- Table 69: Global PRP Industry Revenue Million Forecast, by Country 2020 & 2033
- Table 70: Global PRP Industry Volume K Unit Forecast, by Country 2020 & 2033
- Table 71: Global PRP Industry Revenue Million Forecast, by Type 2020 & 2033
- Table 72: Global PRP Industry Volume K Unit Forecast, by Type 2020 & 2033
- Table 73: Global PRP Industry Revenue Million Forecast, by Application 2020 & 2033
- Table 74: Global PRP Industry Volume K Unit Forecast, by Application 2020 & 2033
- Table 75: Global PRP Industry Revenue Million Forecast, by End User 2020 & 2033
- Table 76: Global PRP Industry Volume K Unit Forecast, by End User 2020 & 2033
- Table 77: Global PRP Industry Revenue Million Forecast, by Country 2020 & 2033
- Table 78: Global PRP Industry Volume K Unit Forecast, by Country 2020 & 2033
- Table 79: South Africa PRP Industry Revenue (Million) Forecast, by Application 2020 & 2033
- Table 80: South Africa PRP Industry Volume (K Unit) Forecast, by Application 2020 & 2033
- Table 81: Rest of Middle East PRP Industry Revenue (Million) Forecast, by Application 2020 & 2033
- Table 82: Rest of Middle East PRP Industry Volume (K Unit) Forecast, by Application 2020 & 2033
- Table 83: Global PRP Industry Revenue Million Forecast, by Type 2020 & 2033
- Table 84: Global PRP Industry Volume K Unit Forecast, by Type 2020 & 2033
- Table 85: Global PRP Industry Revenue Million Forecast, by Application 2020 & 2033
- Table 86: Global PRP Industry Volume K Unit Forecast, by Application 2020 & 2033
- Table 87: Global PRP Industry Revenue Million Forecast, by End User 2020 & 2033
- Table 88: Global PRP Industry Volume K Unit Forecast, by End User 2020 & 2033
- Table 89: Global PRP Industry Revenue Million Forecast, by Country 2020 & 2033
- Table 90: Global PRP Industry Volume K Unit Forecast, by Country 2020 & 2033
- Table 91: Brazil PRP Industry Revenue (Million) Forecast, by Application 2020 & 2033
- Table 92: Brazil PRP Industry Volume (K Unit) Forecast, by Application 2020 & 2033
- Table 93: Argentina PRP Industry Revenue (Million) Forecast, by Application 2020 & 2033
- Table 94: Argentina PRP Industry Volume (K Unit) Forecast, by Application 2020 & 2033
- Table 95: Rest of South America PRP Industry Revenue (Million) Forecast, by Application 2020 & 2033
- Table 96: Rest of South America PRP Industry Volume (K Unit) Forecast, by Application 2020 & 2033
Frequently Asked Questions
1. What is the projected Compound Annual Growth Rate (CAGR) of the PRP Industry?
The projected CAGR is approximately 9.03%.
2. Which companies are prominent players in the PRP Industry?
Key companies in the market include Terumo BCT Inc, ISTO Biologics, Arthrex Inc, Vertical Spine LLC, T-Biotechnology, DePuy Synthes, EmCyte Corporation, Isto Biologics, Harvest Technologies Corporation, Glofinn Oy, Zimmer Biomet, Dr PRP USA LLC.
3. What are the main segments of the PRP Industry?
The market segments include Type, Application, End User.
4. Can you provide details about the market size?
The market size is estimated to be USD 410.75 Million as of 2022.
5. What are some drivers contributing to market growth?
Rising Incidences of Sports Injuries; Increasing Number of Cosmetic and Surgical Procedures; Growing use of Platelet-rich Plasma in Various Therapeutic Areas.
6. What are the notable trends driving market growth?
The Orthopedics Segment is Expected to Hold the Largest Market Share.
7. Are there any restraints impacting market growth?
Stringent Regulatory Policies; High Prices of Plasma Therapy.
8. Can you provide examples of recent developments in the market?
In February 2021, Atlas Health Medical Group announced PRP (Platelet-rich Plasma) Microneedling Facelifts for patients.
9. What pricing options are available for accessing the report?
Pricing options include single-user, multi-user, and enterprise licenses priced at USD 4750, USD 5250, and USD 8750 respectively.
10. Is the market size provided in terms of value or volume?
The market size is provided in terms of value, measured in Million and volume, measured in K Unit.
11. Are there any specific market keywords associated with the report?
Yes, the market keyword associated with the report is "PRP Industry," which aids in identifying and referencing the specific market segment covered.
12. How do I determine which pricing option suits my needs best?
The pricing options vary based on user requirements and access needs. Individual users may opt for single-user licenses, while businesses requiring broader access may choose multi-user or enterprise licenses for cost-effective access to the report.
13. Are there any additional resources or data provided in the PRP Industry report?
While the report offers comprehensive insights, it's advisable to review the specific contents or supplementary materials provided to ascertain if additional resources or data are available.
14. How can I stay updated on further developments or reports in the PRP Industry?
To stay informed about further developments, trends, and reports in the PRP Industry, consider subscribing to industry newsletters, following relevant companies and organizations, or regularly checking reputable industry news sources and publications.
Methodology
Step 1 - Identification of Relevant Samples Size from Population Database


Step 2 - Approaches for Defining Global Market Size (Value, Volume* & Price*)

Note*: In applicable scenarios
Step 3 - Data Sources
Primary Research
- Web Analytics
- Survey Reports
- Research Institute
- Latest Research Reports
- Opinion Leaders
Secondary Research
- Annual Reports
- White Paper
- Latest Press Release
- Industry Association
- Paid Database
- Investor Presentations

Step 4 - Data Triangulation
Involves using different sources of information in order to increase the validity of a study
These sources are likely to be stakeholders in a program - participants, other researchers, program staff, other community members, and so on.
Then we put all data in single framework & apply various statistical tools to find out the dynamic on the market.
During the analysis stage, feedback from the stakeholder groups would be compared to determine areas of agreement as well as areas of divergence