

Key Insights
The Asia-Pacific (APAC) soy protein animal feed industry is experiencing robust growth, driven by increasing demand for animal protein, rising consumer awareness of sustainable and healthy food options, and the incorporation of soy protein as a cost-effective and nutritious ingredient in animal feed formulations. The region's burgeoning livestock population, particularly in countries like China, India, and Vietnam, fuels this expansion. Furthermore, the industry benefits from technological advancements in soy protein processing, leading to improved protein quality and digestibility, enhanced palatability for animals, and reduced environmental impact compared to traditional feed sources. The shift towards sustainable and responsible sourcing of animal feed ingredients further bolsters market growth. While challenges such as fluctuating soy prices and potential supply chain disruptions exist, the long-term outlook remains positive, projected to maintain a steady Compound Annual Growth Rate (CAGR). Specific segments within the APAC market demonstrate varying growth trajectories. For example, the demand for soy protein concentrates in animal feed is likely outpacing that of isolates, given their cost-effectiveness. Similarly, specific countries within the APAC region exhibit varying levels of adoption based on economic factors, livestock farming practices, and government regulations.
Growth within the APAC soy protein animal feed market is segmented across key countries, including Australia, China, India, Indonesia, Japan, Malaysia, New Zealand, South Korea, Thailand, and Vietnam, with variations in consumption and market share driven by factors such as livestock populations, economic development, and consumer preferences. The preference for specific soy protein forms—concentrates, isolates, and textured/hydrolyzed—also impacts market segmentation. Concentrates often dominate due to their cost-competitiveness. The end-user segment, primarily focused on animal feed, is the largest contributor to overall market size. However, emerging trends in the food and beverage industry, particularly in the production of plant-based meat alternatives, and the growing sport/performance nutrition market present significant growth opportunities for soy protein producers. This leads to increased competition among established players like CHS Inc, Shandong Yuwang Industrial Co Ltd, International Flavors & Fragrances Inc, Wilmar International Ltd, Archer Daniels Midland Company, Bunge Limited, Fuji Oil Group, Kerry Group PLC, Foodchem International Corporation, and Cargill Incorporated, who are constantly innovating and expanding their product portfolios to meet these diverse demands.
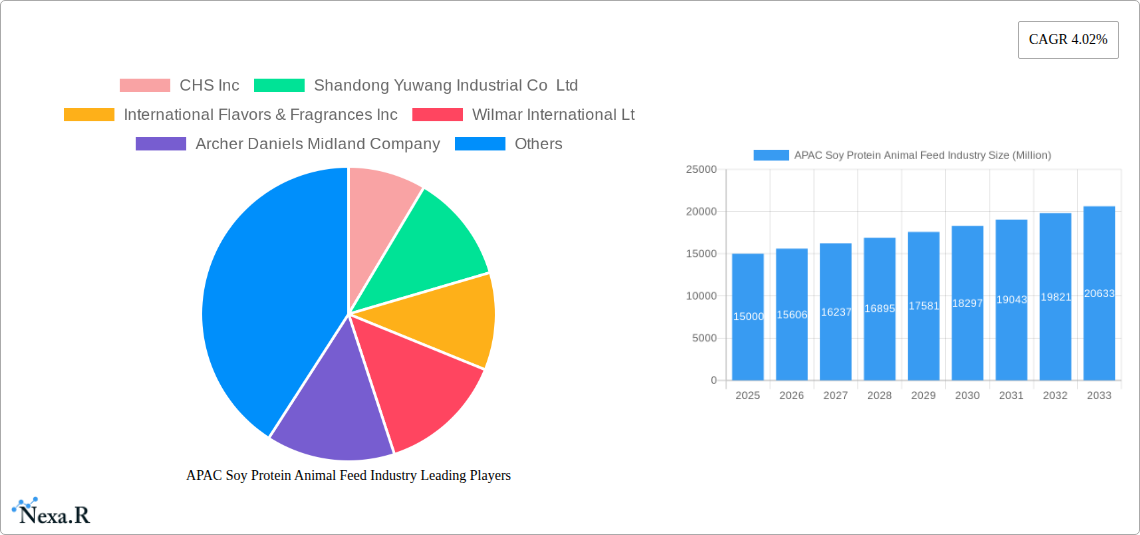
APAC Soy Protein Animal Feed Industry: Market Report 2019-2033
This comprehensive report provides an in-depth analysis of the Asia-Pacific (APAC) soy protein animal feed industry, encompassing market size, growth trends, competitive landscape, and future outlook. The study period covers 2019-2033, with a focus on 2025 as the base and estimated year. The report segments the market by country (Australia, China, India, Indonesia, Japan, Malaysia, New Zealand, South Korea, Thailand, Vietnam, and Rest of Asia-Pacific), form (concentrates, isolates, textured/hydrolyzed), and end-user (animal feed, food and beverages, sport/performance nutrition). Key players analyzed include CHS Inc, Shandong Yuwang Industrial Co Ltd, International Flavors & Fragrances Inc, Wilmar International Ltd, Archer Daniels Midland Company, Bunge Limited, Fuji Oil Group, Kerry Group PLC, Foodchem International Corporation, and Cargill Incorporated. The report offers invaluable insights for industry professionals, investors, and strategic decision-makers. This report is ready for immediate use; no further modifications are required.
APAC Soy Protein Animal Feed Industry Market Dynamics & Structure
The APAC soy protein animal feed market is characterized by moderate concentration, with a few large multinational corporations and several regional players dominating the landscape. Technological innovation, particularly in soy protein processing and formulation, is a key driver, alongside increasing demand for sustainable and high-protein animal feed. Regulatory frameworks concerning food safety and labeling significantly influence market dynamics. Competitive substitutes, such as other plant-based proteins (e.g., pea protein), exert pressure on market share. End-user demographics, specifically the growing livestock population and changing consumer preferences for animal products, shape market demand. M&A activity remains moderate, with a xx number of deals recorded between 2019 and 2024, representing a xx% market share shift in the last five years.
- Market Concentration: Moderately concentrated, with top 10 players holding xx% market share in 2024.
- Technological Innovation: Driven by efficiency improvements in soy protein extraction and functional properties enhancement.
- Regulatory Landscape: Stringent food safety and labeling regulations impacting product development and market access.
- Competitive Substitutes: Plant-based protein alternatives like pea and canola proteins pose a moderate competitive threat.
- M&A Activity: xx deals recorded between 2019 and 2024, resulting in xx% market share shift.
- Innovation Barriers: High R&D costs and regulatory hurdles hinder innovation in soy protein technology.
APAC Soy Protein Animal Feed Industry Growth Trends & Insights
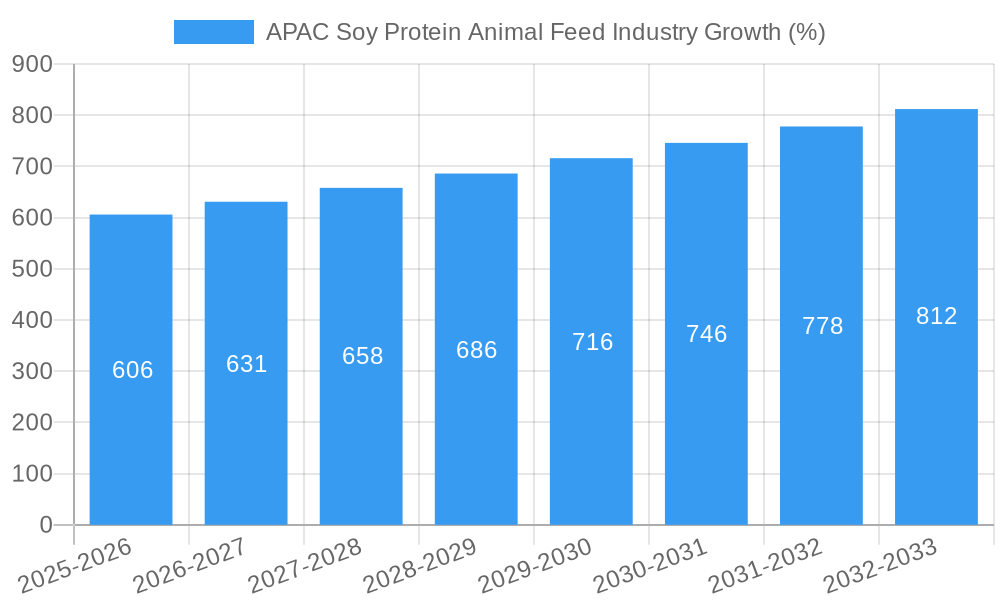
The APAC soy protein animal feed market experienced robust growth during the historical period (2019-2024), with a CAGR of xx%. This growth is attributed to rising livestock populations, increasing demand for animal protein, and growing awareness of the nutritional benefits of soy protein in animal feed. Market penetration of soy protein in animal feed is currently at xx% and is projected to reach xx% by 2033. Technological disruptions, such as advancements in protein extraction and formulation technologies, further fueled market expansion. Shifting consumer preferences towards healthier and more sustainable food choices also play a role, driving demand for animal products with enhanced nutritional profiles achieved through soy protein inclusion. Furthermore, increasing disposable incomes across several APAC countries further bolstered demand. The forecast period (2025-2033) anticipates continued growth, driven by factors discussed above, projecting a CAGR of xx%.
Dominant Regions, Countries, or Segments in APAC Soy Protein Animal Feed Industry
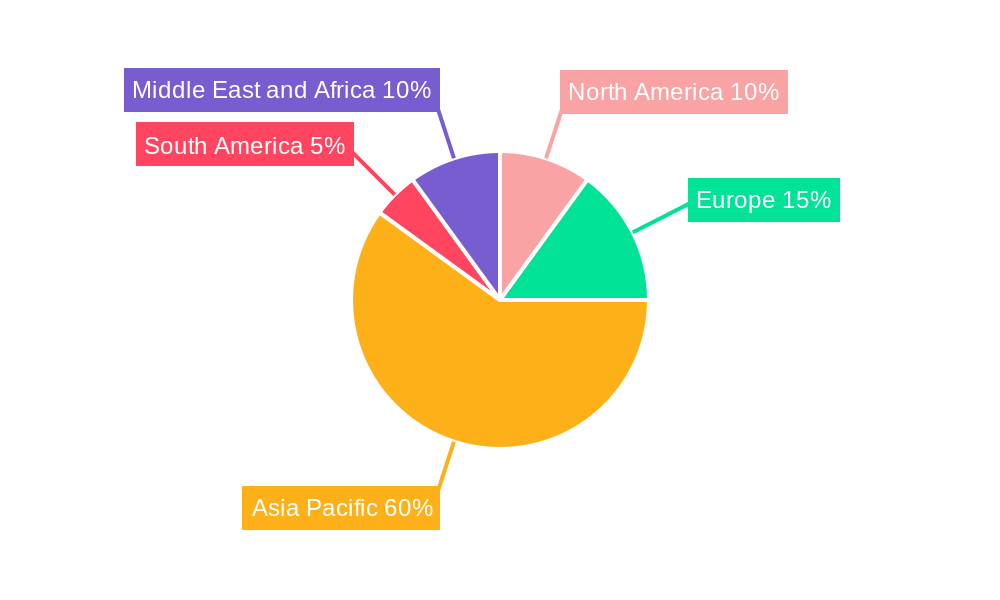
China dominates the APAC soy protein animal feed market, accounting for xx% of the total market value in 2024, followed by India (xx%) and Indonesia (xx%). This dominance is attributed to several factors: large livestock populations, expanding animal feed industries, and supportive government policies promoting livestock farming. The animal feed segment is by far the largest end-use sector, representing xx% of total soy protein consumption. Within forms, soy protein concentrates hold the largest market share (xx%), followed by isolates (xx%) and textured/hydrolyzed (xx%).
- China: Large livestock population, robust animal feed industry, and supportive government policies.
- India: Growing demand for animal protein, increasing livestock production, and rising consumer incomes.
- Indonesia: Significant poultry and aquaculture industries driving demand for soy protein in animal feed.
- Animal Feed Segment: The dominant end-use sector due to high protein requirements in animal diets.
- Soy Protein Concentrates: The largest form segment due to cost-effectiveness and wide applications.
APAP Soy Protein Animal Feed Industry Product Landscape
The APAC soy protein animal feed market offers a diverse range of products, encompassing concentrates, isolates, and textured/hydrolyzed forms, each tailored to specific animal feed applications and nutritional requirements. Recent innovations focus on enhancing protein digestibility, improving functional properties, and developing sustainable production methods. Key product differentiators include improved amino acid profiles, enhanced solubility, and tailored textures to optimize feed palatability and animal performance. Technological advancements in protein extraction and processing have led to higher-quality soy protein products with increased nutritional value.
Key Drivers, Barriers & Challenges in APAC Soy Protein Animal Feed Industry
Key Drivers: The market is primarily driven by the growing demand for animal protein, rising livestock populations, increasing disposable incomes, supportive government policies promoting livestock farming in several APAC countries, and the nutritional benefits of soy protein in animal feed. Technological advancements in soy protein processing enhance its efficiency and efficacy.
Key Barriers and Challenges: Fluctuations in raw material prices (soybeans) pose a significant challenge, along with potential supply chain disruptions. Stringent regulatory requirements for food safety and labeling increase compliance costs. Intense competition from other plant-based protein sources puts pressure on prices and market share. Furthermore, consumer concerns regarding genetically modified organisms (GMOs) and sustainability impact market acceptance in some segments.
Emerging Opportunities in APAC Soy Protein Animal Feed Industry
Emerging opportunities include the growing demand for organic and non-GMO soy protein, increasing adoption of functional soy protein ingredients with enhanced properties (e.g., improved digestibility), and rising interest in sustainable and traceable soy protein sourcing. Expanding into untapped markets in Southeast Asia with high livestock growth potential represents a significant opportunity. Developing customized soy protein blends for specific animal species (e.g., poultry, swine, aquaculture) offers further growth potential.
Growth Accelerators in the APAC Soy Protein Animal Feed Industry
Long-term growth is fueled by technological breakthroughs, particularly in the development of novel soy protein processing techniques and formulation innovations that enhance animal feed efficiency and nutritional value. Strategic partnerships between soy protein producers and animal feed manufacturers promote product development and market penetration. Expansion into new markets and increasing consumer awareness of the nutritional benefits of soy protein in animal feed contribute significantly to sustained growth. Government initiatives supporting sustainable agricultural practices further accelerate market expansion.
Key Players Shaping the APAC Soy Protein Animal Feed Industry Market
- CHS Inc
- Shandong Yuwang Industrial Co Ltd
- International Flavors & Fragrances Inc
- Wilmar International Ltd
- Archer Daniels Midland Company
- Bunge Limited
- Fuji Oil Group
- Kerry Group PLC
- Foodchem International Corporation
- Cargill Incorporated
Notable Milestones in APAC Soy Protein Animal Feed Industry Sector
January 2019: Fuji Oil Holdings Inc. constructed a new soy processing plant in Chiba, Japan, boosting production capacity by 9,000 tons per year. This expansion signaled a significant investment in the APAC soy protein market and strengthened Fuji Oil's position within the region.
March 2019: DuPont launched SUPRO soy-based protein nuggets, expanding its plant protein offerings and catering to the growing demand for high-protein animal feed ingredients. This product launch showcased innovation in soy protein formulation.
July 2020: DuPont Nutrition & Biosciences (IFF subsidiary) launched the Danisco Planit range, offering a comprehensive portfolio of plant-based ingredients, including soy proteins, for food and beverage applications, indirectly benefiting the animal feed sector by supporting the overall plant protein industry.
In-Depth APAC Soy Protein Animal Feed Industry Market Outlook
The APAC soy protein animal feed market exhibits robust growth potential, driven by sustained demand for animal protein, technological advancements, and favorable government policies. Strategic opportunities lie in developing innovative soy protein products tailored to specific animal feed applications, expanding into high-growth markets, and forging strategic partnerships to enhance supply chain efficiency and sustainability. The market’s long-term outlook remains positive, supported by the continued expansion of the livestock sector and growing consumer preference for high-quality, sustainably sourced animal products.
APAC Soy Protein Animal Feed Industry Segmentation
-
1. Form
- 1.1. Concentrates
- 1.2. Isolates
- 1.3. Textured/Hydrolyzed
-
2. End User
- 2.1. Animal Feed
-
2.2. Food and Beverages
-
2.2.1. By Sub End User
- 2.2.1.1. Bakery
- 2.2.1.2. Breakfast Cereals
- 2.2.1.3. Condiments/Sauces
- 2.2.1.4. Dairy and Dairy Alternative Products
- 2.2.1.5. Meat/Poultry/Seafood and Meat Alternative Products
- 2.2.1.6. RTE/RTC Food Products
- 2.2.1.7. Snacks
-
2.2.1. By Sub End User
- 2.3. Personal Care and Cosmetics
-
2.4. Supplements
- 2.4.1. Baby Food and Infant Formula
- 2.4.2. Elderly Nutrition and Medical Nutrition
- 2.4.3. Sport/Performance Nutrition
APAC Soy Protein Animal Feed Industry Segmentation By Geography
-
1. North America
- 1.1. United States
- 1.2. Canada
- 1.3. Mexico
-
2. South America
- 2.1. Brazil
- 2.2. Argentina
- 2.3. Rest of South America
-
3. Europe
- 3.1. United Kingdom
- 3.2. Germany
- 3.3. France
- 3.4. Italy
- 3.5. Spain
- 3.6. Russia
- 3.7. Benelux
- 3.8. Nordics
- 3.9. Rest of Europe
-
4. Middle East & Africa
- 4.1. Turkey
- 4.2. Israel
- 4.3. GCC
- 4.4. North Africa
- 4.5. South Africa
- 4.6. Rest of Middle East & Africa
-
5. Asia Pacific
- 5.1. China
- 5.2. India
- 5.3. Japan
- 5.4. South Korea
- 5.5. ASEAN
- 5.6. Oceania
- 5.7. Rest of Asia Pacific
APAC Soy Protein Animal Feed Industry REPORT HIGHLIGHTS
| Aspects | Details |
|---|---|
| Study Period | 2019-2033 |
| Base Year | 2024 |
| Estimated Year | 2025 |
| Forecast Period | 2025-2033 |
| Historical Period | 2019-2024 |
| Growth Rate | CAGR of 4.02% from 2019-2033 |
| Segmentation |
|
Table of Contents
- 1. Introduction
- 1.1. Research Scope
- 1.2. Market Segmentation
- 1.3. Research Methodology
- 1.4. Definitions and Assumptions
- 2. Executive Summary
- 2.1. Introduction
- 3. Market Dynamics
- 3.1. Introduction
- 3.2. Market Drivers
- 3.2.1. Increasing awareness towards fitness among consumers; Demand for convenient fortified foods
- 3.3. Market Restrains
- 3.3.1. Prevalence of allergen intolerance among the consumers
- 3.4. Market Trends
- 3.4.1. OTHER KEY INDUSTRY TRENDS COVERED IN THE REPORT
- 4. Market Factor Analysis
- 4.1. Porters Five Forces
- 4.2. Supply/Value Chain
- 4.3. PESTEL analysis
- 4.4. Market Entropy
- 4.5. Patent/Trademark Analysis
- 5. Global APAC Soy Protein Animal Feed Industry Analysis, Insights and Forecast, 2019-2031
- 5.1. Market Analysis, Insights and Forecast - by Form
- 5.1.1. Concentrates
- 5.1.2. Isolates
- 5.1.3. Textured/Hydrolyzed
- 5.2. Market Analysis, Insights and Forecast - by End User
- 5.2.1. Animal Feed
- 5.2.2. Food and Beverages
- 5.2.2.1. By Sub End User
- 5.2.2.1.1. Bakery
- 5.2.2.1.2. Breakfast Cereals
- 5.2.2.1.3. Condiments/Sauces
- 5.2.2.1.4. Dairy and Dairy Alternative Products
- 5.2.2.1.5. Meat/Poultry/Seafood and Meat Alternative Products
- 5.2.2.1.6. RTE/RTC Food Products
- 5.2.2.1.7. Snacks
- 5.2.2.1. By Sub End User
- 5.2.3. Personal Care and Cosmetics
- 5.2.4. Supplements
- 5.2.4.1. Baby Food and Infant Formula
- 5.2.4.2. Elderly Nutrition and Medical Nutrition
- 5.2.4.3. Sport/Performance Nutrition
- 5.3. Market Analysis, Insights and Forecast - by Region
- 5.3.1. North America
- 5.3.2. South America
- 5.3.3. Europe
- 5.3.4. Middle East & Africa
- 5.3.5. Asia Pacific
- 5.1. Market Analysis, Insights and Forecast - by Form
- 6. North America APAC Soy Protein Animal Feed Industry Analysis, Insights and Forecast, 2019-2031
- 6.1. Market Analysis, Insights and Forecast - by Form
- 6.1.1. Concentrates
- 6.1.2. Isolates
- 6.1.3. Textured/Hydrolyzed
- 6.2. Market Analysis, Insights and Forecast - by End User
- 6.2.1. Animal Feed
- 6.2.2. Food and Beverages
- 6.2.2.1. By Sub End User
- 6.2.2.1.1. Bakery
- 6.2.2.1.2. Breakfast Cereals
- 6.2.2.1.3. Condiments/Sauces
- 6.2.2.1.4. Dairy and Dairy Alternative Products
- 6.2.2.1.5. Meat/Poultry/Seafood and Meat Alternative Products
- 6.2.2.1.6. RTE/RTC Food Products
- 6.2.2.1.7. Snacks
- 6.2.2.1. By Sub End User
- 6.2.3. Personal Care and Cosmetics
- 6.2.4. Supplements
- 6.2.4.1. Baby Food and Infant Formula
- 6.2.4.2. Elderly Nutrition and Medical Nutrition
- 6.2.4.3. Sport/Performance Nutrition
- 6.1. Market Analysis, Insights and Forecast - by Form
- 7. South America APAC Soy Protein Animal Feed Industry Analysis, Insights and Forecast, 2019-2031
- 7.1. Market Analysis, Insights and Forecast - by Form
- 7.1.1. Concentrates
- 7.1.2. Isolates
- 7.1.3. Textured/Hydrolyzed
- 7.2. Market Analysis, Insights and Forecast - by End User
- 7.2.1. Animal Feed
- 7.2.2. Food and Beverages
- 7.2.2.1. By Sub End User
- 7.2.2.1.1. Bakery
- 7.2.2.1.2. Breakfast Cereals
- 7.2.2.1.3. Condiments/Sauces
- 7.2.2.1.4. Dairy and Dairy Alternative Products
- 7.2.2.1.5. Meat/Poultry/Seafood and Meat Alternative Products
- 7.2.2.1.6. RTE/RTC Food Products
- 7.2.2.1.7. Snacks
- 7.2.2.1. By Sub End User
- 7.2.3. Personal Care and Cosmetics
- 7.2.4. Supplements
- 7.2.4.1. Baby Food and Infant Formula
- 7.2.4.2. Elderly Nutrition and Medical Nutrition
- 7.2.4.3. Sport/Performance Nutrition
- 7.1. Market Analysis, Insights and Forecast - by Form
- 8. Europe APAC Soy Protein Animal Feed Industry Analysis, Insights and Forecast, 2019-2031
- 8.1. Market Analysis, Insights and Forecast - by Form
- 8.1.1. Concentrates
- 8.1.2. Isolates
- 8.1.3. Textured/Hydrolyzed
- 8.2. Market Analysis, Insights and Forecast - by End User
- 8.2.1. Animal Feed
- 8.2.2. Food and Beverages
- 8.2.2.1. By Sub End User
- 8.2.2.1.1. Bakery
- 8.2.2.1.2. Breakfast Cereals
- 8.2.2.1.3. Condiments/Sauces
- 8.2.2.1.4. Dairy and Dairy Alternative Products
- 8.2.2.1.5. Meat/Poultry/Seafood and Meat Alternative Products
- 8.2.2.1.6. RTE/RTC Food Products
- 8.2.2.1.7. Snacks
- 8.2.2.1. By Sub End User
- 8.2.3. Personal Care and Cosmetics
- 8.2.4. Supplements
- 8.2.4.1. Baby Food and Infant Formula
- 8.2.4.2. Elderly Nutrition and Medical Nutrition
- 8.2.4.3. Sport/Performance Nutrition
- 8.1. Market Analysis, Insights and Forecast - by Form
- 9. Middle East & Africa APAC Soy Protein Animal Feed Industry Analysis, Insights and Forecast, 2019-2031
- 9.1. Market Analysis, Insights and Forecast - by Form
- 9.1.1. Concentrates
- 9.1.2. Isolates
- 9.1.3. Textured/Hydrolyzed
- 9.2. Market Analysis, Insights and Forecast - by End User
- 9.2.1. Animal Feed
- 9.2.2. Food and Beverages
- 9.2.2.1. By Sub End User
- 9.2.2.1.1. Bakery
- 9.2.2.1.2. Breakfast Cereals
- 9.2.2.1.3. Condiments/Sauces
- 9.2.2.1.4. Dairy and Dairy Alternative Products
- 9.2.2.1.5. Meat/Poultry/Seafood and Meat Alternative Products
- 9.2.2.1.6. RTE/RTC Food Products
- 9.2.2.1.7. Snacks
- 9.2.2.1. By Sub End User
- 9.2.3. Personal Care and Cosmetics
- 9.2.4. Supplements
- 9.2.4.1. Baby Food and Infant Formula
- 9.2.4.2. Elderly Nutrition and Medical Nutrition
- 9.2.4.3. Sport/Performance Nutrition
- 9.1. Market Analysis, Insights and Forecast - by Form
- 10. Asia Pacific APAC Soy Protein Animal Feed Industry Analysis, Insights and Forecast, 2019-2031
- 10.1. Market Analysis, Insights and Forecast - by Form
- 10.1.1. Concentrates
- 10.1.2. Isolates
- 10.1.3. Textured/Hydrolyzed
- 10.2. Market Analysis, Insights and Forecast - by End User
- 10.2.1. Animal Feed
- 10.2.2. Food and Beverages
- 10.2.2.1. By Sub End User
- 10.2.2.1.1. Bakery
- 10.2.2.1.2. Breakfast Cereals
- 10.2.2.1.3. Condiments/Sauces
- 10.2.2.1.4. Dairy and Dairy Alternative Products
- 10.2.2.1.5. Meat/Poultry/Seafood and Meat Alternative Products
- 10.2.2.1.6. RTE/RTC Food Products
- 10.2.2.1.7. Snacks
- 10.2.2.1. By Sub End User
- 10.2.3. Personal Care and Cosmetics
- 10.2.4. Supplements
- 10.2.4.1. Baby Food and Infant Formula
- 10.2.4.2. Elderly Nutrition and Medical Nutrition
- 10.2.4.3. Sport/Performance Nutrition
- 10.1. Market Analysis, Insights and Forecast - by Form
- 11. North America APAC Soy Protein Animal Feed Industry Analysis, Insights and Forecast, 2019-2031
- 11.1. Market Analysis, Insights and Forecast - By Country/Sub-region
- 11.1.1 United States
- 11.1.2 Canada
- 11.1.3 Mexico
- 11.1.4 Rest of North America
- 12. Europe APAC Soy Protein Animal Feed Industry Analysis, Insights and Forecast, 2019-2031
- 12.1. Market Analysis, Insights and Forecast - By Country/Sub-region
- 12.1.1 Germany
- 12.1.2 United Kingdom
- 12.1.3 France
- 12.1.4 Russia
- 12.1.5 Spain
- 12.1.6 Italy
- 12.1.7 Rest of Europe
- 13. Asia Pacific APAC Soy Protein Animal Feed Industry Analysis, Insights and Forecast, 2019-2031
- 13.1. Market Analysis, Insights and Forecast - By Country/Sub-region
- 13.1.1 China
- 13.1.2 Japan
- 13.1.3 India
- 13.1.4 Australia
- 13.1.5 Rest of Asia Pacific
- 14. South America APAC Soy Protein Animal Feed Industry Analysis, Insights and Forecast, 2019-2031
- 14.1. Market Analysis, Insights and Forecast - By Country/Sub-region
- 14.1.1 Brazil
- 14.1.2 Argentina
- 14.1.3 Rest of South America
- 15. Middle East and Africa APAC Soy Protein Animal Feed Industry Analysis, Insights and Forecast, 2019-2031
- 15.1. Market Analysis, Insights and Forecast - By Country/Sub-region
- 15.1.1 United Arab Emirates
- 15.1.2 South Africa
- 15.1.3 Rest of Middle East and Africa
- 16. Competitive Analysis
- 16.1. Global Market Share Analysis 2024
- 16.2. Company Profiles
- 16.2.1 CHS Inc
- 16.2.1.1. Overview
- 16.2.1.2. Products
- 16.2.1.3. SWOT Analysis
- 16.2.1.4. Recent Developments
- 16.2.1.5. Financials (Based on Availability)
- 16.2.2 Shandong Yuwang Industrial Co Ltd
- 16.2.2.1. Overview
- 16.2.2.2. Products
- 16.2.2.3. SWOT Analysis
- 16.2.2.4. Recent Developments
- 16.2.2.5. Financials (Based on Availability)
- 16.2.3 International Flavors & Fragrances Inc
- 16.2.3.1. Overview
- 16.2.3.2. Products
- 16.2.3.3. SWOT Analysis
- 16.2.3.4. Recent Developments
- 16.2.3.5. Financials (Based on Availability)
- 16.2.4 Wilmar International Lt
- 16.2.4.1. Overview
- 16.2.4.2. Products
- 16.2.4.3. SWOT Analysis
- 16.2.4.4. Recent Developments
- 16.2.4.5. Financials (Based on Availability)
- 16.2.5 Archer Daniels Midland Company
- 16.2.5.1. Overview
- 16.2.5.2. Products
- 16.2.5.3. SWOT Analysis
- 16.2.5.4. Recent Developments
- 16.2.5.5. Financials (Based on Availability)
- 16.2.6 Bunge Limited
- 16.2.6.1. Overview
- 16.2.6.2. Products
- 16.2.6.3. SWOT Analysis
- 16.2.6.4. Recent Developments
- 16.2.6.5. Financials (Based on Availability)
- 16.2.7 Fuji Oil Group
- 16.2.7.1. Overview
- 16.2.7.2. Products
- 16.2.7.3. SWOT Analysis
- 16.2.7.4. Recent Developments
- 16.2.7.5. Financials (Based on Availability)
- 16.2.8 Kerry Group PLC
- 16.2.8.1. Overview
- 16.2.8.2. Products
- 16.2.8.3. SWOT Analysis
- 16.2.8.4. Recent Developments
- 16.2.8.5. Financials (Based on Availability)
- 16.2.9 Foodchem International Corporation
- 16.2.9.1. Overview
- 16.2.9.2. Products
- 16.2.9.3. SWOT Analysis
- 16.2.9.4. Recent Developments
- 16.2.9.5. Financials (Based on Availability)
- 16.2.10 Cargill Incorporated
- 16.2.10.1. Overview
- 16.2.10.2. Products
- 16.2.10.3. SWOT Analysis
- 16.2.10.4. Recent Developments
- 16.2.10.5. Financials (Based on Availability)
- 16.2.1 CHS Inc
List of Figures
- Figure 1: Global APAC Soy Protein Animal Feed Industry Revenue Breakdown (Million, %) by Region 2024 & 2032
- Figure 2: Global APAC Soy Protein Animal Feed Industry Volume Breakdown (K Tons, %) by Region 2024 & 2032
- Figure 3: North America APAC Soy Protein Animal Feed Industry Revenue (Million), by Country 2024 & 2032
- Figure 4: North America APAC Soy Protein Animal Feed Industry Volume (K Tons), by Country 2024 & 2032
- Figure 5: North America APAC Soy Protein Animal Feed Industry Revenue Share (%), by Country 2024 & 2032
- Figure 6: North America APAC Soy Protein Animal Feed Industry Volume Share (%), by Country 2024 & 2032
- Figure 7: Europe APAC Soy Protein Animal Feed Industry Revenue (Million), by Country 2024 & 2032
- Figure 8: Europe APAC Soy Protein Animal Feed Industry Volume (K Tons), by Country 2024 & 2032
- Figure 9: Europe APAC Soy Protein Animal Feed Industry Revenue Share (%), by Country 2024 & 2032
- Figure 10: Europe APAC Soy Protein Animal Feed Industry Volume Share (%), by Country 2024 & 2032
- Figure 11: Asia Pacific APAC Soy Protein Animal Feed Industry Revenue (Million), by Country 2024 & 2032
- Figure 12: Asia Pacific APAC Soy Protein Animal Feed Industry Volume (K Tons), by Country 2024 & 2032
- Figure 13: Asia Pacific APAC Soy Protein Animal Feed Industry Revenue Share (%), by Country 2024 & 2032
- Figure 14: Asia Pacific APAC Soy Protein Animal Feed Industry Volume Share (%), by Country 2024 & 2032
- Figure 15: South America APAC Soy Protein Animal Feed Industry Revenue (Million), by Country 2024 & 2032
- Figure 16: South America APAC Soy Protein Animal Feed Industry Volume (K Tons), by Country 2024 & 2032
- Figure 17: South America APAC Soy Protein Animal Feed Industry Revenue Share (%), by Country 2024 & 2032
- Figure 18: South America APAC Soy Protein Animal Feed Industry Volume Share (%), by Country 2024 & 2032
- Figure 19: Middle East and Africa APAC Soy Protein Animal Feed Industry Revenue (Million), by Country 2024 & 2032
- Figure 20: Middle East and Africa APAC Soy Protein Animal Feed Industry Volume (K Tons), by Country 2024 & 2032
- Figure 21: Middle East and Africa APAC Soy Protein Animal Feed Industry Revenue Share (%), by Country 2024 & 2032
- Figure 22: Middle East and Africa APAC Soy Protein Animal Feed Industry Volume Share (%), by Country 2024 & 2032
- Figure 23: North America APAC Soy Protein Animal Feed Industry Revenue (Million), by Form 2024 & 2032
- Figure 24: North America APAC Soy Protein Animal Feed Industry Volume (K Tons), by Form 2024 & 2032
- Figure 25: North America APAC Soy Protein Animal Feed Industry Revenue Share (%), by Form 2024 & 2032
- Figure 26: North America APAC Soy Protein Animal Feed Industry Volume Share (%), by Form 2024 & 2032
- Figure 27: North America APAC Soy Protein Animal Feed Industry Revenue (Million), by End User 2024 & 2032
- Figure 28: North America APAC Soy Protein Animal Feed Industry Volume (K Tons), by End User 2024 & 2032
- Figure 29: North America APAC Soy Protein Animal Feed Industry Revenue Share (%), by End User 2024 & 2032
- Figure 30: North America APAC Soy Protein Animal Feed Industry Volume Share (%), by End User 2024 & 2032
- Figure 31: North America APAC Soy Protein Animal Feed Industry Revenue (Million), by Country 2024 & 2032
- Figure 32: North America APAC Soy Protein Animal Feed Industry Volume (K Tons), by Country 2024 & 2032
- Figure 33: North America APAC Soy Protein Animal Feed Industry Revenue Share (%), by Country 2024 & 2032
- Figure 34: North America APAC Soy Protein Animal Feed Industry Volume Share (%), by Country 2024 & 2032
- Figure 35: South America APAC Soy Protein Animal Feed Industry Revenue (Million), by Form 2024 & 2032
- Figure 36: South America APAC Soy Protein Animal Feed Industry Volume (K Tons), by Form 2024 & 2032
- Figure 37: South America APAC Soy Protein Animal Feed Industry Revenue Share (%), by Form 2024 & 2032
- Figure 38: South America APAC Soy Protein Animal Feed Industry Volume Share (%), by Form 2024 & 2032
- Figure 39: South America APAC Soy Protein Animal Feed Industry Revenue (Million), by End User 2024 & 2032
- Figure 40: South America APAC Soy Protein Animal Feed Industry Volume (K Tons), by End User 2024 & 2032
- Figure 41: South America APAC Soy Protein Animal Feed Industry Revenue Share (%), by End User 2024 & 2032
- Figure 42: South America APAC Soy Protein Animal Feed Industry Volume Share (%), by End User 2024 & 2032
- Figure 43: South America APAC Soy Protein Animal Feed Industry Revenue (Million), by Country 2024 & 2032
- Figure 44: South America APAC Soy Protein Animal Feed Industry Volume (K Tons), by Country 2024 & 2032
- Figure 45: South America APAC Soy Protein Animal Feed Industry Revenue Share (%), by Country 2024 & 2032
- Figure 46: South America APAC Soy Protein Animal Feed Industry Volume Share (%), by Country 2024 & 2032
- Figure 47: Europe APAC Soy Protein Animal Feed Industry Revenue (Million), by Form 2024 & 2032
- Figure 48: Europe APAC Soy Protein Animal Feed Industry Volume (K Tons), by Form 2024 & 2032
- Figure 49: Europe APAC Soy Protein Animal Feed Industry Revenue Share (%), by Form 2024 & 2032
- Figure 50: Europe APAC Soy Protein Animal Feed Industry Volume Share (%), by Form 2024 & 2032
- Figure 51: Europe APAC Soy Protein Animal Feed Industry Revenue (Million), by End User 2024 & 2032
- Figure 52: Europe APAC Soy Protein Animal Feed Industry Volume (K Tons), by End User 2024 & 2032
- Figure 53: Europe APAC Soy Protein Animal Feed Industry Revenue Share (%), by End User 2024 & 2032
- Figure 54: Europe APAC Soy Protein Animal Feed Industry Volume Share (%), by End User 2024 & 2032
- Figure 55: Europe APAC Soy Protein Animal Feed Industry Revenue (Million), by Country 2024 & 2032
- Figure 56: Europe APAC Soy Protein Animal Feed Industry Volume (K Tons), by Country 2024 & 2032
- Figure 57: Europe APAC Soy Protein Animal Feed Industry Revenue Share (%), by Country 2024 & 2032
- Figure 58: Europe APAC Soy Protein Animal Feed Industry Volume Share (%), by Country 2024 & 2032
- Figure 59: Middle East & Africa APAC Soy Protein Animal Feed Industry Revenue (Million), by Form 2024 & 2032
- Figure 60: Middle East & Africa APAC Soy Protein Animal Feed Industry Volume (K Tons), by Form 2024 & 2032
- Figure 61: Middle East & Africa APAC Soy Protein Animal Feed Industry Revenue Share (%), by Form 2024 & 2032
- Figure 62: Middle East & Africa APAC Soy Protein Animal Feed Industry Volume Share (%), by Form 2024 & 2032
- Figure 63: Middle East & Africa APAC Soy Protein Animal Feed Industry Revenue (Million), by End User 2024 & 2032
- Figure 64: Middle East & Africa APAC Soy Protein Animal Feed Industry Volume (K Tons), by End User 2024 & 2032
- Figure 65: Middle East & Africa APAC Soy Protein Animal Feed Industry Revenue Share (%), by End User 2024 & 2032
- Figure 66: Middle East & Africa APAC Soy Protein Animal Feed Industry Volume Share (%), by End User 2024 & 2032
- Figure 67: Middle East & Africa APAC Soy Protein Animal Feed Industry Revenue (Million), by Country 2024 & 2032
- Figure 68: Middle East & Africa APAC Soy Protein Animal Feed Industry Volume (K Tons), by Country 2024 & 2032
- Figure 69: Middle East & Africa APAC Soy Protein Animal Feed Industry Revenue Share (%), by Country 2024 & 2032
- Figure 70: Middle East & Africa APAC Soy Protein Animal Feed Industry Volume Share (%), by Country 2024 & 2032
- Figure 71: Asia Pacific APAC Soy Protein Animal Feed Industry Revenue (Million), by Form 2024 & 2032
- Figure 72: Asia Pacific APAC Soy Protein Animal Feed Industry Volume (K Tons), by Form 2024 & 2032
- Figure 73: Asia Pacific APAC Soy Protein Animal Feed Industry Revenue Share (%), by Form 2024 & 2032
- Figure 74: Asia Pacific APAC Soy Protein Animal Feed Industry Volume Share (%), by Form 2024 & 2032
- Figure 75: Asia Pacific APAC Soy Protein Animal Feed Industry Revenue (Million), by End User 2024 & 2032
- Figure 76: Asia Pacific APAC Soy Protein Animal Feed Industry Volume (K Tons), by End User 2024 & 2032
- Figure 77: Asia Pacific APAC Soy Protein Animal Feed Industry Revenue Share (%), by End User 2024 & 2032
- Figure 78: Asia Pacific APAC Soy Protein Animal Feed Industry Volume Share (%), by End User 2024 & 2032
- Figure 79: Asia Pacific APAC Soy Protein Animal Feed Industry Revenue (Million), by Country 2024 & 2032
- Figure 80: Asia Pacific APAC Soy Protein Animal Feed Industry Volume (K Tons), by Country 2024 & 2032
- Figure 81: Asia Pacific APAC Soy Protein Animal Feed Industry Revenue Share (%), by Country 2024 & 2032
- Figure 82: Asia Pacific APAC Soy Protein Animal Feed Industry Volume Share (%), by Country 2024 & 2032
List of Tables
- Table 1: Global APAC Soy Protein Animal Feed Industry Revenue Million Forecast, by Region 2019 & 2032
- Table 2: Global APAC Soy Protein Animal Feed Industry Volume K Tons Forecast, by Region 2019 & 2032
- Table 3: Global APAC Soy Protein Animal Feed Industry Revenue Million Forecast, by Form 2019 & 2032
- Table 4: Global APAC Soy Protein Animal Feed Industry Volume K Tons Forecast, by Form 2019 & 2032
- Table 5: Global APAC Soy Protein Animal Feed Industry Revenue Million Forecast, by End User 2019 & 2032
- Table 6: Global APAC Soy Protein Animal Feed Industry Volume K Tons Forecast, by End User 2019 & 2032
- Table 7: Global APAC Soy Protein Animal Feed Industry Revenue Million Forecast, by Region 2019 & 2032
- Table 8: Global APAC Soy Protein Animal Feed Industry Volume K Tons Forecast, by Region 2019 & 2032
- Table 9: Global APAC Soy Protein Animal Feed Industry Revenue Million Forecast, by Country 2019 & 2032
- Table 10: Global APAC Soy Protein Animal Feed Industry Volume K Tons Forecast, by Country 2019 & 2032
- Table 11: United States APAC Soy Protein Animal Feed Industry Revenue (Million) Forecast, by Application 2019 & 2032
- Table 12: United States APAC Soy Protein Animal Feed Industry Volume (K Tons) Forecast, by Application 2019 & 2032
- Table 13: Canada APAC Soy Protein Animal Feed Industry Revenue (Million) Forecast, by Application 2019 & 2032
- Table 14: Canada APAC Soy Protein Animal Feed Industry Volume (K Tons) Forecast, by Application 2019 & 2032
- Table 15: Mexico APAC Soy Protein Animal Feed Industry Revenue (Million) Forecast, by Application 2019 & 2032
- Table 16: Mexico APAC Soy Protein Animal Feed Industry Volume (K Tons) Forecast, by Application 2019 & 2032
- Table 17: Rest of North America APAC Soy Protein Animal Feed Industry Revenue (Million) Forecast, by Application 2019 & 2032
- Table 18: Rest of North America APAC Soy Protein Animal Feed Industry Volume (K Tons) Forecast, by Application 2019 & 2032
- Table 19: Global APAC Soy Protein Animal Feed Industry Revenue Million Forecast, by Country 2019 & 2032
- Table 20: Global APAC Soy Protein Animal Feed Industry Volume K Tons Forecast, by Country 2019 & 2032
- Table 21: Germany APAC Soy Protein Animal Feed Industry Revenue (Million) Forecast, by Application 2019 & 2032
- Table 22: Germany APAC Soy Protein Animal Feed Industry Volume (K Tons) Forecast, by Application 2019 & 2032
- Table 23: United Kingdom APAC Soy Protein Animal Feed Industry Revenue (Million) Forecast, by Application 2019 & 2032
- Table 24: United Kingdom APAC Soy Protein Animal Feed Industry Volume (K Tons) Forecast, by Application 2019 & 2032
- Table 25: France APAC Soy Protein Animal Feed Industry Revenue (Million) Forecast, by Application 2019 & 2032
- Table 26: France APAC Soy Protein Animal Feed Industry Volume (K Tons) Forecast, by Application 2019 & 2032
- Table 27: Russia APAC Soy Protein Animal Feed Industry Revenue (Million) Forecast, by Application 2019 & 2032
- Table 28: Russia APAC Soy Protein Animal Feed Industry Volume (K Tons) Forecast, by Application 2019 & 2032
- Table 29: Spain APAC Soy Protein Animal Feed Industry Revenue (Million) Forecast, by Application 2019 & 2032
- Table 30: Spain APAC Soy Protein Animal Feed Industry Volume (K Tons) Forecast, by Application 2019 & 2032
- Table 31: Italy APAC Soy Protein Animal Feed Industry Revenue (Million) Forecast, by Application 2019 & 2032
- Table 32: Italy APAC Soy Protein Animal Feed Industry Volume (K Tons) Forecast, by Application 2019 & 2032
- Table 33: Rest of Europe APAC Soy Protein Animal Feed Industry Revenue (Million) Forecast, by Application 2019 & 2032
- Table 34: Rest of Europe APAC Soy Protein Animal Feed Industry Volume (K Tons) Forecast, by Application 2019 & 2032
- Table 35: Global APAC Soy Protein Animal Feed Industry Revenue Million Forecast, by Country 2019 & 2032
- Table 36: Global APAC Soy Protein Animal Feed Industry Volume K Tons Forecast, by Country 2019 & 2032
- Table 37: China APAC Soy Protein Animal Feed Industry Revenue (Million) Forecast, by Application 2019 & 2032
- Table 38: China APAC Soy Protein Animal Feed Industry Volume (K Tons) Forecast, by Application 2019 & 2032
- Table 39: Japan APAC Soy Protein Animal Feed Industry Revenue (Million) Forecast, by Application 2019 & 2032
- Table 40: Japan APAC Soy Protein Animal Feed Industry Volume (K Tons) Forecast, by Application 2019 & 2032
- Table 41: India APAC Soy Protein Animal Feed Industry Revenue (Million) Forecast, by Application 2019 & 2032
- Table 42: India APAC Soy Protein Animal Feed Industry Volume (K Tons) Forecast, by Application 2019 & 2032
- Table 43: Australia APAC Soy Protein Animal Feed Industry Revenue (Million) Forecast, by Application 2019 & 2032
- Table 44: Australia APAC Soy Protein Animal Feed Industry Volume (K Tons) Forecast, by Application 2019 & 2032
- Table 45: Rest of Asia Pacific APAC Soy Protein Animal Feed Industry Revenue (Million) Forecast, by Application 2019 & 2032
- Table 46: Rest of Asia Pacific APAC Soy Protein Animal Feed Industry Volume (K Tons) Forecast, by Application 2019 & 2032
- Table 47: Global APAC Soy Protein Animal Feed Industry Revenue Million Forecast, by Country 2019 & 2032
- Table 48: Global APAC Soy Protein Animal Feed Industry Volume K Tons Forecast, by Country 2019 & 2032
- Table 49: Brazil APAC Soy Protein Animal Feed Industry Revenue (Million) Forecast, by Application 2019 & 2032
- Table 50: Brazil APAC Soy Protein Animal Feed Industry Volume (K Tons) Forecast, by Application 2019 & 2032
- Table 51: Argentina APAC Soy Protein Animal Feed Industry Revenue (Million) Forecast, by Application 2019 & 2032
- Table 52: Argentina APAC Soy Protein Animal Feed Industry Volume (K Tons) Forecast, by Application 2019 & 2032
- Table 53: Rest of South America APAC Soy Protein Animal Feed Industry Revenue (Million) Forecast, by Application 2019 & 2032
- Table 54: Rest of South America APAC Soy Protein Animal Feed Industry Volume (K Tons) Forecast, by Application 2019 & 2032
- Table 55: Global APAC Soy Protein Animal Feed Industry Revenue Million Forecast, by Country 2019 & 2032
- Table 56: Global APAC Soy Protein Animal Feed Industry Volume K Tons Forecast, by Country 2019 & 2032
- Table 57: United Arab Emirates APAC Soy Protein Animal Feed Industry Revenue (Million) Forecast, by Application 2019 & 2032
- Table 58: United Arab Emirates APAC Soy Protein Animal Feed Industry Volume (K Tons) Forecast, by Application 2019 & 2032
- Table 59: South Africa APAC Soy Protein Animal Feed Industry Revenue (Million) Forecast, by Application 2019 & 2032
- Table 60: South Africa APAC Soy Protein Animal Feed Industry Volume (K Tons) Forecast, by Application 2019 & 2032
- Table 61: Rest of Middle East and Africa APAC Soy Protein Animal Feed Industry Revenue (Million) Forecast, by Application 2019 & 2032
- Table 62: Rest of Middle East and Africa APAC Soy Protein Animal Feed Industry Volume (K Tons) Forecast, by Application 2019 & 2032
- Table 63: Global APAC Soy Protein Animal Feed Industry Revenue Million Forecast, by Form 2019 & 2032
- Table 64: Global APAC Soy Protein Animal Feed Industry Volume K Tons Forecast, by Form 2019 & 2032
- Table 65: Global APAC Soy Protein Animal Feed Industry Revenue Million Forecast, by End User 2019 & 2032
- Table 66: Global APAC Soy Protein Animal Feed Industry Volume K Tons Forecast, by End User 2019 & 2032
- Table 67: Global APAC Soy Protein Animal Feed Industry Revenue Million Forecast, by Country 2019 & 2032
- Table 68: Global APAC Soy Protein Animal Feed Industry Volume K Tons Forecast, by Country 2019 & 2032
- Table 69: United States APAC Soy Protein Animal Feed Industry Revenue (Million) Forecast, by Application 2019 & 2032
- Table 70: United States APAC Soy Protein Animal Feed Industry Volume (K Tons) Forecast, by Application 2019 & 2032
- Table 71: Canada APAC Soy Protein Animal Feed Industry Revenue (Million) Forecast, by Application 2019 & 2032
- Table 72: Canada APAC Soy Protein Animal Feed Industry Volume (K Tons) Forecast, by Application 2019 & 2032
- Table 73: Mexico APAC Soy Protein Animal Feed Industry Revenue (Million) Forecast, by Application 2019 & 2032
- Table 74: Mexico APAC Soy Protein Animal Feed Industry Volume (K Tons) Forecast, by Application 2019 & 2032
- Table 75: Global APAC Soy Protein Animal Feed Industry Revenue Million Forecast, by Form 2019 & 2032
- Table 76: Global APAC Soy Protein Animal Feed Industry Volume K Tons Forecast, by Form 2019 & 2032
- Table 77: Global APAC Soy Protein Animal Feed Industry Revenue Million Forecast, by End User 2019 & 2032
- Table 78: Global APAC Soy Protein Animal Feed Industry Volume K Tons Forecast, by End User 2019 & 2032
- Table 79: Global APAC Soy Protein Animal Feed Industry Revenue Million Forecast, by Country 2019 & 2032
- Table 80: Global APAC Soy Protein Animal Feed Industry Volume K Tons Forecast, by Country 2019 & 2032
- Table 81: Brazil APAC Soy Protein Animal Feed Industry Revenue (Million) Forecast, by Application 2019 & 2032
- Table 82: Brazil APAC Soy Protein Animal Feed Industry Volume (K Tons) Forecast, by Application 2019 & 2032
- Table 83: Argentina APAC Soy Protein Animal Feed Industry Revenue (Million) Forecast, by Application 2019 & 2032
- Table 84: Argentina APAC Soy Protein Animal Feed Industry Volume (K Tons) Forecast, by Application 2019 & 2032
- Table 85: Rest of South America APAC Soy Protein Animal Feed Industry Revenue (Million) Forecast, by Application 2019 & 2032
- Table 86: Rest of South America APAC Soy Protein Animal Feed Industry Volume (K Tons) Forecast, by Application 2019 & 2032
- Table 87: Global APAC Soy Protein Animal Feed Industry Revenue Million Forecast, by Form 2019 & 2032
- Table 88: Global APAC Soy Protein Animal Feed Industry Volume K Tons Forecast, by Form 2019 & 2032
- Table 89: Global APAC Soy Protein Animal Feed Industry Revenue Million Forecast, by End User 2019 & 2032
- Table 90: Global APAC Soy Protein Animal Feed Industry Volume K Tons Forecast, by End User 2019 & 2032
- Table 91: Global APAC Soy Protein Animal Feed Industry Revenue Million Forecast, by Country 2019 & 2032
- Table 92: Global APAC Soy Protein Animal Feed Industry Volume K Tons Forecast, by Country 2019 & 2032
- Table 93: United Kingdom APAC Soy Protein Animal Feed Industry Revenue (Million) Forecast, by Application 2019 & 2032
- Table 94: United Kingdom APAC Soy Protein Animal Feed Industry Volume (K Tons) Forecast, by Application 2019 & 2032
- Table 95: Germany APAC Soy Protein Animal Feed Industry Revenue (Million) Forecast, by Application 2019 & 2032
- Table 96: Germany APAC Soy Protein Animal Feed Industry Volume (K Tons) Forecast, by Application 2019 & 2032
- Table 97: France APAC Soy Protein Animal Feed Industry Revenue (Million) Forecast, by Application 2019 & 2032
- Table 98: France APAC Soy Protein Animal Feed Industry Volume (K Tons) Forecast, by Application 2019 & 2032
- Table 99: Italy APAC Soy Protein Animal Feed Industry Revenue (Million) Forecast, by Application 2019 & 2032
- Table 100: Italy APAC Soy Protein Animal Feed Industry Volume (K Tons) Forecast, by Application 2019 & 2032
- Table 101: Spain APAC Soy Protein Animal Feed Industry Revenue (Million) Forecast, by Application 2019 & 2032
- Table 102: Spain APAC Soy Protein Animal Feed Industry Volume (K Tons) Forecast, by Application 2019 & 2032
- Table 103: Russia APAC Soy Protein Animal Feed Industry Revenue (Million) Forecast, by Application 2019 & 2032
- Table 104: Russia APAC Soy Protein Animal Feed Industry Volume (K Tons) Forecast, by Application 2019 & 2032
- Table 105: Benelux APAC Soy Protein Animal Feed Industry Revenue (Million) Forecast, by Application 2019 & 2032
- Table 106: Benelux APAC Soy Protein Animal Feed Industry Volume (K Tons) Forecast, by Application 2019 & 2032
- Table 107: Nordics APAC Soy Protein Animal Feed Industry Revenue (Million) Forecast, by Application 2019 & 2032
- Table 108: Nordics APAC Soy Protein Animal Feed Industry Volume (K Tons) Forecast, by Application 2019 & 2032
- Table 109: Rest of Europe APAC Soy Protein Animal Feed Industry Revenue (Million) Forecast, by Application 2019 & 2032
- Table 110: Rest of Europe APAC Soy Protein Animal Feed Industry Volume (K Tons) Forecast, by Application 2019 & 2032
- Table 111: Global APAC Soy Protein Animal Feed Industry Revenue Million Forecast, by Form 2019 & 2032
- Table 112: Global APAC Soy Protein Animal Feed Industry Volume K Tons Forecast, by Form 2019 & 2032
- Table 113: Global APAC Soy Protein Animal Feed Industry Revenue Million Forecast, by End User 2019 & 2032
- Table 114: Global APAC Soy Protein Animal Feed Industry Volume K Tons Forecast, by End User 2019 & 2032
- Table 115: Global APAC Soy Protein Animal Feed Industry Revenue Million Forecast, by Country 2019 & 2032
- Table 116: Global APAC Soy Protein Animal Feed Industry Volume K Tons Forecast, by Country 2019 & 2032
- Table 117: Turkey APAC Soy Protein Animal Feed Industry Revenue (Million) Forecast, by Application 2019 & 2032
- Table 118: Turkey APAC Soy Protein Animal Feed Industry Volume (K Tons) Forecast, by Application 2019 & 2032
- Table 119: Israel APAC Soy Protein Animal Feed Industry Revenue (Million) Forecast, by Application 2019 & 2032
- Table 120: Israel APAC Soy Protein Animal Feed Industry Volume (K Tons) Forecast, by Application 2019 & 2032
- Table 121: GCC APAC Soy Protein Animal Feed Industry Revenue (Million) Forecast, by Application 2019 & 2032
- Table 122: GCC APAC Soy Protein Animal Feed Industry Volume (K Tons) Forecast, by Application 2019 & 2032
- Table 123: North Africa APAC Soy Protein Animal Feed Industry Revenue (Million) Forecast, by Application 2019 & 2032
- Table 124: North Africa APAC Soy Protein Animal Feed Industry Volume (K Tons) Forecast, by Application 2019 & 2032
- Table 125: South Africa APAC Soy Protein Animal Feed Industry Revenue (Million) Forecast, by Application 2019 & 2032
- Table 126: South Africa APAC Soy Protein Animal Feed Industry Volume (K Tons) Forecast, by Application 2019 & 2032
- Table 127: Rest of Middle East & Africa APAC Soy Protein Animal Feed Industry Revenue (Million) Forecast, by Application 2019 & 2032
- Table 128: Rest of Middle East & Africa APAC Soy Protein Animal Feed Industry Volume (K Tons) Forecast, by Application 2019 & 2032
- Table 129: Global APAC Soy Protein Animal Feed Industry Revenue Million Forecast, by Form 2019 & 2032
- Table 130: Global APAC Soy Protein Animal Feed Industry Volume K Tons Forecast, by Form 2019 & 2032
- Table 131: Global APAC Soy Protein Animal Feed Industry Revenue Million Forecast, by End User 2019 & 2032
- Table 132: Global APAC Soy Protein Animal Feed Industry Volume K Tons Forecast, by End User 2019 & 2032
- Table 133: Global APAC Soy Protein Animal Feed Industry Revenue Million Forecast, by Country 2019 & 2032
- Table 134: Global APAC Soy Protein Animal Feed Industry Volume K Tons Forecast, by Country 2019 & 2032
- Table 135: China APAC Soy Protein Animal Feed Industry Revenue (Million) Forecast, by Application 2019 & 2032
- Table 136: China APAC Soy Protein Animal Feed Industry Volume (K Tons) Forecast, by Application 2019 & 2032
- Table 137: India APAC Soy Protein Animal Feed Industry Revenue (Million) Forecast, by Application 2019 & 2032
- Table 138: India APAC Soy Protein Animal Feed Industry Volume (K Tons) Forecast, by Application 2019 & 2032
- Table 139: Japan APAC Soy Protein Animal Feed Industry Revenue (Million) Forecast, by Application 2019 & 2032
- Table 140: Japan APAC Soy Protein Animal Feed Industry Volume (K Tons) Forecast, by Application 2019 & 2032
- Table 141: South Korea APAC Soy Protein Animal Feed Industry Revenue (Million) Forecast, by Application 2019 & 2032
- Table 142: South Korea APAC Soy Protein Animal Feed Industry Volume (K Tons) Forecast, by Application 2019 & 2032
- Table 143: ASEAN APAC Soy Protein Animal Feed Industry Revenue (Million) Forecast, by Application 2019 & 2032
- Table 144: ASEAN APAC Soy Protein Animal Feed Industry Volume (K Tons) Forecast, by Application 2019 & 2032
- Table 145: Oceania APAC Soy Protein Animal Feed Industry Revenue (Million) Forecast, by Application 2019 & 2032
- Table 146: Oceania APAC Soy Protein Animal Feed Industry Volume (K Tons) Forecast, by Application 2019 & 2032
- Table 147: Rest of Asia Pacific APAC Soy Protein Animal Feed Industry Revenue (Million) Forecast, by Application 2019 & 2032
- Table 148: Rest of Asia Pacific APAC Soy Protein Animal Feed Industry Volume (K Tons) Forecast, by Application 2019 & 2032
Frequently Asked Questions
1. What is the projected Compound Annual Growth Rate (CAGR) of the APAC Soy Protein Animal Feed Industry?
The projected CAGR is approximately 4.02%.
2. Which companies are prominent players in the APAC Soy Protein Animal Feed Industry?
Key companies in the market include CHS Inc, Shandong Yuwang Industrial Co Ltd, International Flavors & Fragrances Inc, Wilmar International Lt, Archer Daniels Midland Company, Bunge Limited, Fuji Oil Group, Kerry Group PLC, Foodchem International Corporation, Cargill Incorporated.
3. What are the main segments of the APAC Soy Protein Animal Feed Industry?
The market segments include Form, End User.
4. Can you provide details about the market size?
The market size is estimated to be USD XX Million as of 2022.
5. What are some drivers contributing to market growth?
Increasing awareness towards fitness among consumers; Demand for convenient fortified foods.
6. What are the notable trends driving market growth?
OTHER KEY INDUSTRY TRENDS COVERED IN THE REPORT.
7. Are there any restraints impacting market growth?
Prevalence of allergen intolerance among the consumers.
8. Can you provide examples of recent developments in the market?
July 2020: DuPont Nutrition & Biosciences (DuPont), a subsidiary of IFF, offers the industry's broadest assortment of ingredients for plant-based product development with the new Danisco Planit range. Danisco Planit is a global launch that includes services, expertise, and an unparalleled ingredient portfolio for plant-based food and beverages, including plant proteins, hydrocolloids, cultures, probiotics, fibers, food protection, antioxidants, natural extracts, emulsifiers, and enzymes, as well as tailor-made systems.March 2019: DuPont launched new soy-based Protein Nuggets under the brand SUPRO. The 90% protein nugget product range was aimed to broaden the company's range of plant protein options that drive high protein content and unique textures.January 2019: Fuji Oil Holdings Inc. constructed a new plant for soy processing food on the grounds of its Chiba Plant (located in the city of Chiba, Chiba Prefecture, Japan) with an investment of JPY 2.4 billion. With the new plant having a production capacity of 9,000 ton per year and a building floor of 1,456 square meters, the company plans to develop new markets for the future.
9. What pricing options are available for accessing the report?
Pricing options include single-user, multi-user, and enterprise licenses priced at USD 3800, USD 4500, and USD 5800 respectively.
10. Is the market size provided in terms of value or volume?
The market size is provided in terms of value, measured in Million and volume, measured in K Tons.
11. Are there any specific market keywords associated with the report?
Yes, the market keyword associated with the report is "APAC Soy Protein Animal Feed Industry," which aids in identifying and referencing the specific market segment covered.
12. How do I determine which pricing option suits my needs best?
The pricing options vary based on user requirements and access needs. Individual users may opt for single-user licenses, while businesses requiring broader access may choose multi-user or enterprise licenses for cost-effective access to the report.
13. Are there any additional resources or data provided in the APAC Soy Protein Animal Feed Industry report?
While the report offers comprehensive insights, it's advisable to review the specific contents or supplementary materials provided to ascertain if additional resources or data are available.
14. How can I stay updated on further developments or reports in the APAC Soy Protein Animal Feed Industry?
To stay informed about further developments, trends, and reports in the APAC Soy Protein Animal Feed Industry, consider subscribing to industry newsletters, following relevant companies and organizations, or regularly checking reputable industry news sources and publications.
Methodology
Step 1 - Identification of Relevant Samples Size from Population Database


Step 2 - Approaches for Defining Global Market Size (Value, Volume* & Price*)

Note*: In applicable scenarios
Step 3 - Data Sources
Primary Research
- Web Analytics
- Survey Reports
- Research Institute
- Latest Research Reports
- Opinion Leaders
Secondary Research
- Annual Reports
- White Paper
- Latest Press Release
- Industry Association
- Paid Database
- Investor Presentations

Step 4 - Data Triangulation
Involves using different sources of information in order to increase the validity of a study
These sources are likely to be stakeholders in a program - participants, other researchers, program staff, other community members, and so on.
Then we put all data in single framework & apply various statistical tools to find out the dynamic on the market.
During the analysis stage, feedback from the stakeholder groups would be compared to determine areas of agreement as well as areas of divergence
