

Key Insights
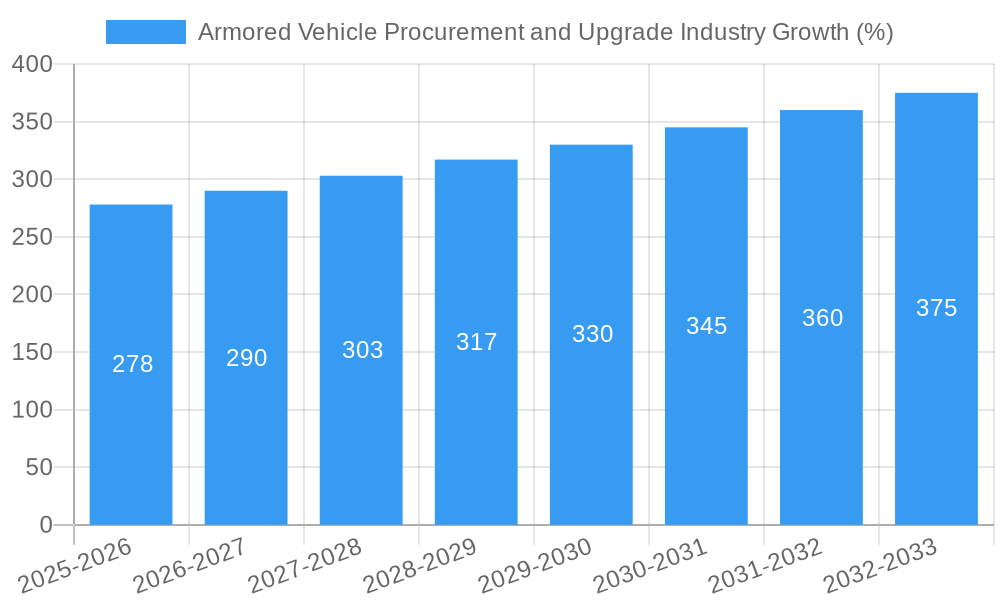
The global Armored Vehicle Procurement and Upgrade market, valued at $6.66 billion in 2025, is projected to experience robust growth, driven by escalating geopolitical instability and rising defense budgets worldwide. A compound annual growth rate (CAGR) of 4.23% is anticipated from 2025 to 2033, indicating a significant expansion of this sector. Key growth drivers include modernization efforts by militaries to enhance operational capabilities, the increasing demand for technologically advanced vehicles equipped with superior protection and firepower, and the growing need for effective counter-terrorism and peacekeeping operations. The market is segmented by vehicle type, with Armored Personnel Carriers (APCs), Infantry Fighting Vehicles (IFVs), and Mine-resistant Ambush Protected (MRAP) vehicles representing significant market shares. Technological advancements, such as the integration of advanced sensors, communication systems, and autonomous capabilities, are shaping future market trends. However, factors like high procurement costs and the complex regulatory landscape in certain regions pose challenges to market growth.
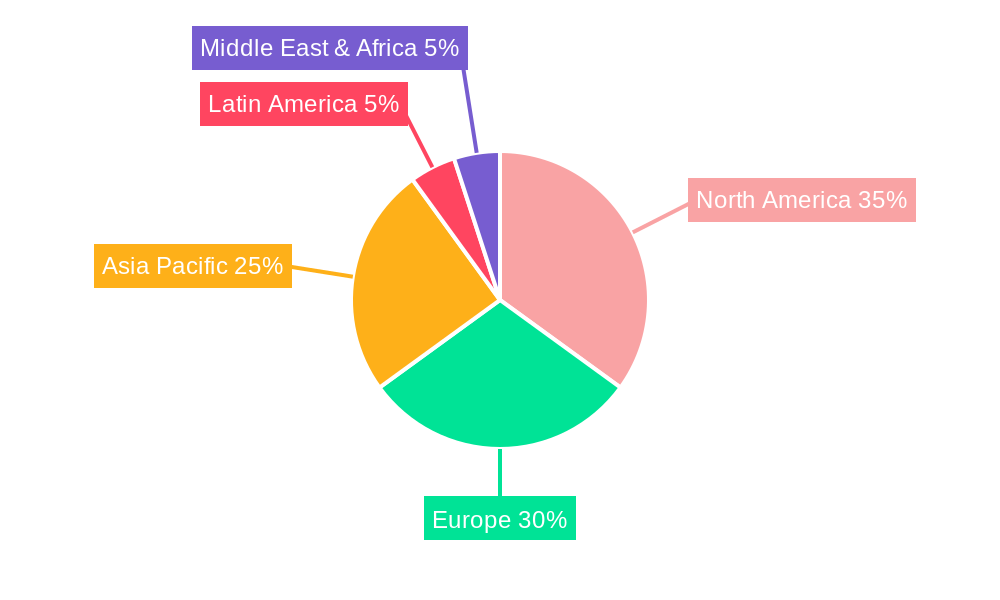
The competitive landscape is characterized by a mix of established defense contractors and emerging players. Major players like Textron, RUAG, FNSS, Thales, Oshkosh, General Dynamics, Rheinmetall, Elbit Systems, CMI Group, BMC, KNDS, Streit Group, IVECO, and BAE Systems are vying for market share through technological innovation, strategic partnerships, and expansion into new geographical markets. Regional variations in market dynamics are expected, with North America and Europe holding significant shares due to substantial defense spending and a strong presence of major manufacturers. The Asia-Pacific region, fueled by increasing military modernization efforts in countries like China and India, is anticipated to witness considerable growth in the forecast period. Latin America and the Middle East are also expected to contribute to overall market expansion, albeit at a potentially slower pace due to varying geopolitical situations and budgetary constraints.

Armored Vehicle Procurement and Upgrade Industry Market Dynamics & Structure
This comprehensive report analyzes the global armored vehicle procurement and upgrade market, encompassing the historical period (2019-2024), base year (2025), and forecast period (2025-2033). The market is characterized by a moderate level of concentration, with key players such as BAE Systems, General Dynamics, and Rheinmetall holding significant market share (xx%). However, the presence of numerous smaller, specialized companies fosters competition and innovation. Technological advancements, including the integration of advanced sensors, AI-driven systems, and improved armor materials, are crucial drivers. Stringent regulatory frameworks governing the production, export, and use of armored vehicles significantly impact market dynamics. The market faces competition from alternative solutions, such as unmanned aerial vehicles (UAVs) for certain applications. End-users primarily comprise national armed forces, with varying procurement strategies and budgetary allocations influencing market demand. Mergers and acquisitions (M&A) activity has been moderate in recent years, driven by consolidation efforts among established players and the pursuit of technological synergies. The overall market structure is expected to evolve towards greater specialization and the incorporation of advanced technologies.
- Market Concentration: Moderately concentrated, with top 5 players holding xx% market share in 2025.
- Technological Innovation: Key drivers include AI integration, advanced sensor technology, and improved armor materials.
- Regulatory Framework: Stringent export controls and end-use restrictions significantly influence market access and growth.
- Competitive Substitutes: UAVs and other advanced defense systems pose competitive threats in specific niche applications.
- End-User Demographics: Primarily national armed forces and special operations units, with diverse procurement strategies and budgets.
- M&A Trends: Moderate activity, driven by consolidation and acquisition of specialized technologies. An estimated xx M&A deals occurred between 2019 and 2024.
Armored Vehicle Procurement and Upgrade Industry Growth Trends & Insights
The global armored vehicle procurement and upgrade market exhibited robust growth during the historical period (2019-2024), driven by geopolitical instability, modernization efforts by armed forces worldwide, and increasing demand for advanced vehicle capabilities. The market size reached xx million units in 2024, and is projected to reach xx million units by 2033. The Compound Annual Growth Rate (CAGR) during the forecast period (2025-2033) is estimated at xx%. This growth is fueled by a number of factors, including rising defense budgets in several regions, technological innovations enhancing vehicle performance and survivability, and increasing demand for specialized armored vehicles for counter-terrorism and peacekeeping operations. Technological disruptions, such as the introduction of autonomous and remotely operated vehicles, are expected to accelerate market growth and reshape the competitive landscape. However, economic slowdowns or shifts in global geopolitical stability could potentially impact market growth. Consumer behavior, reflected in the specific needs and specifications of defense ministries, are constantly evolving, resulting in a demand for adaptable and versatile armored vehicles. Market penetration is expected to increase due to continued modernization efforts and increased demand for protection across various geographical regions.
Dominant Regions, Countries, or Segments in Armored Vehicle Procurement and Upgrade Industry
The North American and European regions are currently the largest markets for armored vehicle procurement and upgrades. However, the Asia-Pacific region is witnessing significant growth, driven by increasing defense budgets and modernization programs in countries like India, China, and South Korea. Within vehicle types, the Armored Personnel Carrier (APC) and Infantry Fighting Vehicle (IFV) segments dominate the market due to their versatility and wide-ranging applications. The Main Battle Tank (MBT) segment also constitutes a significant portion of the market, although characterized by higher procurement costs and specialized applications.
- Key Drivers in North America: Large defense budgets, technological leadership, and strong domestic manufacturing base.
- Key Drivers in Europe: Modernization programs of armed forces, collaborations among European nations, and strong technological capabilities.
- Key Drivers in Asia-Pacific: Rising defense expenditure, geopolitical tensions, and increasing domestic manufacturing capabilities.
- Segment Dominance: APCs and IFVs hold the largest market share due to their versatility and high demand.
Armored Vehicle Procurement and Upgrade Industry Product Landscape
The armored vehicle market encompasses a diverse range of products, each designed to meet specific operational requirements. Recent innovations include the integration of advanced sensors, improved protection systems (e.g., active protection systems), and enhanced mobility features. These vehicles are deployed in diverse settings, from peacekeeping operations to high-intensity conflicts. Unique selling propositions typically focus on survivability, mobility, and the integration of advanced technologies. Key performance metrics include armor protection levels, speed, payload capacity, and range. Technological advancements are continuously driving improvements in the areas of vehicle weight reduction, fuel efficiency, and integration of advanced communication and command & control systems.
Key Drivers, Barriers & Challenges in Armored Vehicle Procurement and Upgrade Industry
Key Drivers:
- Increased defense spending globally.
- Modernization of existing fleets and adoption of new technologies.
- Geopolitical instability and rising conflicts.
Challenges and Restraints:
- High procurement costs and limited defense budgets in some regions.
- Complex supply chains and potential disruptions.
- Stringent export controls and regulations.
- Intense competition among major manufacturers. This competition leads to price pressures and reduces profit margins, impacting investments in R&D.
Emerging Opportunities in Armored Vehicle Procurement and Upgrade Industry
- Growing demand for specialized armored vehicles for counter-terrorism and asymmetric warfare.
- Development of autonomous and remotely operated armored vehicles.
- Expansion into emerging markets in Africa and the Middle East.
- Increased focus on lighter and more fuel-efficient designs.
Growth Accelerators in the Armored Vehicle Procurement and Upgrade Industry Industry
Technological breakthroughs in areas such as AI-driven systems and advanced materials are accelerating market growth. Strategic partnerships and collaborations among defense manufacturers are fostering innovation and expanding market reach. Expansion into new geographic markets and the increasing demand for sophisticated, specialized vehicles are also significant growth catalysts.
Key Players Shaping the Armored Vehicle Procurement and Upgrade Industry Market
- Textron Inc
- RUAG International Holding Ltd
- FNSS Savunma Sistemleri A Ş
- THALES
- Oshkosh Corporation
- General Dynamics Corporation
- Rheinmetall AG
- Elbit Systems Ltd
- The CMI Group Inc
- BMC Otomotiv Sanayi ve Ticaret A Ş
- KNDS N V
- Streit Group
- IVECO S p A
- BAE Systems plc
Notable Milestones in Armored Vehicle Procurement and Upgrade Industry Sector
- May 2023: Elbit Systems Ltd. awarded a contract under the British Army's Project Vulcan for maintenance and operation of the GMST system, Boxer armored vehicles, and Challenger 3 tanks.
- May 2023: Czech MoD awarded a USD 2.2 billion contract to BAE Systems plc for 246 CV90 Mk IV IFVs; Slovakia ordered 152 additional vehicles.
In-Depth Armored Vehicle Procurement and Upgrade Industry Market Outlook
The future of the armored vehicle market is promising, driven by ongoing technological advancements, geopolitical uncertainties, and the increasing demand for advanced defense capabilities. Strategic partnerships and investments in research and development will play a crucial role in shaping the market landscape. New opportunities are expected to emerge in areas such as autonomous vehicles, enhanced protection systems, and the integration of advanced sensor and communication technologies. The market is projected to experience steady growth over the forecast period, with significant opportunities for established players and new entrants alike.
Armored Vehicle Procurement and Upgrade Industry Segmentation
-
1. Vehicle Type
- 1.1. Armored Personnel Carrier (APC)
- 1.2. Infantry Fighting Vehicle (IFV)
- 1.3. Mine-resistant Ambush Protected (MRAP)
- 1.4. Main Battle Tank (MBT)
- 1.5. Other Vehicle Types
Armored Vehicle Procurement and Upgrade Industry Segmentation By Geography
-
1. North America
- 1.1. United States
- 1.2. Canada
-
2. Europe
- 2.1. United Kingdom
- 2.2. France
- 2.3. Germany
- 2.4. Russia
- 2.5. Rest of Europe
-
3. Asia Pacific
- 3.1. China
- 3.2. India
- 3.3. Japan
- 3.4. South Korea
- 3.5. Australia
- 3.6. Rest of Asia Pacific
-
4. Latin America
- 4.1. Brazil
- 4.2. Mexico
- 4.3. Rest of Latin America
- 5. Middle East
-
6. United Arab Emirates
- 6.1. Saudi Arabia
- 6.2. Turkey
- 6.3. South Africa
- 6.4. Rest of Middle East and Africa
Armored Vehicle Procurement and Upgrade Industry REPORT HIGHLIGHTS
| Aspects | Details |
|---|---|
| Study Period | 2019-2033 |
| Base Year | 2024 |
| Estimated Year | 2025 |
| Forecast Period | 2025-2033 |
| Historical Period | 2019-2024 |
| Growth Rate | CAGR of 4.23% from 2019-2033 |
| Segmentation |
|
Table of Contents
- 1. Introduction
- 1.1. Research Scope
- 1.2. Market Segmentation
- 1.3. Research Methodology
- 1.4. Definitions and Assumptions
- 2. Executive Summary
- 2.1. Introduction
- 3. Market Dynamics
- 3.1. Introduction
- 3.2. Market Drivers
- 3.3. Market Restrains
- 3.4. Market Trends
- 3.4.1. The Infantry Fighting Vehicle Segment to Dominate Market Share
- 4. Market Factor Analysis
- 4.1. Porters Five Forces
- 4.2. Supply/Value Chain
- 4.3. PESTEL analysis
- 4.4. Market Entropy
- 4.5. Patent/Trademark Analysis
- 5. Global Armored Vehicle Procurement and Upgrade Industry Analysis, Insights and Forecast, 2019-2031
- 5.1. Market Analysis, Insights and Forecast - by Vehicle Type
- 5.1.1. Armored Personnel Carrier (APC)
- 5.1.2. Infantry Fighting Vehicle (IFV)
- 5.1.3. Mine-resistant Ambush Protected (MRAP)
- 5.1.4. Main Battle Tank (MBT)
- 5.1.5. Other Vehicle Types
- 5.2. Market Analysis, Insights and Forecast - by Region
- 5.2.1. North America
- 5.2.2. Europe
- 5.2.3. Asia Pacific
- 5.2.4. Latin America
- 5.2.5. Middle East
- 5.2.6. United Arab Emirates
- 5.1. Market Analysis, Insights and Forecast - by Vehicle Type
- 6. North America Armored Vehicle Procurement and Upgrade Industry Analysis, Insights and Forecast, 2019-2031
- 6.1. Market Analysis, Insights and Forecast - by Vehicle Type
- 6.1.1. Armored Personnel Carrier (APC)
- 6.1.2. Infantry Fighting Vehicle (IFV)
- 6.1.3. Mine-resistant Ambush Protected (MRAP)
- 6.1.4. Main Battle Tank (MBT)
- 6.1.5. Other Vehicle Types
- 6.1. Market Analysis, Insights and Forecast - by Vehicle Type
- 7. Europe Armored Vehicle Procurement and Upgrade Industry Analysis, Insights and Forecast, 2019-2031
- 7.1. Market Analysis, Insights and Forecast - by Vehicle Type
- 7.1.1. Armored Personnel Carrier (APC)
- 7.1.2. Infantry Fighting Vehicle (IFV)
- 7.1.3. Mine-resistant Ambush Protected (MRAP)
- 7.1.4. Main Battle Tank (MBT)
- 7.1.5. Other Vehicle Types
- 7.1. Market Analysis, Insights and Forecast - by Vehicle Type
- 8. Asia Pacific Armored Vehicle Procurement and Upgrade Industry Analysis, Insights and Forecast, 2019-2031
- 8.1. Market Analysis, Insights and Forecast - by Vehicle Type
- 8.1.1. Armored Personnel Carrier (APC)
- 8.1.2. Infantry Fighting Vehicle (IFV)
- 8.1.3. Mine-resistant Ambush Protected (MRAP)
- 8.1.4. Main Battle Tank (MBT)
- 8.1.5. Other Vehicle Types
- 8.1. Market Analysis, Insights and Forecast - by Vehicle Type
- 9. Latin America Armored Vehicle Procurement and Upgrade Industry Analysis, Insights and Forecast, 2019-2031
- 9.1. Market Analysis, Insights and Forecast - by Vehicle Type
- 9.1.1. Armored Personnel Carrier (APC)
- 9.1.2. Infantry Fighting Vehicle (IFV)
- 9.1.3. Mine-resistant Ambush Protected (MRAP)
- 9.1.4. Main Battle Tank (MBT)
- 9.1.5. Other Vehicle Types
- 9.1. Market Analysis, Insights and Forecast - by Vehicle Type
- 10. Middle East Armored Vehicle Procurement and Upgrade Industry Analysis, Insights and Forecast, 2019-2031
- 10.1. Market Analysis, Insights and Forecast - by Vehicle Type
- 10.1.1. Armored Personnel Carrier (APC)
- 10.1.2. Infantry Fighting Vehicle (IFV)
- 10.1.3. Mine-resistant Ambush Protected (MRAP)
- 10.1.4. Main Battle Tank (MBT)
- 10.1.5. Other Vehicle Types
- 10.1. Market Analysis, Insights and Forecast - by Vehicle Type
- 11. United Arab Emirates Armored Vehicle Procurement and Upgrade Industry Analysis, Insights and Forecast, 2019-2031
- 11.1. Market Analysis, Insights and Forecast - by Vehicle Type
- 11.1.1. Armored Personnel Carrier (APC)
- 11.1.2. Infantry Fighting Vehicle (IFV)
- 11.1.3. Mine-resistant Ambush Protected (MRAP)
- 11.1.4. Main Battle Tank (MBT)
- 11.1.5. Other Vehicle Types
- 11.1. Market Analysis, Insights and Forecast - by Vehicle Type
- 12. North America Armored Vehicle Procurement and Upgrade Industry Analysis, Insights and Forecast, 2019-2031
- 12.1. Market Analysis, Insights and Forecast - By Country/Sub-region
- 12.1.1 United States
- 12.1.2 Canada
- 13. Europe Armored Vehicle Procurement and Upgrade Industry Analysis, Insights and Forecast, 2019-2031
- 13.1. Market Analysis, Insights and Forecast - By Country/Sub-region
- 13.1.1 United Kingdom
- 13.1.2 France
- 13.1.3 Germany
- 13.1.4 Russia
- 13.1.5 Rest of Europe
- 14. Asia Pacific Armored Vehicle Procurement and Upgrade Industry Analysis, Insights and Forecast, 2019-2031
- 14.1. Market Analysis, Insights and Forecast - By Country/Sub-region
- 14.1.1 China
- 14.1.2 India
- 14.1.3 Japan
- 14.1.4 South Korea
- 14.1.5 Australia
- 14.1.6 Rest of Asia Pacific
- 15. Latin America Armored Vehicle Procurement and Upgrade Industry Analysis, Insights and Forecast, 2019-2031
- 15.1. Market Analysis, Insights and Forecast - By Country/Sub-region
- 15.1.1 Brazil
- 15.1.2 Mexico
- 15.1.3 Rest of Latin America
- 16. Middle East Armored Vehicle Procurement and Upgrade Industry Analysis, Insights and Forecast, 2019-2031
- 16.1. Market Analysis, Insights and Forecast - By Country/Sub-region
- 16.1.1.
- 17. United Arab Emirates Armored Vehicle Procurement and Upgrade Industry Analysis, Insights and Forecast, 2019-2031
- 17.1. Market Analysis, Insights and Forecast - By Country/Sub-region
- 17.1.1 Saudi Arabia
- 17.1.2 Turkey
- 17.1.3 South Africa
- 17.1.4 Rest of Middle East and Africa
- 18. Competitive Analysis
- 18.1. Global Market Share Analysis 2024
- 18.2. Company Profiles
- 18.2.1 Textron Inc
- 18.2.1.1. Overview
- 18.2.1.2. Products
- 18.2.1.3. SWOT Analysis
- 18.2.1.4. Recent Developments
- 18.2.1.5. Financials (Based on Availability)
- 18.2.2 RUAG International Holding Ltd
- 18.2.2.1. Overview
- 18.2.2.2. Products
- 18.2.2.3. SWOT Analysis
- 18.2.2.4. Recent Developments
- 18.2.2.5. Financials (Based on Availability)
- 18.2.3 FNSS Savunma Sistemleri A Ş
- 18.2.3.1. Overview
- 18.2.3.2. Products
- 18.2.3.3. SWOT Analysis
- 18.2.3.4. Recent Developments
- 18.2.3.5. Financials (Based on Availability)
- 18.2.4 THALES
- 18.2.4.1. Overview
- 18.2.4.2. Products
- 18.2.4.3. SWOT Analysis
- 18.2.4.4. Recent Developments
- 18.2.4.5. Financials (Based on Availability)
- 18.2.5 Oshkosh Corporation
- 18.2.5.1. Overview
- 18.2.5.2. Products
- 18.2.5.3. SWOT Analysis
- 18.2.5.4. Recent Developments
- 18.2.5.5. Financials (Based on Availability)
- 18.2.6 General Dynamics Corporation
- 18.2.6.1. Overview
- 18.2.6.2. Products
- 18.2.6.3. SWOT Analysis
- 18.2.6.4. Recent Developments
- 18.2.6.5. Financials (Based on Availability)
- 18.2.7 Rheinmetall AG
- 18.2.7.1. Overview
- 18.2.7.2. Products
- 18.2.7.3. SWOT Analysis
- 18.2.7.4. Recent Developments
- 18.2.7.5. Financials (Based on Availability)
- 18.2.8 Elbit Systems Ltd
- 18.2.8.1. Overview
- 18.2.8.2. Products
- 18.2.8.3. SWOT Analysis
- 18.2.8.4. Recent Developments
- 18.2.8.5. Financials (Based on Availability)
- 18.2.9 The CMI Group Inc
- 18.2.9.1. Overview
- 18.2.9.2. Products
- 18.2.9.3. SWOT Analysis
- 18.2.9.4. Recent Developments
- 18.2.9.5. Financials (Based on Availability)
- 18.2.10 BMC Otomotiv Sanayi ve Ticaret A Ş
- 18.2.10.1. Overview
- 18.2.10.2. Products
- 18.2.10.3. SWOT Analysis
- 18.2.10.4. Recent Developments
- 18.2.10.5. Financials (Based on Availability)
- 18.2.11 KNDS N V
- 18.2.11.1. Overview
- 18.2.11.2. Products
- 18.2.11.3. SWOT Analysis
- 18.2.11.4. Recent Developments
- 18.2.11.5. Financials (Based on Availability)
- 18.2.12 Streit Grou
- 18.2.12.1. Overview
- 18.2.12.2. Products
- 18.2.12.3. SWOT Analysis
- 18.2.12.4. Recent Developments
- 18.2.12.5. Financials (Based on Availability)
- 18.2.13 IVECO S p A
- 18.2.13.1. Overview
- 18.2.13.2. Products
- 18.2.13.3. SWOT Analysis
- 18.2.13.4. Recent Developments
- 18.2.13.5. Financials (Based on Availability)
- 18.2.14 BAE Systems plc
- 18.2.14.1. Overview
- 18.2.14.2. Products
- 18.2.14.3. SWOT Analysis
- 18.2.14.4. Recent Developments
- 18.2.14.5. Financials (Based on Availability)
- 18.2.1 Textron Inc
List of Figures
- Figure 1: Global Armored Vehicle Procurement and Upgrade Industry Revenue Breakdown (Million, %) by Region 2024 & 2032
- Figure 2: North America Armored Vehicle Procurement and Upgrade Industry Revenue (Million), by Country 2024 & 2032
- Figure 3: North America Armored Vehicle Procurement and Upgrade Industry Revenue Share (%), by Country 2024 & 2032
- Figure 4: Europe Armored Vehicle Procurement and Upgrade Industry Revenue (Million), by Country 2024 & 2032
- Figure 5: Europe Armored Vehicle Procurement and Upgrade Industry Revenue Share (%), by Country 2024 & 2032
- Figure 6: Asia Pacific Armored Vehicle Procurement and Upgrade Industry Revenue (Million), by Country 2024 & 2032
- Figure 7: Asia Pacific Armored Vehicle Procurement and Upgrade Industry Revenue Share (%), by Country 2024 & 2032
- Figure 8: Latin America Armored Vehicle Procurement and Upgrade Industry Revenue (Million), by Country 2024 & 2032
- Figure 9: Latin America Armored Vehicle Procurement and Upgrade Industry Revenue Share (%), by Country 2024 & 2032
- Figure 10: Middle East Armored Vehicle Procurement and Upgrade Industry Revenue (Million), by Country 2024 & 2032
- Figure 11: Middle East Armored Vehicle Procurement and Upgrade Industry Revenue Share (%), by Country 2024 & 2032
- Figure 12: United Arab Emirates Armored Vehicle Procurement and Upgrade Industry Revenue (Million), by Country 2024 & 2032
- Figure 13: United Arab Emirates Armored Vehicle Procurement and Upgrade Industry Revenue Share (%), by Country 2024 & 2032
- Figure 14: North America Armored Vehicle Procurement and Upgrade Industry Revenue (Million), by Vehicle Type 2024 & 2032
- Figure 15: North America Armored Vehicle Procurement and Upgrade Industry Revenue Share (%), by Vehicle Type 2024 & 2032
- Figure 16: North America Armored Vehicle Procurement and Upgrade Industry Revenue (Million), by Country 2024 & 2032
- Figure 17: North America Armored Vehicle Procurement and Upgrade Industry Revenue Share (%), by Country 2024 & 2032
- Figure 18: Europe Armored Vehicle Procurement and Upgrade Industry Revenue (Million), by Vehicle Type 2024 & 2032
- Figure 19: Europe Armored Vehicle Procurement and Upgrade Industry Revenue Share (%), by Vehicle Type 2024 & 2032
- Figure 20: Europe Armored Vehicle Procurement and Upgrade Industry Revenue (Million), by Country 2024 & 2032
- Figure 21: Europe Armored Vehicle Procurement and Upgrade Industry Revenue Share (%), by Country 2024 & 2032
- Figure 22: Asia Pacific Armored Vehicle Procurement and Upgrade Industry Revenue (Million), by Vehicle Type 2024 & 2032
- Figure 23: Asia Pacific Armored Vehicle Procurement and Upgrade Industry Revenue Share (%), by Vehicle Type 2024 & 2032
- Figure 24: Asia Pacific Armored Vehicle Procurement and Upgrade Industry Revenue (Million), by Country 2024 & 2032
- Figure 25: Asia Pacific Armored Vehicle Procurement and Upgrade Industry Revenue Share (%), by Country 2024 & 2032
- Figure 26: Latin America Armored Vehicle Procurement and Upgrade Industry Revenue (Million), by Vehicle Type 2024 & 2032
- Figure 27: Latin America Armored Vehicle Procurement and Upgrade Industry Revenue Share (%), by Vehicle Type 2024 & 2032
- Figure 28: Latin America Armored Vehicle Procurement and Upgrade Industry Revenue (Million), by Country 2024 & 2032
- Figure 29: Latin America Armored Vehicle Procurement and Upgrade Industry Revenue Share (%), by Country 2024 & 2032
- Figure 30: Middle East Armored Vehicle Procurement and Upgrade Industry Revenue (Million), by Vehicle Type 2024 & 2032
- Figure 31: Middle East Armored Vehicle Procurement and Upgrade Industry Revenue Share (%), by Vehicle Type 2024 & 2032
- Figure 32: Middle East Armored Vehicle Procurement and Upgrade Industry Revenue (Million), by Country 2024 & 2032
- Figure 33: Middle East Armored Vehicle Procurement and Upgrade Industry Revenue Share (%), by Country 2024 & 2032
- Figure 34: United Arab Emirates Armored Vehicle Procurement and Upgrade Industry Revenue (Million), by Vehicle Type 2024 & 2032
- Figure 35: United Arab Emirates Armored Vehicle Procurement and Upgrade Industry Revenue Share (%), by Vehicle Type 2024 & 2032
- Figure 36: United Arab Emirates Armored Vehicle Procurement and Upgrade Industry Revenue (Million), by Country 2024 & 2032
- Figure 37: United Arab Emirates Armored Vehicle Procurement and Upgrade Industry Revenue Share (%), by Country 2024 & 2032
List of Tables
- Table 1: Global Armored Vehicle Procurement and Upgrade Industry Revenue Million Forecast, by Region 2019 & 2032
- Table 2: Global Armored Vehicle Procurement and Upgrade Industry Revenue Million Forecast, by Vehicle Type 2019 & 2032
- Table 3: Global Armored Vehicle Procurement and Upgrade Industry Revenue Million Forecast, by Region 2019 & 2032
- Table 4: Global Armored Vehicle Procurement and Upgrade Industry Revenue Million Forecast, by Country 2019 & 2032
- Table 5: United States Armored Vehicle Procurement and Upgrade Industry Revenue (Million) Forecast, by Application 2019 & 2032
- Table 6: Canada Armored Vehicle Procurement and Upgrade Industry Revenue (Million) Forecast, by Application 2019 & 2032
- Table 7: Global Armored Vehicle Procurement and Upgrade Industry Revenue Million Forecast, by Country 2019 & 2032
- Table 8: United Kingdom Armored Vehicle Procurement and Upgrade Industry Revenue (Million) Forecast, by Application 2019 & 2032
- Table 9: France Armored Vehicle Procurement and Upgrade Industry Revenue (Million) Forecast, by Application 2019 & 2032
- Table 10: Germany Armored Vehicle Procurement and Upgrade Industry Revenue (Million) Forecast, by Application 2019 & 2032
- Table 11: Russia Armored Vehicle Procurement and Upgrade Industry Revenue (Million) Forecast, by Application 2019 & 2032
- Table 12: Rest of Europe Armored Vehicle Procurement and Upgrade Industry Revenue (Million) Forecast, by Application 2019 & 2032
- Table 13: Global Armored Vehicle Procurement and Upgrade Industry Revenue Million Forecast, by Country 2019 & 2032
- Table 14: China Armored Vehicle Procurement and Upgrade Industry Revenue (Million) Forecast, by Application 2019 & 2032
- Table 15: India Armored Vehicle Procurement and Upgrade Industry Revenue (Million) Forecast, by Application 2019 & 2032
- Table 16: Japan Armored Vehicle Procurement and Upgrade Industry Revenue (Million) Forecast, by Application 2019 & 2032
- Table 17: South Korea Armored Vehicle Procurement and Upgrade Industry Revenue (Million) Forecast, by Application 2019 & 2032
- Table 18: Australia Armored Vehicle Procurement and Upgrade Industry Revenue (Million) Forecast, by Application 2019 & 2032
- Table 19: Rest of Asia Pacific Armored Vehicle Procurement and Upgrade Industry Revenue (Million) Forecast, by Application 2019 & 2032
- Table 20: Global Armored Vehicle Procurement and Upgrade Industry Revenue Million Forecast, by Country 2019 & 2032
- Table 21: Brazil Armored Vehicle Procurement and Upgrade Industry Revenue (Million) Forecast, by Application 2019 & 2032
- Table 22: Mexico Armored Vehicle Procurement and Upgrade Industry Revenue (Million) Forecast, by Application 2019 & 2032
- Table 23: Rest of Latin America Armored Vehicle Procurement and Upgrade Industry Revenue (Million) Forecast, by Application 2019 & 2032
- Table 24: Global Armored Vehicle Procurement and Upgrade Industry Revenue Million Forecast, by Country 2019 & 2032
- Table 25: Armored Vehicle Procurement and Upgrade Industry Revenue (Million) Forecast, by Application 2019 & 2032
- Table 26: Global Armored Vehicle Procurement and Upgrade Industry Revenue Million Forecast, by Country 2019 & 2032
- Table 27: Saudi Arabia Armored Vehicle Procurement and Upgrade Industry Revenue (Million) Forecast, by Application 2019 & 2032
- Table 28: Turkey Armored Vehicle Procurement and Upgrade Industry Revenue (Million) Forecast, by Application 2019 & 2032
- Table 29: South Africa Armored Vehicle Procurement and Upgrade Industry Revenue (Million) Forecast, by Application 2019 & 2032
- Table 30: Rest of Middle East and Africa Armored Vehicle Procurement and Upgrade Industry Revenue (Million) Forecast, by Application 2019 & 2032
- Table 31: Global Armored Vehicle Procurement and Upgrade Industry Revenue Million Forecast, by Vehicle Type 2019 & 2032
- Table 32: Global Armored Vehicle Procurement and Upgrade Industry Revenue Million Forecast, by Country 2019 & 2032
- Table 33: United States Armored Vehicle Procurement and Upgrade Industry Revenue (Million) Forecast, by Application 2019 & 2032
- Table 34: Canada Armored Vehicle Procurement and Upgrade Industry Revenue (Million) Forecast, by Application 2019 & 2032
- Table 35: Global Armored Vehicle Procurement and Upgrade Industry Revenue Million Forecast, by Vehicle Type 2019 & 2032
- Table 36: Global Armored Vehicle Procurement and Upgrade Industry Revenue Million Forecast, by Country 2019 & 2032
- Table 37: United Kingdom Armored Vehicle Procurement and Upgrade Industry Revenue (Million) Forecast, by Application 2019 & 2032
- Table 38: France Armored Vehicle Procurement and Upgrade Industry Revenue (Million) Forecast, by Application 2019 & 2032
- Table 39: Germany Armored Vehicle Procurement and Upgrade Industry Revenue (Million) Forecast, by Application 2019 & 2032
- Table 40: Russia Armored Vehicle Procurement and Upgrade Industry Revenue (Million) Forecast, by Application 2019 & 2032
- Table 41: Rest of Europe Armored Vehicle Procurement and Upgrade Industry Revenue (Million) Forecast, by Application 2019 & 2032
- Table 42: Global Armored Vehicle Procurement and Upgrade Industry Revenue Million Forecast, by Vehicle Type 2019 & 2032
- Table 43: Global Armored Vehicle Procurement and Upgrade Industry Revenue Million Forecast, by Country 2019 & 2032
- Table 44: China Armored Vehicle Procurement and Upgrade Industry Revenue (Million) Forecast, by Application 2019 & 2032
- Table 45: India Armored Vehicle Procurement and Upgrade Industry Revenue (Million) Forecast, by Application 2019 & 2032
- Table 46: Japan Armored Vehicle Procurement and Upgrade Industry Revenue (Million) Forecast, by Application 2019 & 2032
- Table 47: South Korea Armored Vehicle Procurement and Upgrade Industry Revenue (Million) Forecast, by Application 2019 & 2032
- Table 48: Australia Armored Vehicle Procurement and Upgrade Industry Revenue (Million) Forecast, by Application 2019 & 2032
- Table 49: Rest of Asia Pacific Armored Vehicle Procurement and Upgrade Industry Revenue (Million) Forecast, by Application 2019 & 2032
- Table 50: Global Armored Vehicle Procurement and Upgrade Industry Revenue Million Forecast, by Vehicle Type 2019 & 2032
- Table 51: Global Armored Vehicle Procurement and Upgrade Industry Revenue Million Forecast, by Country 2019 & 2032
- Table 52: Brazil Armored Vehicle Procurement and Upgrade Industry Revenue (Million) Forecast, by Application 2019 & 2032
- Table 53: Mexico Armored Vehicle Procurement and Upgrade Industry Revenue (Million) Forecast, by Application 2019 & 2032
- Table 54: Rest of Latin America Armored Vehicle Procurement and Upgrade Industry Revenue (Million) Forecast, by Application 2019 & 2032
- Table 55: Global Armored Vehicle Procurement and Upgrade Industry Revenue Million Forecast, by Vehicle Type 2019 & 2032
- Table 56: Global Armored Vehicle Procurement and Upgrade Industry Revenue Million Forecast, by Country 2019 & 2032
- Table 57: Global Armored Vehicle Procurement and Upgrade Industry Revenue Million Forecast, by Vehicle Type 2019 & 2032
- Table 58: Global Armored Vehicle Procurement and Upgrade Industry Revenue Million Forecast, by Country 2019 & 2032
- Table 59: Saudi Arabia Armored Vehicle Procurement and Upgrade Industry Revenue (Million) Forecast, by Application 2019 & 2032
- Table 60: Turkey Armored Vehicle Procurement and Upgrade Industry Revenue (Million) Forecast, by Application 2019 & 2032
- Table 61: South Africa Armored Vehicle Procurement and Upgrade Industry Revenue (Million) Forecast, by Application 2019 & 2032
- Table 62: Rest of Middle East and Africa Armored Vehicle Procurement and Upgrade Industry Revenue (Million) Forecast, by Application 2019 & 2032
Frequently Asked Questions
1. What is the projected Compound Annual Growth Rate (CAGR) of the Armored Vehicle Procurement and Upgrade Industry?
The projected CAGR is approximately 4.23%.
2. Which companies are prominent players in the Armored Vehicle Procurement and Upgrade Industry?
Key companies in the market include Textron Inc, RUAG International Holding Ltd, FNSS Savunma Sistemleri A Ş, THALES, Oshkosh Corporation, General Dynamics Corporation, Rheinmetall AG, Elbit Systems Ltd, The CMI Group Inc, BMC Otomotiv Sanayi ve Ticaret A Ş, KNDS N V, Streit Grou, IVECO S p A, BAE Systems plc.
3. What are the main segments of the Armored Vehicle Procurement and Upgrade Industry?
The market segments include Vehicle Type.
4. Can you provide details about the market size?
The market size is estimated to be USD 6.66 Million as of 2022.
5. What are some drivers contributing to market growth?
N/A
6. What are the notable trends driving market growth?
The Infantry Fighting Vehicle Segment to Dominate Market Share.
7. Are there any restraints impacting market growth?
N/A
8. Can you provide examples of recent developments in the market?
May 2023: Elbit Systems Ltd. was awarded a contract under the British Army's Project Vulcan to maintain and operate the Ground Manoeuvre Synthetic Trainer system (GMST), the Boxer armored vehicles, and Challenger 3 tanks. The contract includes a training management system with high-fidelity driver trainers and cabins for turret and armament variants.
9. What pricing options are available for accessing the report?
Pricing options include single-user, multi-user, and enterprise licenses priced at USD 4750, USD 5250, and USD 8750 respectively.
10. Is the market size provided in terms of value or volume?
The market size is provided in terms of value, measured in Million.
11. Are there any specific market keywords associated with the report?
Yes, the market keyword associated with the report is "Armored Vehicle Procurement and Upgrade Industry," which aids in identifying and referencing the specific market segment covered.
12. How do I determine which pricing option suits my needs best?
The pricing options vary based on user requirements and access needs. Individual users may opt for single-user licenses, while businesses requiring broader access may choose multi-user or enterprise licenses for cost-effective access to the report.
13. Are there any additional resources or data provided in the Armored Vehicle Procurement and Upgrade Industry report?
While the report offers comprehensive insights, it's advisable to review the specific contents or supplementary materials provided to ascertain if additional resources or data are available.
14. How can I stay updated on further developments or reports in the Armored Vehicle Procurement and Upgrade Industry?
To stay informed about further developments, trends, and reports in the Armored Vehicle Procurement and Upgrade Industry, consider subscribing to industry newsletters, following relevant companies and organizations, or regularly checking reputable industry news sources and publications.
Methodology
Step 1 - Identification of Relevant Samples Size from Population Database


Step 2 - Approaches for Defining Global Market Size (Value, Volume* & Price*)

Note*: In applicable scenarios
Step 3 - Data Sources
Primary Research
- Web Analytics
- Survey Reports
- Research Institute
- Latest Research Reports
- Opinion Leaders
Secondary Research
- Annual Reports
- White Paper
- Latest Press Release
- Industry Association
- Paid Database
- Investor Presentations

Step 4 - Data Triangulation
Involves using different sources of information in order to increase the validity of a study
These sources are likely to be stakeholders in a program - participants, other researchers, program staff, other community members, and so on.
Then we put all data in single framework & apply various statistical tools to find out the dynamic on the market.
During the analysis stage, feedback from the stakeholder groups would be compared to determine areas of agreement as well as areas of divergence
