

Key Insights
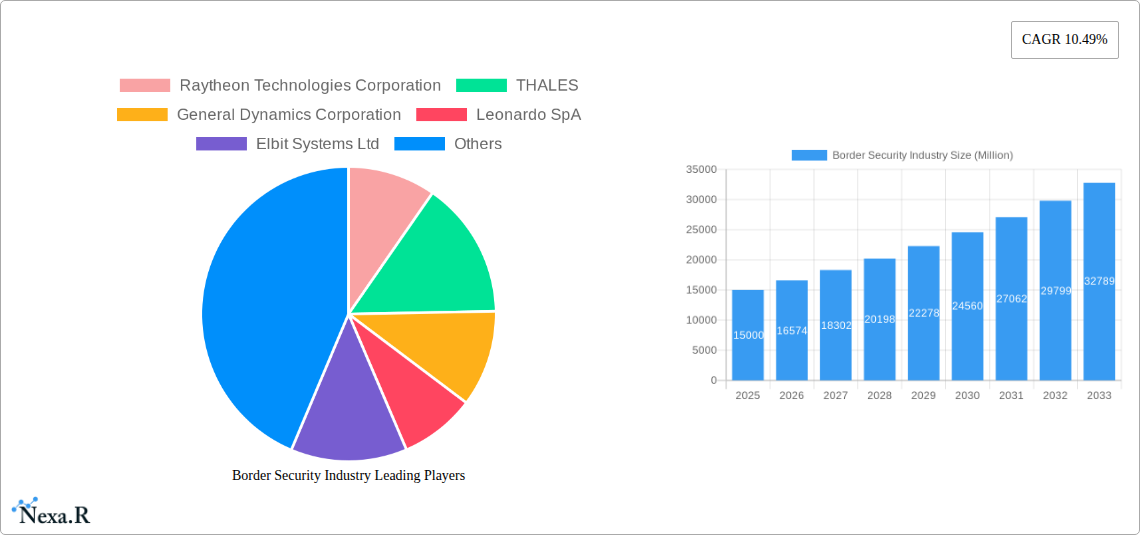
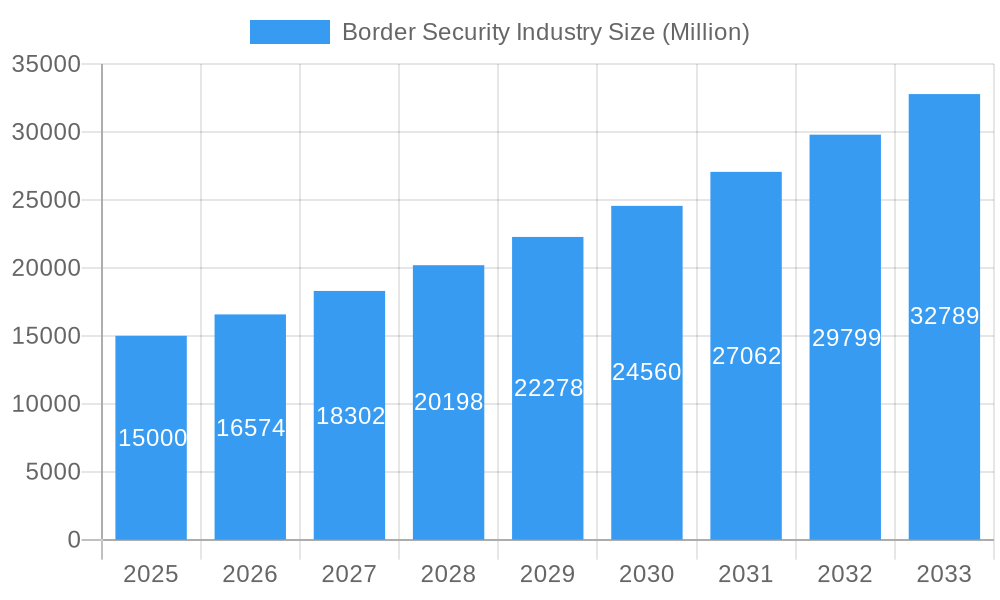
The global border security market, valued at approximately $XX million in 2025, is experiencing robust growth, projected to expand at a Compound Annual Growth Rate (CAGR) of 10.49% from 2025 to 2033. This growth is driven by escalating global security concerns, including terrorism, cross-border crime, and illegal immigration. Technological advancements, such as the deployment of advanced surveillance systems (including AI-powered video analytics, biometric identification, and drone technology), are significantly impacting the market. Furthermore, increasing government investments in infrastructure and border security modernization initiatives across various regions are fueling market expansion. The land-based segment currently dominates the market, due to its established infrastructure and wide-scale deployment, but the air and sea segments are expected to witness significant growth driven by technological advancements and rising adoption of integrated surveillance solutions. Key players like Raytheon Technologies, Thales, and General Dynamics are leading the innovation drive, constantly developing and deploying cutting-edge solutions to address evolving border security challenges.
Border Security Industry Market Size (In Billion)
The North American region, particularly the United States and Canada, currently holds the largest market share due to substantial government funding and high technological adoption. However, the Asia-Pacific region is predicted to show the fastest growth, propelled by rising economic activity, increasing urbanization, and stricter border control policies in rapidly developing economies like China and India. Despite significant growth opportunities, the market faces certain challenges, including high initial investment costs for advanced technologies, concerns around data privacy and security in the context of biometric and surveillance technologies, and the need for robust regulatory frameworks governing the use of advanced border security technologies. Nevertheless, the persistent need for enhanced border security measures across the globe suggests a promising outlook for the market in the coming years, with continued innovation and substantial investment expected to drive this growth trajectory.
Border Security Industry Company Market Share
Border Security Industry Market Report: 2019-2033
This comprehensive report provides an in-depth analysis of the global Border Security Industry, encompassing market dynamics, growth trends, key players, and future outlook. With a focus on the parent market (Border Security) and its child markets (Land, Air, and Sea platforms), this report offers invaluable insights for industry professionals, investors, and policymakers. The study period covers 2019-2033, with a base year of 2025 and a forecast period of 2025-2033. The market size is presented in million USD.
Border Security Industry Market Dynamics & Structure
The global border security market, valued at xx million in 2024, is characterized by moderate concentration, with a few major players holding significant market share. Technological innovation, driven by increasing threats and the need for enhanced security measures, is a primary growth driver. Stringent regulatory frameworks and evolving geopolitical landscapes significantly impact market dynamics. While traditional solutions dominate, the emergence of advanced technologies presents both opportunities and challenges. Mergers and acquisitions (M&A) activity remains steady, with an estimated xx deals completed in 2024, consolidating market share and fostering technological advancements.
- Market Concentration: Moderately concentrated, with top 5 players holding approximately xx% market share in 2024.
- Technological Innovation: AI, biometrics, and drone technology are key drivers, but high R&D costs and integration complexities pose barriers.
- Regulatory Frameworks: Varying international and national regulations create complexity for market players.
- Competitive Product Substitutes: Limited direct substitutes exist, but cost optimization and efficiency remain key competitive factors.
- End-User Demographics: Government agencies (defense, customs, immigration) represent the dominant end-user segment.
- M&A Trends: Consolidation through acquisitions is expected to continue, driven by the need for technological advancements and broader market reach.
Border Security Industry Growth Trends & Insights
The border security market demonstrates robust growth, with a projected Compound Annual Growth Rate (CAGR) of xx% during the forecast period (2025-2033). This growth is fueled by escalating global security concerns, increasing cross-border crime, and the demand for advanced surveillance technologies. Market penetration of newer technologies, like AI-powered analytics and biometric systems, is steadily rising. Shifts in consumer behavior, primarily towards prioritizing security and efficiency, are driving market demand. The market is expected to reach xx million by 2033.
Dominant Regions, Countries, or Segments in Border Security Industry
The Air segment currently dominates the border security market, driven by increasing investments in aerial surveillance systems and advancements in drone technology. North America and Europe hold significant market shares, fueled by robust government budgets and technologically advanced infrastructure. However, the Asia-Pacific region exhibits the fastest growth, fueled by rising geopolitical tensions and increased investments in security infrastructure.
- Key Drivers in the Air Segment: Increased cross-border threats, advancements in drone technology, and government investments in aerial surveillance.
- North America Dominance: Strong government funding, advanced technological capabilities, and robust security infrastructure.
- Asia-Pacific Growth: Rising geopolitical concerns, increasing cross-border crime, and substantial government investments.
Border Security Industry Product Landscape
The border security product landscape is characterized by a wide range of solutions, from traditional perimeter security systems to advanced technologies like AI-powered analytics and biometric authentication. These products offer unique selling propositions (USPs) tailored to specific security needs, including improved accuracy, reduced response times, and enhanced interoperability. Continuous technological advancements are driving the development of more sophisticated and integrated solutions.
Key Drivers, Barriers & Challenges in Border Security Industry
Key Drivers:
- Increased cross-border terrorism and crime.
- Rising geopolitical instability.
- Technological advancements in surveillance and security technologies.
- Stringent government regulations and increased security budgets.
Key Challenges:
- High initial investment costs for advanced technologies.
- Complexity in integrating diverse systems.
- Data privacy and security concerns.
- Supply chain disruptions impacting component availability. (Estimated xx% impact on market growth in 2024).
Emerging Opportunities in Border Security Industry
- Expanding applications of AI and machine learning for threat detection and predictive analytics.
- Growing demand for integrated and interoperable security systems.
- Untapped potential in emerging markets with less developed security infrastructure.
- Development of advanced biometric technologies for enhanced identity verification.
Growth Accelerators in the Border Security Industry
Technological breakthroughs in areas like AI, IoT, and cloud computing are accelerating market growth. Strategic partnerships between technology providers and government agencies are facilitating faster adoption and integration of advanced solutions. Furthermore, expansion into new geographic markets, particularly in regions with emerging security needs, presents significant growth opportunities.
Key Players Shaping the Border Security Industry Market
Notable Milestones in Border Security Industry Sector
- March 2023: Accenture Federal Services secures a USD 380 million contract from US Customs and Border Protection (CBP) for IT infrastructure modernization.
- October 2022: The Indian Army initiates procurement of 80 mini remotely piloted aircraft systems and 1,000 surveillance copters.
In-Depth Border Security Industry Market Outlook
The border security market is poised for continued growth, driven by sustained technological advancements and increasing global security concerns. Strategic partnerships and expansion into new markets will play a crucial role in shaping the future of the industry. The market offers significant opportunities for companies capable of delivering innovative, integrated, and cost-effective solutions.
Border Security Industry Segmentation
- 1. Production Analysis
- 2. Consumption Analysis
- 3. Import Market Analysis (Value & Volume)
- 4. Export Market Analysis (Value & Volume)
- 5. Price Trend Analysis
Border Security Industry Segmentation By Geography
-
1. North America
- 1.1. United States
- 1.2. Canada
- 1.3. Mexico
-
2. South America
- 2.1. Brazil
- 2.2. Argentina
- 2.3. Rest of South America
-
3. Europe
- 3.1. United Kingdom
- 3.2. Germany
- 3.3. France
- 3.4. Italy
- 3.5. Spain
- 3.6. Russia
- 3.7. Benelux
- 3.8. Nordics
- 3.9. Rest of Europe
-
4. Middle East & Africa
- 4.1. Turkey
- 4.2. Israel
- 4.3. GCC
- 4.4. North Africa
- 4.5. South Africa
- 4.6. Rest of Middle East & Africa
-
5. Asia Pacific
- 5.1. China
- 5.2. India
- 5.3. Japan
- 5.4. South Korea
- 5.5. ASEAN
- 5.6. Oceania
- 5.7. Rest of Asia Pacific
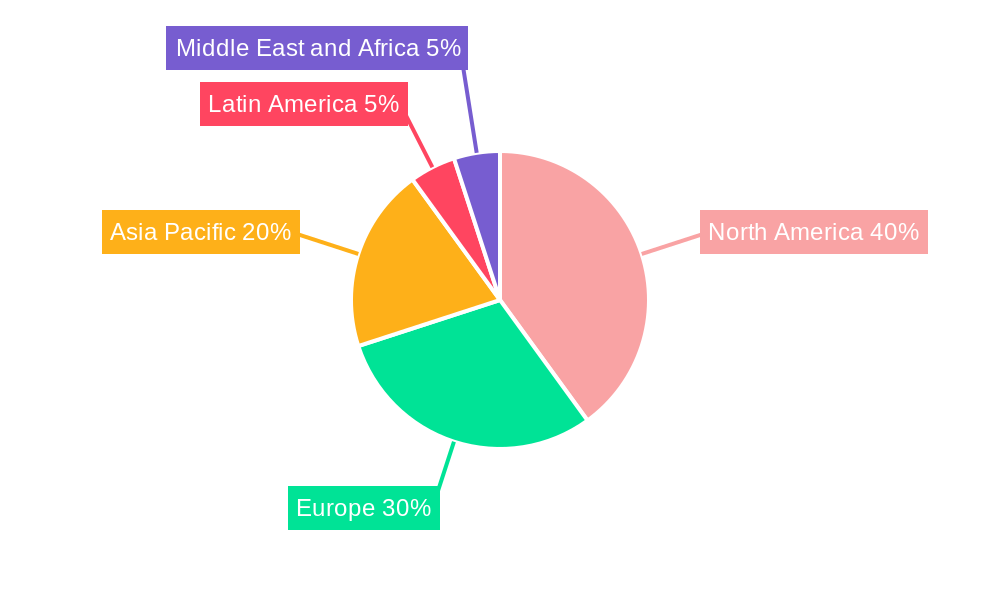
Border Security Industry Regional Market Share
Geographic Coverage of Border Security Industry
Border Security Industry REPORT HIGHLIGHTS
| Aspects | Details |
|---|---|
| Study Period | 2020-2034 |
| Base Year | 2025 |
| Estimated Year | 2026 |
| Forecast Period | 2026-2034 |
| Historical Period | 2020-2025 |
| Growth Rate | CAGR of 6.62% from 2020-2034 |
| Segmentation |
|
Table of Contents
- 1. Introduction
- 1.1. Research Scope
- 1.2. Market Segmentation
- 1.3. Research Objective
- 1.4. Definitions and Assumptions
- 2. Executive Summary
- 2.1. Market Snapshot
- 3. Market Dynamics
- 3.1. Market Drivers
- 3.2. Market Restrains
- 3.3. Market Trends
- 3.4. Market Opportunities
- 4. Market Factor Analysis
- 4.1. Porters Five Forces
- 4.1.1. Bargaining Power of Suppliers
- 4.1.2. Bargaining Power of Buyers
- 4.1.3. Threat of New Entrants
- 4.1.4. Threat of Substitutes
- 4.1.5. Competitive Rivalry
- 4.2. PESTEL analysis
- 4.3. BCG Analysis
- 4.3.1. Stars (High Growth, High Market Share)
- 4.3.2. Cash Cows (Low Growth, High Market Share)
- 4.3.3. Question Mark (High Growth, Low Market Share)
- 4.3.4. Dogs (Low Growth, Low Market Share)
- 4.4. Ansoff Matrix Analysis
- 4.5. Supply Chain Analysis
- 4.6. Regulatory Landscape
- 4.7. Current Market Potential and Opportunity Assessment (TAM–SAM–SOM Framework)
- 4.8. NRP Analyst Note
- 4.1. Porters Five Forces
- 5. Market Analysis, Insights and Forecast 2021-2033
- 5.1. Market Analysis, Insights and Forecast - by Production Analysis
- 5.2. Market Analysis, Insights and Forecast - by Consumption Analysis
- 5.3. Market Analysis, Insights and Forecast - by Import Market Analysis (Value & Volume)
- 5.4. Market Analysis, Insights and Forecast - by Export Market Analysis (Value & Volume)
- 5.5. Market Analysis, Insights and Forecast - by Price Trend Analysis
- 5.6. Market Analysis, Insights and Forecast - by Region
- 5.6.1. North America
- 5.6.2. South America
- 5.6.3. Europe
- 5.6.4. Middle East & Africa
- 5.6.5. Asia Pacific
- 6. Global Border Security Industry Analysis, Insights and Forecast, 2021-2033
- 6.1. Market Analysis, Insights and Forecast - by Production Analysis
- 6.2. Market Analysis, Insights and Forecast - by Consumption Analysis
- 6.3. Market Analysis, Insights and Forecast - by Import Market Analysis (Value & Volume)
- 6.4. Market Analysis, Insights and Forecast - by Export Market Analysis (Value & Volume)
- 6.5. Market Analysis, Insights and Forecast - by Price Trend Analysis
- 7. North America Border Security Industry Analysis, Insights and Forecast, 2020-2032
- 7.1. Market Analysis, Insights and Forecast - by Production Analysis
- 7.2. Market Analysis, Insights and Forecast - by Consumption Analysis
- 7.3. Market Analysis, Insights and Forecast - by Import Market Analysis (Value & Volume)
- 7.4. Market Analysis, Insights and Forecast - by Export Market Analysis (Value & Volume)
- 7.5. Market Analysis, Insights and Forecast - by Price Trend Analysis
- 8. South America Border Security Industry Analysis, Insights and Forecast, 2020-2032
- 8.1. Market Analysis, Insights and Forecast - by Production Analysis
- 8.2. Market Analysis, Insights and Forecast - by Consumption Analysis
- 8.3. Market Analysis, Insights and Forecast - by Import Market Analysis (Value & Volume)
- 8.4. Market Analysis, Insights and Forecast - by Export Market Analysis (Value & Volume)
- 8.5. Market Analysis, Insights and Forecast - by Price Trend Analysis
- 9. Europe Border Security Industry Analysis, Insights and Forecast, 2020-2032
- 9.1. Market Analysis, Insights and Forecast - by Production Analysis
- 9.2. Market Analysis, Insights and Forecast - by Consumption Analysis
- 9.3. Market Analysis, Insights and Forecast - by Import Market Analysis (Value & Volume)
- 9.4. Market Analysis, Insights and Forecast - by Export Market Analysis (Value & Volume)
- 9.5. Market Analysis, Insights and Forecast - by Price Trend Analysis
- 10. Middle East & Africa Border Security Industry Analysis, Insights and Forecast, 2020-2032
- 10.1. Market Analysis, Insights and Forecast - by Production Analysis
- 10.2. Market Analysis, Insights and Forecast - by Consumption Analysis
- 10.3. Market Analysis, Insights and Forecast - by Import Market Analysis (Value & Volume)
- 10.4. Market Analysis, Insights and Forecast - by Export Market Analysis (Value & Volume)
- 10.5. Market Analysis, Insights and Forecast - by Price Trend Analysis
- 11. Asia Pacific Border Security Industry Analysis, Insights and Forecast, 2020-2032
- 11.1. Market Analysis, Insights and Forecast - by Production Analysis
- 11.2. Market Analysis, Insights and Forecast - by Consumption Analysis
- 11.3. Market Analysis, Insights and Forecast - by Import Market Analysis (Value & Volume)
- 11.4. Market Analysis, Insights and Forecast - by Export Market Analysis (Value & Volume)
- 11.5. Market Analysis, Insights and Forecast - by Price Trend Analysis
- 12. Competitive Analysis
- 12.1. Company Profiles
- 12.1.1 Raytheon Technologies Corporation
- 12.1.1.1. Company Overview
- 12.1.1.2. Products
- 12.1.1.3. Company Financials
- 12.1.1.4. SWOT Analysis
- 12.1.2 THALES
- 12.1.2.1. Company Overview
- 12.1.2.2. Products
- 12.1.2.3. Company Financials
- 12.1.2.4. SWOT Analysis
- 12.1.3 General Dynamics Corporation
- 12.1.3.1. Company Overview
- 12.1.3.2. Products
- 12.1.3.3. Company Financials
- 12.1.3.4. SWOT Analysis
- 12.1.4 Leonardo SpA
- 12.1.4.1. Company Overview
- 12.1.4.2. Products
- 12.1.4.3. Company Financials
- 12.1.4.4. SWOT Analysis
- 12.1.5 Elbit Systems Ltd
- 12.1.5.1. Company Overview
- 12.1.5.2. Products
- 12.1.5.3. Company Financials
- 12.1.5.4. SWOT Analysis
- 12.1.6 Airbus SE
- 12.1.6.1. Company Overview
- 12.1.6.2. Products
- 12.1.6.3. Company Financials
- 12.1.6.4. SWOT Analysis
- 12.1.7 Moog Inc
- 12.1.7.1. Company Overview
- 12.1.7.2. Products
- 12.1.7.3. Company Financials
- 12.1.7.4. SWOT Analysis
- 12.1.8 Rafael Advanced Defense Systems Ltd
- 12.1.8.1. Company Overview
- 12.1.8.2. Products
- 12.1.8.3. Company Financials
- 12.1.8.4. SWOT Analysis
- 12.1.9 IAI
- 12.1.9.1. Company Overview
- 12.1.9.2. Products
- 12.1.9.3. Company Financials
- 12.1.9.4. SWOT Analysis
- 12.1.10 BAE Systems plc
- 12.1.10.1. Company Overview
- 12.1.10.2. Products
- 12.1.10.3. Company Financials
- 12.1.10.4. SWOT Analysis
- 12.1.11 Northrop Grumman Corporation
- 12.1.11.1. Company Overview
- 12.1.11.2. Products
- 12.1.11.3. Company Financials
- 12.1.11.4. SWOT Analysis
- 12.1.12 Senstar Technologies Ltd
- 12.1.12.1. Company Overview
- 12.1.12.2. Products
- 12.1.12.3. Company Financials
- 12.1.12.4. SWOT Analysis
- 12.1.13 The Boeing Company
- 12.1.13.1. Company Overview
- 12.1.13.2. Products
- 12.1.13.3. Company Financials
- 12.1.13.4. SWOT Analysis
- 12.1.1 Raytheon Technologies Corporation
- 12.2. Market Entropy
- 12.2.1 Company's Key Areas Served
- 12.2.2 Recent Developments
- 12.3. Company Market Share Analysis 2025
- 12.3.1 Top 5 Companies Market Share Analysis
- 12.3.2 Top 3 Companies Market Share Analysis
- 12.4. List of Potential Customers
- 13. Research Methodology
List of Figures
- Figure 1: Global Border Security Industry Revenue Breakdown (undefined, %) by Region 2025 & 2033
- Figure 2: North America Border Security Industry Revenue (undefined), by Production Analysis 2025 & 2033
- Figure 3: North America Border Security Industry Revenue Share (%), by Production Analysis 2025 & 2033
- Figure 4: North America Border Security Industry Revenue (undefined), by Consumption Analysis 2025 & 2033
- Figure 5: North America Border Security Industry Revenue Share (%), by Consumption Analysis 2025 & 2033
- Figure 6: North America Border Security Industry Revenue (undefined), by Import Market Analysis (Value & Volume) 2025 & 2033
- Figure 7: North America Border Security Industry Revenue Share (%), by Import Market Analysis (Value & Volume) 2025 & 2033
- Figure 8: North America Border Security Industry Revenue (undefined), by Export Market Analysis (Value & Volume) 2025 & 2033
- Figure 9: North America Border Security Industry Revenue Share (%), by Export Market Analysis (Value & Volume) 2025 & 2033
- Figure 10: North America Border Security Industry Revenue (undefined), by Price Trend Analysis 2025 & 2033
- Figure 11: North America Border Security Industry Revenue Share (%), by Price Trend Analysis 2025 & 2033
- Figure 12: North America Border Security Industry Revenue (undefined), by Country 2025 & 2033
- Figure 13: North America Border Security Industry Revenue Share (%), by Country 2025 & 2033
- Figure 14: South America Border Security Industry Revenue (undefined), by Production Analysis 2025 & 2033
- Figure 15: South America Border Security Industry Revenue Share (%), by Production Analysis 2025 & 2033
- Figure 16: South America Border Security Industry Revenue (undefined), by Consumption Analysis 2025 & 2033
- Figure 17: South America Border Security Industry Revenue Share (%), by Consumption Analysis 2025 & 2033
- Figure 18: South America Border Security Industry Revenue (undefined), by Import Market Analysis (Value & Volume) 2025 & 2033
- Figure 19: South America Border Security Industry Revenue Share (%), by Import Market Analysis (Value & Volume) 2025 & 2033
- Figure 20: South America Border Security Industry Revenue (undefined), by Export Market Analysis (Value & Volume) 2025 & 2033
- Figure 21: South America Border Security Industry Revenue Share (%), by Export Market Analysis (Value & Volume) 2025 & 2033
- Figure 22: South America Border Security Industry Revenue (undefined), by Price Trend Analysis 2025 & 2033
- Figure 23: South America Border Security Industry Revenue Share (%), by Price Trend Analysis 2025 & 2033
- Figure 24: South America Border Security Industry Revenue (undefined), by Country 2025 & 2033
- Figure 25: South America Border Security Industry Revenue Share (%), by Country 2025 & 2033
- Figure 26: Europe Border Security Industry Revenue (undefined), by Production Analysis 2025 & 2033
- Figure 27: Europe Border Security Industry Revenue Share (%), by Production Analysis 2025 & 2033
- Figure 28: Europe Border Security Industry Revenue (undefined), by Consumption Analysis 2025 & 2033
- Figure 29: Europe Border Security Industry Revenue Share (%), by Consumption Analysis 2025 & 2033
- Figure 30: Europe Border Security Industry Revenue (undefined), by Import Market Analysis (Value & Volume) 2025 & 2033
- Figure 31: Europe Border Security Industry Revenue Share (%), by Import Market Analysis (Value & Volume) 2025 & 2033
- Figure 32: Europe Border Security Industry Revenue (undefined), by Export Market Analysis (Value & Volume) 2025 & 2033
- Figure 33: Europe Border Security Industry Revenue Share (%), by Export Market Analysis (Value & Volume) 2025 & 2033
- Figure 34: Europe Border Security Industry Revenue (undefined), by Price Trend Analysis 2025 & 2033
- Figure 35: Europe Border Security Industry Revenue Share (%), by Price Trend Analysis 2025 & 2033
- Figure 36: Europe Border Security Industry Revenue (undefined), by Country 2025 & 2033
- Figure 37: Europe Border Security Industry Revenue Share (%), by Country 2025 & 2033
- Figure 38: Middle East & Africa Border Security Industry Revenue (undefined), by Production Analysis 2025 & 2033
- Figure 39: Middle East & Africa Border Security Industry Revenue Share (%), by Production Analysis 2025 & 2033
- Figure 40: Middle East & Africa Border Security Industry Revenue (undefined), by Consumption Analysis 2025 & 2033
- Figure 41: Middle East & Africa Border Security Industry Revenue Share (%), by Consumption Analysis 2025 & 2033
- Figure 42: Middle East & Africa Border Security Industry Revenue (undefined), by Import Market Analysis (Value & Volume) 2025 & 2033
- Figure 43: Middle East & Africa Border Security Industry Revenue Share (%), by Import Market Analysis (Value & Volume) 2025 & 2033
- Figure 44: Middle East & Africa Border Security Industry Revenue (undefined), by Export Market Analysis (Value & Volume) 2025 & 2033
- Figure 45: Middle East & Africa Border Security Industry Revenue Share (%), by Export Market Analysis (Value & Volume) 2025 & 2033
- Figure 46: Middle East & Africa Border Security Industry Revenue (undefined), by Price Trend Analysis 2025 & 2033
- Figure 47: Middle East & Africa Border Security Industry Revenue Share (%), by Price Trend Analysis 2025 & 2033
- Figure 48: Middle East & Africa Border Security Industry Revenue (undefined), by Country 2025 & 2033
- Figure 49: Middle East & Africa Border Security Industry Revenue Share (%), by Country 2025 & 2033
- Figure 50: Asia Pacific Border Security Industry Revenue (undefined), by Production Analysis 2025 & 2033
- Figure 51: Asia Pacific Border Security Industry Revenue Share (%), by Production Analysis 2025 & 2033
- Figure 52: Asia Pacific Border Security Industry Revenue (undefined), by Consumption Analysis 2025 & 2033
- Figure 53: Asia Pacific Border Security Industry Revenue Share (%), by Consumption Analysis 2025 & 2033
- Figure 54: Asia Pacific Border Security Industry Revenue (undefined), by Import Market Analysis (Value & Volume) 2025 & 2033
- Figure 55: Asia Pacific Border Security Industry Revenue Share (%), by Import Market Analysis (Value & Volume) 2025 & 2033
- Figure 56: Asia Pacific Border Security Industry Revenue (undefined), by Export Market Analysis (Value & Volume) 2025 & 2033
- Figure 57: Asia Pacific Border Security Industry Revenue Share (%), by Export Market Analysis (Value & Volume) 2025 & 2033
- Figure 58: Asia Pacific Border Security Industry Revenue (undefined), by Price Trend Analysis 2025 & 2033
- Figure 59: Asia Pacific Border Security Industry Revenue Share (%), by Price Trend Analysis 2025 & 2033
- Figure 60: Asia Pacific Border Security Industry Revenue (undefined), by Country 2025 & 2033
- Figure 61: Asia Pacific Border Security Industry Revenue Share (%), by Country 2025 & 2033
List of Tables
- Table 1: Global Border Security Industry Revenue undefined Forecast, by Production Analysis 2020 & 2033
- Table 2: Global Border Security Industry Revenue undefined Forecast, by Consumption Analysis 2020 & 2033
- Table 3: Global Border Security Industry Revenue undefined Forecast, by Import Market Analysis (Value & Volume) 2020 & 2033
- Table 4: Global Border Security Industry Revenue undefined Forecast, by Export Market Analysis (Value & Volume) 2020 & 2033
- Table 5: Global Border Security Industry Revenue undefined Forecast, by Price Trend Analysis 2020 & 2033
- Table 6: Global Border Security Industry Revenue undefined Forecast, by Region 2020 & 2033
- Table 7: Global Border Security Industry Revenue undefined Forecast, by Production Analysis 2020 & 2033
- Table 8: Global Border Security Industry Revenue undefined Forecast, by Consumption Analysis 2020 & 2033
- Table 9: Global Border Security Industry Revenue undefined Forecast, by Import Market Analysis (Value & Volume) 2020 & 2033
- Table 10: Global Border Security Industry Revenue undefined Forecast, by Export Market Analysis (Value & Volume) 2020 & 2033
- Table 11: Global Border Security Industry Revenue undefined Forecast, by Price Trend Analysis 2020 & 2033
- Table 12: Global Border Security Industry Revenue undefined Forecast, by Country 2020 & 2033
- Table 13: United States Border Security Industry Revenue (undefined) Forecast, by Application 2020 & 2033
- Table 14: Canada Border Security Industry Revenue (undefined) Forecast, by Application 2020 & 2033
- Table 15: Mexico Border Security Industry Revenue (undefined) Forecast, by Application 2020 & 2033
- Table 16: Global Border Security Industry Revenue undefined Forecast, by Production Analysis 2020 & 2033
- Table 17: Global Border Security Industry Revenue undefined Forecast, by Consumption Analysis 2020 & 2033
- Table 18: Global Border Security Industry Revenue undefined Forecast, by Import Market Analysis (Value & Volume) 2020 & 2033
- Table 19: Global Border Security Industry Revenue undefined Forecast, by Export Market Analysis (Value & Volume) 2020 & 2033
- Table 20: Global Border Security Industry Revenue undefined Forecast, by Price Trend Analysis 2020 & 2033
- Table 21: Global Border Security Industry Revenue undefined Forecast, by Country 2020 & 2033
- Table 22: Brazil Border Security Industry Revenue (undefined) Forecast, by Application 2020 & 2033
- Table 23: Argentina Border Security Industry Revenue (undefined) Forecast, by Application 2020 & 2033
- Table 24: Rest of South America Border Security Industry Revenue (undefined) Forecast, by Application 2020 & 2033
- Table 25: Global Border Security Industry Revenue undefined Forecast, by Production Analysis 2020 & 2033
- Table 26: Global Border Security Industry Revenue undefined Forecast, by Consumption Analysis 2020 & 2033
- Table 27: Global Border Security Industry Revenue undefined Forecast, by Import Market Analysis (Value & Volume) 2020 & 2033
- Table 28: Global Border Security Industry Revenue undefined Forecast, by Export Market Analysis (Value & Volume) 2020 & 2033
- Table 29: Global Border Security Industry Revenue undefined Forecast, by Price Trend Analysis 2020 & 2033
- Table 30: Global Border Security Industry Revenue undefined Forecast, by Country 2020 & 2033
- Table 31: United Kingdom Border Security Industry Revenue (undefined) Forecast, by Application 2020 & 2033
- Table 32: Germany Border Security Industry Revenue (undefined) Forecast, by Application 2020 & 2033
- Table 33: France Border Security Industry Revenue (undefined) Forecast, by Application 2020 & 2033
- Table 34: Italy Border Security Industry Revenue (undefined) Forecast, by Application 2020 & 2033
- Table 35: Spain Border Security Industry Revenue (undefined) Forecast, by Application 2020 & 2033
- Table 36: Russia Border Security Industry Revenue (undefined) Forecast, by Application 2020 & 2033
- Table 37: Benelux Border Security Industry Revenue (undefined) Forecast, by Application 2020 & 2033
- Table 38: Nordics Border Security Industry Revenue (undefined) Forecast, by Application 2020 & 2033
- Table 39: Rest of Europe Border Security Industry Revenue (undefined) Forecast, by Application 2020 & 2033
- Table 40: Global Border Security Industry Revenue undefined Forecast, by Production Analysis 2020 & 2033
- Table 41: Global Border Security Industry Revenue undefined Forecast, by Consumption Analysis 2020 & 2033
- Table 42: Global Border Security Industry Revenue undefined Forecast, by Import Market Analysis (Value & Volume) 2020 & 2033
- Table 43: Global Border Security Industry Revenue undefined Forecast, by Export Market Analysis (Value & Volume) 2020 & 2033
- Table 44: Global Border Security Industry Revenue undefined Forecast, by Price Trend Analysis 2020 & 2033
- Table 45: Global Border Security Industry Revenue undefined Forecast, by Country 2020 & 2033
- Table 46: Turkey Border Security Industry Revenue (undefined) Forecast, by Application 2020 & 2033
- Table 47: Israel Border Security Industry Revenue (undefined) Forecast, by Application 2020 & 2033
- Table 48: GCC Border Security Industry Revenue (undefined) Forecast, by Application 2020 & 2033
- Table 49: North Africa Border Security Industry Revenue (undefined) Forecast, by Application 2020 & 2033
- Table 50: South Africa Border Security Industry Revenue (undefined) Forecast, by Application 2020 & 2033
- Table 51: Rest of Middle East & Africa Border Security Industry Revenue (undefined) Forecast, by Application 2020 & 2033
- Table 52: Global Border Security Industry Revenue undefined Forecast, by Production Analysis 2020 & 2033
- Table 53: Global Border Security Industry Revenue undefined Forecast, by Consumption Analysis 2020 & 2033
- Table 54: Global Border Security Industry Revenue undefined Forecast, by Import Market Analysis (Value & Volume) 2020 & 2033
- Table 55: Global Border Security Industry Revenue undefined Forecast, by Export Market Analysis (Value & Volume) 2020 & 2033
- Table 56: Global Border Security Industry Revenue undefined Forecast, by Price Trend Analysis 2020 & 2033
- Table 57: Global Border Security Industry Revenue undefined Forecast, by Country 2020 & 2033
- Table 58: China Border Security Industry Revenue (undefined) Forecast, by Application 2020 & 2033
- Table 59: India Border Security Industry Revenue (undefined) Forecast, by Application 2020 & 2033
- Table 60: Japan Border Security Industry Revenue (undefined) Forecast, by Application 2020 & 2033
- Table 61: South Korea Border Security Industry Revenue (undefined) Forecast, by Application 2020 & 2033
- Table 62: ASEAN Border Security Industry Revenue (undefined) Forecast, by Application 2020 & 2033
- Table 63: Oceania Border Security Industry Revenue (undefined) Forecast, by Application 2020 & 2033
- Table 64: Rest of Asia Pacific Border Security Industry Revenue (undefined) Forecast, by Application 2020 & 2033
Frequently Asked Questions
1. What is the projected Compound Annual Growth Rate (CAGR) of the Border Security Industry?
The projected CAGR is approximately 6.62%.
2. Which companies are prominent players in the Border Security Industry?
Key companies in the market include Raytheon Technologies Corporation, THALES, General Dynamics Corporation, Leonardo SpA, Elbit Systems Ltd, Airbus SE, Moog Inc, Rafael Advanced Defense Systems Ltd, IAI, BAE Systems plc, Northrop Grumman Corporation, Senstar Technologies Ltd, The Boeing Company.
3. What are the main segments of the Border Security Industry?
The market segments include Production Analysis, Consumption Analysis, Import Market Analysis (Value & Volume), Export Market Analysis (Value & Volume), Price Trend Analysis.
4. Can you provide details about the market size?
The market size is estimated to be USD XXX N/A as of 2022.
5. What are some drivers contributing to market growth?
; Increasing Number Of Air Passengers; Use Of Portable Electronic Devices.
6. What are the notable trends driving market growth?
The Sea segment to Experience Major Growth.
7. Are there any restraints impacting market growth?
; High Cost Of Connectivity Equipments.
8. Can you provide examples of recent developments in the market?
In March 2023, Accenture Federal Services received a contract worth USD 380 million for IT infrastructure operations and modernization from US Customs and Border Protection (CBP). Under the contract, the company will deliver comprehensive technology support across multiple programs within the agency responsible for safeguarding the country's borders and facilitating lawful international travel and trade.
9. What pricing options are available for accessing the report?
Pricing options include single-user, multi-user, and enterprise licenses priced at USD 4750, USD 5250, and USD 8750 respectively.
10. Is the market size provided in terms of value or volume?
The market size is provided in terms of value, measured in N/A.
11. Are there any specific market keywords associated with the report?
Yes, the market keyword associated with the report is "Border Security Industry," which aids in identifying and referencing the specific market segment covered.
12. How do I determine which pricing option suits my needs best?
The pricing options vary based on user requirements and access needs. Individual users may opt for single-user licenses, while businesses requiring broader access may choose multi-user or enterprise licenses for cost-effective access to the report.
13. Are there any additional resources or data provided in the Border Security Industry report?
While the report offers comprehensive insights, it's advisable to review the specific contents or supplementary materials provided to ascertain if additional resources or data are available.
14. How can I stay updated on further developments or reports in the Border Security Industry?
To stay informed about further developments, trends, and reports in the Border Security Industry, consider subscribing to industry newsletters, following relevant companies and organizations, or regularly checking reputable industry news sources and publications.
Methodology
Step 1 - Identification of Relevant Samples Size from Population Database


Step 2 - Approaches for Defining Global Market Size (Value, Volume* & Price*)

Note*: In applicable scenarios
Step 3 - Data Sources
Primary Research
- Web Analytics
- Survey Reports
- Research Institute
- Latest Research Reports
- Opinion Leaders
Secondary Research
- Annual Reports
- White Paper
- Latest Press Release
- Industry Association
- Paid Database
- Investor Presentations

Step 4 - Data Triangulation
Involves using different sources of information in order to increase the validity of a study
These sources are likely to be stakeholders in a program - participants, other researchers, program staff, other community members, and so on.
Then we put all data in single framework & apply various statistical tools to find out the dynamic on the market.
During the analysis stage, feedback from the stakeholder groups would be compared to determine areas of agreement as well as areas of divergence