

Key Insights
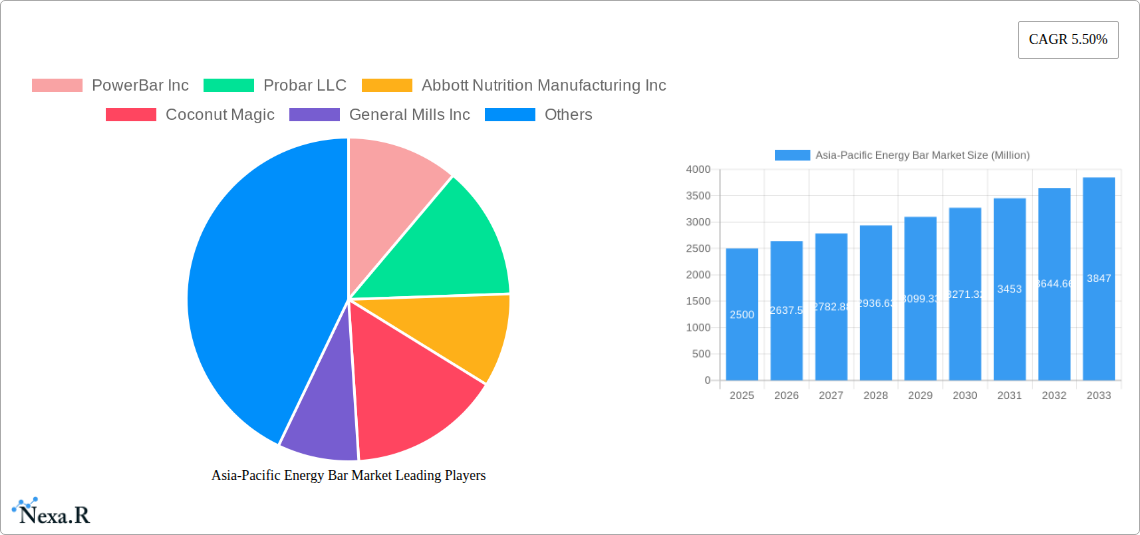
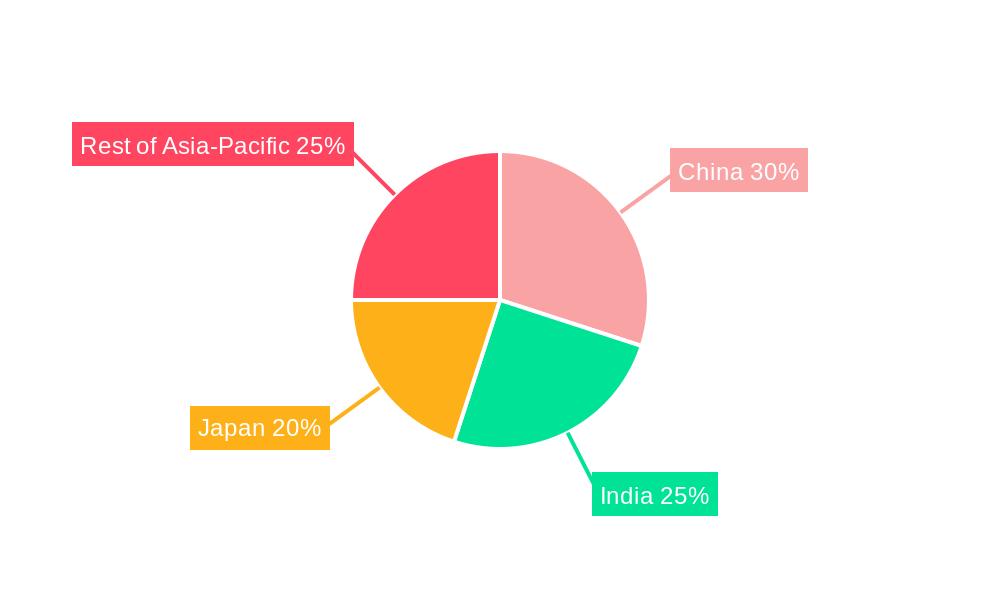
The Asia-Pacific energy bar market, valued at approximately $2.5 billion in 2025, is projected to experience robust growth, exhibiting a Compound Annual Growth Rate (CAGR) of 5.5% from 2025 to 2033. This expansion is fueled by several key factors. Rising health consciousness among consumers, particularly in rapidly developing economies like China and India, is driving demand for convenient and nutritious on-the-go snacks. The increasing prevalence of busy lifestyles, coupled with a growing awareness of the importance of maintaining energy levels throughout the day, further contributes to market growth. Furthermore, the proliferation of online retail channels provides increased accessibility to a wider range of energy bar options, catering to diverse dietary preferences and needs. Significant growth is expected within the online retail segment, driven by the increasing penetration of e-commerce and the convenience it offers. However, potential market restraints include fluctuating raw material prices, concerns regarding added sugar and artificial ingredients in certain brands, and intense competition from established players and emerging local brands. The market segmentation by distribution channels shows supermarkets/hypermarkets currently holding the largest share, but online channels are poised for substantial growth in the forecast period. Key players such as PowerBar, Probar, Abbott Nutrition, and Clif Bar are investing heavily in product innovation and marketing strategies to maintain their market positions amidst this dynamic landscape. The regional breakdown reveals that China, India, and Japan are expected to be the largest contributors to market growth within the Asia-Pacific region, reflecting their large and expanding consumer bases.
The competitive landscape is characterized by a mix of established multinational corporations and smaller, regional players. Established brands leverage their strong brand recognition and extensive distribution networks to maintain market share. However, smaller, agile companies are effectively competing by focusing on niche market segments, offering innovative product formulations (e.g., organic, gluten-free, vegan options), and utilizing targeted digital marketing strategies. This competitive dynamic is likely to intensify further as consumer preferences evolve and demand for healthier, more sustainable energy bars increases. The sustained growth projection hinges on maintaining consumer confidence in the nutritional value and quality of energy bars and adapting product offerings to meet the changing preferences and health priorities of consumers across the diverse markets of Asia-Pacific.
This comprehensive report provides an in-depth analysis of the Asia-Pacific energy bar market, encompassing market dynamics, growth trends, regional performance, product landscape, key players, and future outlook. The study period covers 2019-2033, with 2025 as the base year and a forecast period of 2025-2033. The report caters to industry professionals, investors, and market researchers seeking a detailed understanding of this dynamic sector. The parent market is the broader Asia-Pacific snack bar market, while the child market is specifically the energy bar segment. The market size is projected to reach XX Million units by 2033.
Asia-Pacific Energy Bar Market Market Dynamics & Structure
The Asia-Pacific energy bar market exhibits a moderately fragmented structure, with several key players vying for market share. Technological innovation, particularly in the area of ingredient sourcing and bar formulation, is a major driver. Regulatory frameworks regarding labeling and health claims influence product development and marketing strategies. The market faces competition from other convenient snack options, including protein bars and granola bars. End-user demographics show significant growth potential in health-conscious millennials and active individuals. Mergers and acquisitions (M&A) activity is relatively moderate, with strategic partnerships more common.
- Market Concentration: Moderately fragmented, with a Herfindahl-Hirschman Index (HHI) of xx.
- Technological Innovation: Focus on novel ingredients (e.g., plant-based proteins, superfoods), improved manufacturing processes, and functional formulations (e.g., added vitamins, probiotics).
- Regulatory Landscape: Varied across countries, impacting labeling requirements and marketing claims. Stringent regulations in certain countries present barriers to entry.
- Competitive Substitutes: Protein bars, granola bars, and other convenient snack foods.
- End-User Demographics: Growing demand driven by health-conscious consumers, athletes, and busy professionals.
- M&A Activity: Moderate level of activity, with xx major deals observed during the historical period (2019-2024).
Asia-Pacific Energy Bar Market Growth Trends & Insights
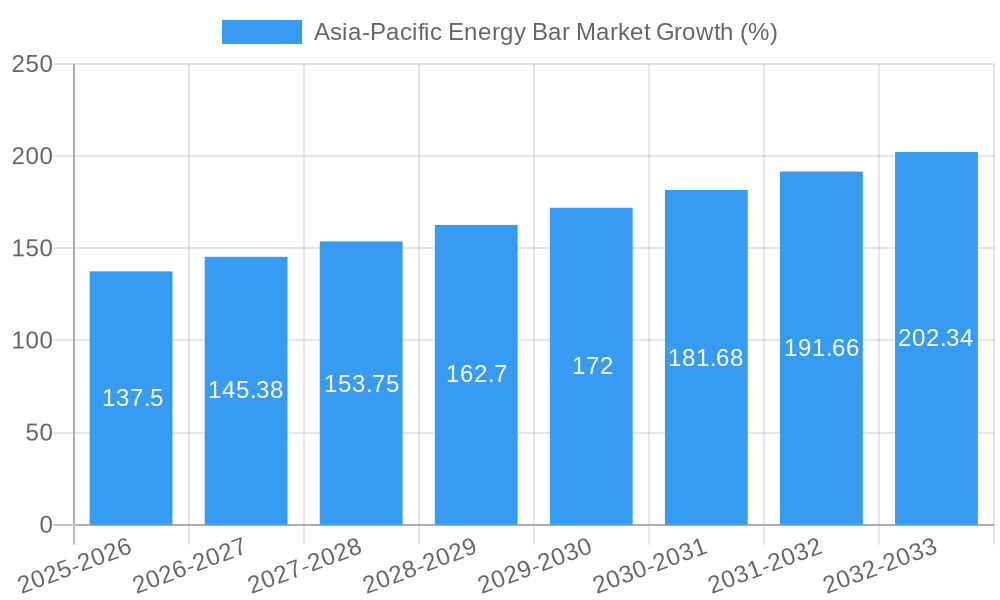
The Asia-Pacific energy bar market is experiencing robust growth, driven by several factors including increasing health awareness, rising disposable incomes, and the growing popularity of fitness and sports activities. The market size, measured in million units, has shown a CAGR of xx% during the historical period (2019-2024) and is projected to maintain a CAGR of xx% during the forecast period (2025-2033). Market penetration remains relatively low in certain regions, presenting significant untapped potential. Technological disruptions, such as the introduction of novel ingredients and improved manufacturing techniques, continue to shape the market landscape. Consumer behavior shows a preference for healthier, natural, and functional energy bars.
Dominant Regions, Countries, or Segments in Asia-Pacific Energy Bar Market
The Supermarkets/Hypermarkets distribution channel dominates the Asia-Pacific energy bar market, representing xx% of total sales in 2025. This is driven by the widespread availability of these stores, their established supply chains, and their ability to offer a broader range of products. China and India emerge as the leading countries, benefitting from large populations, growing middle classes, and increasing adoption of westernized diets.
- Key Drivers in Supermarkets/Hypermarkets:
- Extensive reach and established distribution networks
- Capacity to cater to a broad range of consumer preferences
- Growing private label offerings further driving competition and market growth
- China & India Dominance: Large populations, rising disposable incomes, increased health consciousness among consumers, and significant growth in the fitness and sports sectors.
- Growth Potential: Significant untapped potential in other markets like South Korea, Australia, and ASEAN countries.
Other Distribution Channels include smaller retail outlets, online channels, and direct sales which are expected to exhibit faster growth, particularly online retail which is influenced by increasing e-commerce adoption rates and convenience offered to consumers.
Asia-Pacific Energy Bar Market Product Landscape
Energy bars in the Asia-Pacific market showcase a wide range of formulations, encompassing traditional grain-based bars, protein-enhanced bars, and those featuring exotic ingredients or functional additives. Innovations include the incorporation of superfoods, such as chia seeds, goji berries, and spirulina, to enhance nutritional value and appeal to health-conscious consumers. Performance metrics focus on calorie density, macronutrient profiles, and the inclusion of functional ingredients. Unique selling propositions emphasize natural ingredients, organic certifications, and specific health benefits. Advances in manufacturing techniques allow for improved texture, shelf life, and reduction of added sugars.
Key Drivers, Barriers & Challenges in Asia-Pacific Energy Bar Market
Key Drivers:
- Increasing health awareness and the rising popularity of fitness activities.
- Growing disposable incomes in several Asian countries.
- Expansion of e-commerce and online retail.
Key Challenges:
- Intense competition among established players and new entrants. The market is fragmented, leading to price competition and pressure on margins.
- Fluctuating raw material prices can impact production costs and profitability.
- Stringent regulatory standards regarding food labeling and health claims can increase compliance costs. These regulations vary across the region, adding complexity to operations.
Emerging Opportunities in Asia-Pacific Energy Bar Market
- Growth in Specialized Energy Bars: This includes bars catering to specific dietary needs (e.g., vegan, gluten-free, ketogenic) or tailored to unique performance goals (e.g., pre/post-workout bars).
- Expansion in Rural and Underserved Markets: Untapped potential exists in expanding distribution networks to reach consumers beyond major urban centers.
- Leveraging the Rise of E-commerce: Online retail channels present significant opportunities to enhance reach and market penetration.
Growth Accelerators in the Asia-Pacific Energy Bar Market Industry
Strategic partnerships among food manufacturers, ingredient suppliers, and distributors can enhance market reach, optimize supply chains, and develop innovative products. Technological advancements, particularly in ingredient sourcing, bar formulation, and packaging, will enable the creation of higher-quality, more convenient, and environmentally friendly products. Expansion into new markets and product diversification will further propel market growth.
Key Players Shaping the Asia-Pacific Energy Bar Market Market
- PowerBar Inc
- Probar LLC
- Abbott Nutrition Manufacturing Inc
- Coconut Magic
- General Mills Inc
- NuGo Nutrition
- Kellogg NA Co
- Clif Bar & Company
Notable Milestones in Asia-Pacific Energy Bar Market Sector
- February 2022: India-based Yoga bar brand launched new kids' nutrition mixes, 'Yo Chos' and 'Yo Fills,' expanding product categories and targeting a new consumer segment. This signals a move toward more specialized products.
In-Depth Asia-Pacific Energy Bar Market Market Outlook
The Asia-Pacific energy bar market is poised for continued growth, driven by the factors outlined above. Strategic investments in innovation, expansion into new markets, and the development of niche products will be key to success. The market's potential is particularly strong in emerging economies, where increasing health awareness and rising disposable incomes are creating favorable conditions for market expansion. The market is expected to see a steady increase in demand over the next decade, offering substantial opportunities for both established players and new entrants.
Asia-Pacific Energy Bar Market Segmentation
-
1. Distribution Channel
- 1.1. Supermarkets/Hypermarkets
- 1.2. Convenience Stores
- 1.3. Speciality Stores
- 1.4. Online Retail Stores
- 1.5. Other Distribution Channels
-
2. Geography
-
2.1. Asia Pacific
- 2.1.1. China
- 2.1.2. Japan
- 2.1.3. India
- 2.1.4. Australia
- 2.1.5. Rest of Asia-Pacific
-
2.1. Asia Pacific
Asia-Pacific Energy Bar Market Segmentation By Geography
-
1. Asia Pacific
- 1.1. China
- 1.2. Japan
- 1.3. India
- 1.4. Australia
- 1.5. Rest of Asia Pacific
Asia-Pacific Energy Bar Market REPORT HIGHLIGHTS
| Aspects | Details |
|---|---|
| Study Period | 2019-2033 |
| Base Year | 2024 |
| Estimated Year | 2025 |
| Forecast Period | 2025-2033 |
| Historical Period | 2019-2024 |
| Growth Rate | CAGR of 5.50% from 2019-2033 |
| Segmentation |
|
Table of Contents
- 1. Introduction
- 1.1. Research Scope
- 1.2. Market Segmentation
- 1.3. Research Methodology
- 1.4. Definitions and Assumptions
- 2. Executive Summary
- 2.1. Introduction
- 3. Market Dynamics
- 3.1. Introduction
- 3.2. Market Drivers
- 3.2.1. Rising Health Consciousness among consumer
- 3.3. Market Restrains
- 3.3.1. High Cost of natural Ingredients
- 3.4. Market Trends
- 3.4.1. Australia Dominating the Energy Bar Market
- 4. Market Factor Analysis
- 4.1. Porters Five Forces
- 4.2. Supply/Value Chain
- 4.3. PESTEL analysis
- 4.4. Market Entropy
- 4.5. Patent/Trademark Analysis
- 5. Asia-Pacific Energy Bar Market Analysis, Insights and Forecast, 2019-2031
- 5.1. Market Analysis, Insights and Forecast - by Distribution Channel
- 5.1.1. Supermarkets/Hypermarkets
- 5.1.2. Convenience Stores
- 5.1.3. Speciality Stores
- 5.1.4. Online Retail Stores
- 5.1.5. Other Distribution Channels
- 5.2. Market Analysis, Insights and Forecast - by Geography
- 5.2.1. Asia Pacific
- 5.2.1.1. China
- 5.2.1.2. Japan
- 5.2.1.3. India
- 5.2.1.4. Australia
- 5.2.1.5. Rest of Asia-Pacific
- 5.2.1. Asia Pacific
- 5.3. Market Analysis, Insights and Forecast - by Region
- 5.3.1. Asia Pacific
- 5.1. Market Analysis, Insights and Forecast - by Distribution Channel
- 6. China Asia-Pacific Energy Bar Market Analysis, Insights and Forecast, 2019-2031
- 7. Japan Asia-Pacific Energy Bar Market Analysis, Insights and Forecast, 2019-2031
- 8. India Asia-Pacific Energy Bar Market Analysis, Insights and Forecast, 2019-2031
- 9. South Korea Asia-Pacific Energy Bar Market Analysis, Insights and Forecast, 2019-2031
- 10. Taiwan Asia-Pacific Energy Bar Market Analysis, Insights and Forecast, 2019-2031
- 11. Australia Asia-Pacific Energy Bar Market Analysis, Insights and Forecast, 2019-2031
- 12. Rest of Asia-Pacific Asia-Pacific Energy Bar Market Analysis, Insights and Forecast, 2019-2031
- 13. Competitive Analysis
- 13.1. Market Share Analysis 2024
- 13.2. Company Profiles
- 13.2.1 PowerBar Inc
- 13.2.1.1. Overview
- 13.2.1.2. Products
- 13.2.1.3. SWOT Analysis
- 13.2.1.4. Recent Developments
- 13.2.1.5. Financials (Based on Availability)
- 13.2.2 Probar LLC
- 13.2.2.1. Overview
- 13.2.2.2. Products
- 13.2.2.3. SWOT Analysis
- 13.2.2.4. Recent Developments
- 13.2.2.5. Financials (Based on Availability)
- 13.2.3 Abbott Nutrition Manufacturing Inc
- 13.2.3.1. Overview
- 13.2.3.2. Products
- 13.2.3.3. SWOT Analysis
- 13.2.3.4. Recent Developments
- 13.2.3.5. Financials (Based on Availability)
- 13.2.4 Coconut Magic
- 13.2.4.1. Overview
- 13.2.4.2. Products
- 13.2.4.3. SWOT Analysis
- 13.2.4.4. Recent Developments
- 13.2.4.5. Financials (Based on Availability)
- 13.2.5 General Mills Inc
- 13.2.5.1. Overview
- 13.2.5.2. Products
- 13.2.5.3. SWOT Analysis
- 13.2.5.4. Recent Developments
- 13.2.5.5. Financials (Based on Availability)
- 13.2.6 NuGo Nutrition*List Not Exhaustive
- 13.2.6.1. Overview
- 13.2.6.2. Products
- 13.2.6.3. SWOT Analysis
- 13.2.6.4. Recent Developments
- 13.2.6.5. Financials (Based on Availability)
- 13.2.7 Kellogg NA Co
- 13.2.7.1. Overview
- 13.2.7.2. Products
- 13.2.7.3. SWOT Analysis
- 13.2.7.4. Recent Developments
- 13.2.7.5. Financials (Based on Availability)
- 13.2.8 Clif Bar & Company
- 13.2.8.1. Overview
- 13.2.8.2. Products
- 13.2.8.3. SWOT Analysis
- 13.2.8.4. Recent Developments
- 13.2.8.5. Financials (Based on Availability)
- 13.2.1 PowerBar Inc
List of Figures
- Figure 1: Asia-Pacific Energy Bar Market Revenue Breakdown (Million, %) by Product 2024 & 2032
- Figure 2: Asia-Pacific Energy Bar Market Share (%) by Company 2024
List of Tables
- Table 1: Asia-Pacific Energy Bar Market Revenue Million Forecast, by Region 2019 & 2032
- Table 2: Asia-Pacific Energy Bar Market Revenue Million Forecast, by Distribution Channel 2019 & 2032
- Table 3: Asia-Pacific Energy Bar Market Revenue Million Forecast, by Geography 2019 & 2032
- Table 4: Asia-Pacific Energy Bar Market Revenue Million Forecast, by Region 2019 & 2032
- Table 5: Asia-Pacific Energy Bar Market Revenue Million Forecast, by Country 2019 & 2032
- Table 6: China Asia-Pacific Energy Bar Market Revenue (Million) Forecast, by Application 2019 & 2032
- Table 7: Japan Asia-Pacific Energy Bar Market Revenue (Million) Forecast, by Application 2019 & 2032
- Table 8: India Asia-Pacific Energy Bar Market Revenue (Million) Forecast, by Application 2019 & 2032
- Table 9: South Korea Asia-Pacific Energy Bar Market Revenue (Million) Forecast, by Application 2019 & 2032
- Table 10: Taiwan Asia-Pacific Energy Bar Market Revenue (Million) Forecast, by Application 2019 & 2032
- Table 11: Australia Asia-Pacific Energy Bar Market Revenue (Million) Forecast, by Application 2019 & 2032
- Table 12: Rest of Asia-Pacific Asia-Pacific Energy Bar Market Revenue (Million) Forecast, by Application 2019 & 2032
- Table 13: Asia-Pacific Energy Bar Market Revenue Million Forecast, by Distribution Channel 2019 & 2032
- Table 14: Asia-Pacific Energy Bar Market Revenue Million Forecast, by Geography 2019 & 2032
- Table 15: Asia-Pacific Energy Bar Market Revenue Million Forecast, by Country 2019 & 2032
- Table 16: China Asia-Pacific Energy Bar Market Revenue (Million) Forecast, by Application 2019 & 2032
- Table 17: Japan Asia-Pacific Energy Bar Market Revenue (Million) Forecast, by Application 2019 & 2032
- Table 18: India Asia-Pacific Energy Bar Market Revenue (Million) Forecast, by Application 2019 & 2032
- Table 19: Australia Asia-Pacific Energy Bar Market Revenue (Million) Forecast, by Application 2019 & 2032
- Table 20: Rest of Asia Pacific Asia-Pacific Energy Bar Market Revenue (Million) Forecast, by Application 2019 & 2032
Frequently Asked Questions
1. What is the projected Compound Annual Growth Rate (CAGR) of the Asia-Pacific Energy Bar Market?
The projected CAGR is approximately 5.50%.
2. Which companies are prominent players in the Asia-Pacific Energy Bar Market?
Key companies in the market include PowerBar Inc, Probar LLC, Abbott Nutrition Manufacturing Inc, Coconut Magic, General Mills Inc, NuGo Nutrition*List Not Exhaustive, Kellogg NA Co, Clif Bar & Company.
3. What are the main segments of the Asia-Pacific Energy Bar Market?
The market segments include Distribution Channel, Geography.
4. Can you provide details about the market size?
The market size is estimated to be USD XX Million as of 2022.
5. What are some drivers contributing to market growth?
Rising Health Consciousness among consumer.
6. What are the notable trends driving market growth?
Australia Dominating the Energy Bar Market.
7. Are there any restraints impacting market growth?
High Cost of natural Ingredients.
8. Can you provide examples of recent developments in the market?
In February 2022, the India-based Yoga bar brand extended its product category into kids' nutrition with the launch of new mixes 'Yo Chos' and 'Yo Fills'.
9. What pricing options are available for accessing the report?
Pricing options include single-user, multi-user, and enterprise licenses priced at USD 4750, USD 5250, and USD 8750 respectively.
10. Is the market size provided in terms of value or volume?
The market size is provided in terms of value, measured in Million.
11. Are there any specific market keywords associated with the report?
Yes, the market keyword associated with the report is "Asia-Pacific Energy Bar Market," which aids in identifying and referencing the specific market segment covered.
12. How do I determine which pricing option suits my needs best?
The pricing options vary based on user requirements and access needs. Individual users may opt for single-user licenses, while businesses requiring broader access may choose multi-user or enterprise licenses for cost-effective access to the report.
13. Are there any additional resources or data provided in the Asia-Pacific Energy Bar Market report?
While the report offers comprehensive insights, it's advisable to review the specific contents or supplementary materials provided to ascertain if additional resources or data are available.
14. How can I stay updated on further developments or reports in the Asia-Pacific Energy Bar Market?
To stay informed about further developments, trends, and reports in the Asia-Pacific Energy Bar Market, consider subscribing to industry newsletters, following relevant companies and organizations, or regularly checking reputable industry news sources and publications.
Methodology
Step 1 - Identification of Relevant Samples Size from Population Database


Step 2 - Approaches for Defining Global Market Size (Value, Volume* & Price*)

Note*: In applicable scenarios
Step 3 - Data Sources
Primary Research
- Web Analytics
- Survey Reports
- Research Institute
- Latest Research Reports
- Opinion Leaders
Secondary Research
- Annual Reports
- White Paper
- Latest Press Release
- Industry Association
- Paid Database
- Investor Presentations

Step 4 - Data Triangulation
Involves using different sources of information in order to increase the validity of a study
These sources are likely to be stakeholders in a program - participants, other researchers, program staff, other community members, and so on.
Then we put all data in single framework & apply various statistical tools to find out the dynamic on the market.
During the analysis stage, feedback from the stakeholder groups would be compared to determine areas of agreement as well as areas of divergence
