

Key Insights
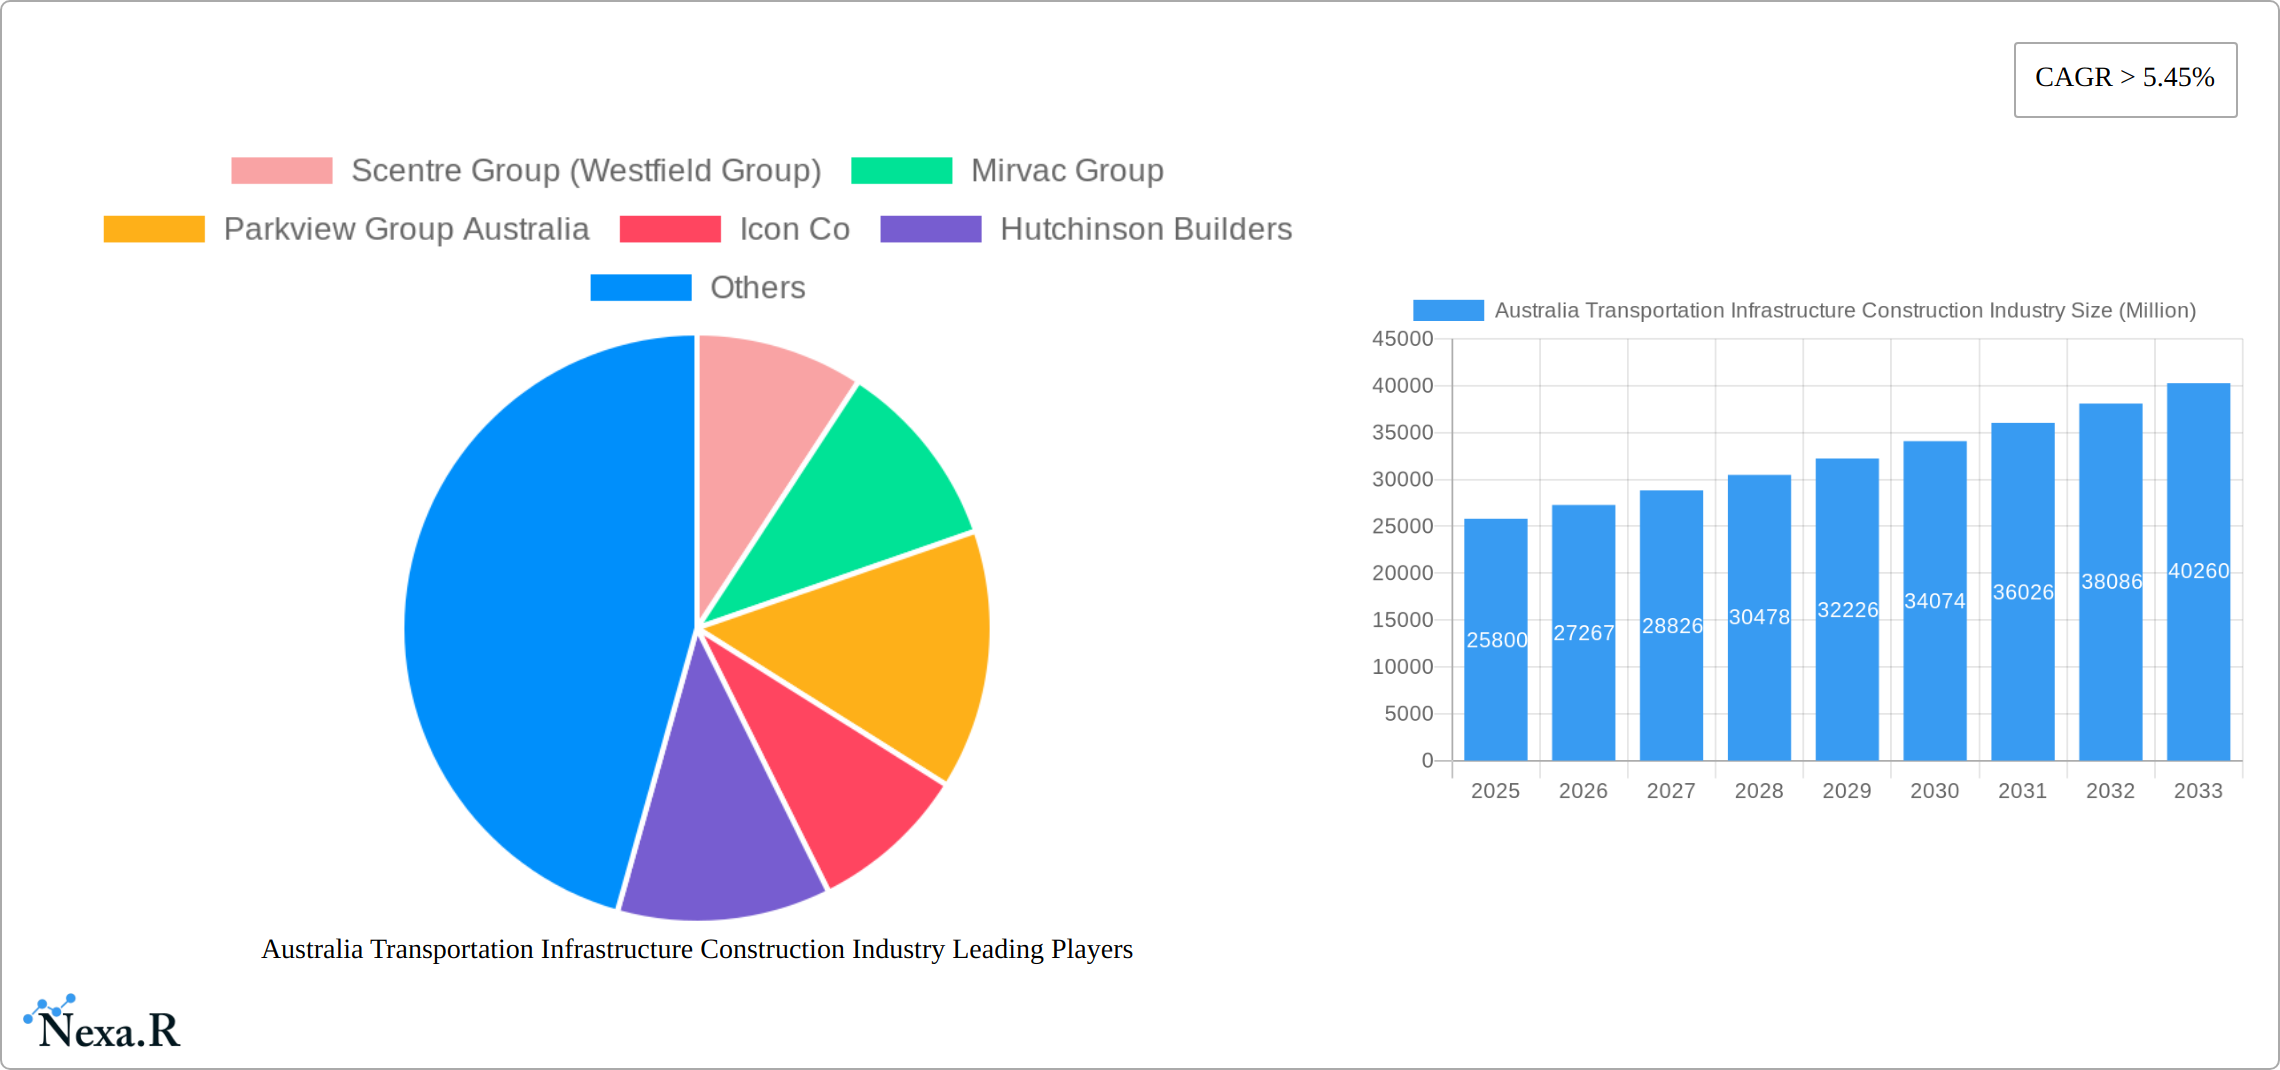
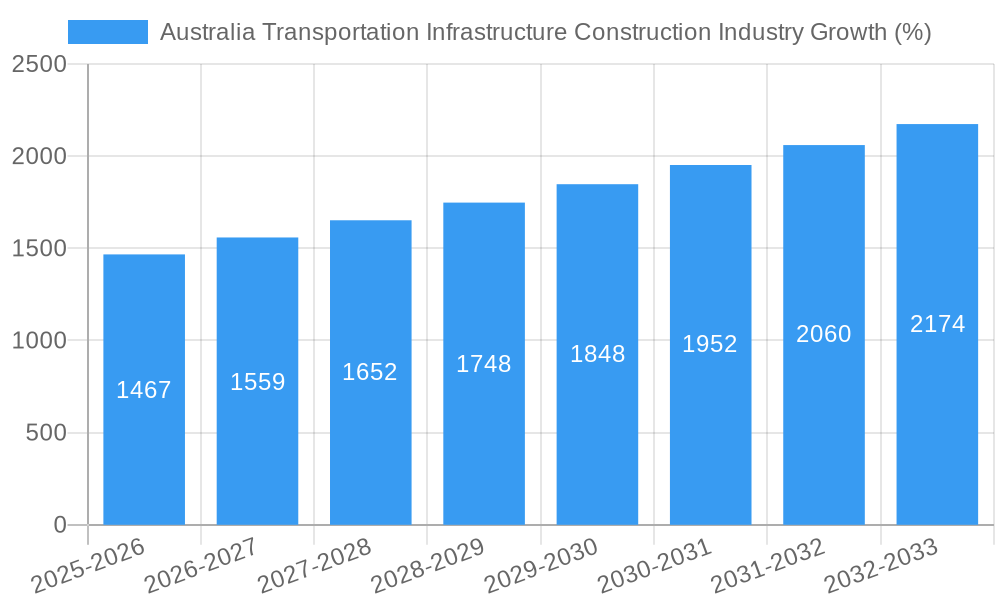
The Australian transportation infrastructure construction industry is experiencing robust growth, projected to reach a market size of $25.80 billion in 2025 and maintain a Compound Annual Growth Rate (CAGR) exceeding 5.45% from 2025 to 2033. This expansion is fueled by several key drivers. Government initiatives focused on upgrading and expanding existing infrastructure networks, such as roadways, railways, waterways, and airways, are paramount. Increased urbanization and population growth necessitate the development of efficient transportation systems to manage congestion and support economic activity. Furthermore, a commitment to sustainable infrastructure development, including investments in renewable energy sources for transport and environmentally conscious construction practices, contributes significantly to market growth. Competitive bidding and the presence of numerous established construction companies, including Scentre Group, Mirvac Group, and Lendlease, ensures a dynamic and efficient market. However, challenges remain, including potential material cost fluctuations, skilled labor shortages, and the need for effective project management to mitigate delays and cost overruns. Successfully navigating these challenges will be crucial for continued market expansion.
The segmentation of the market by transportation type (roadways, railways, waterways, and airways) provides opportunities for specialized contractors. Roadways currently dominate the market share, reflecting ongoing road expansion and maintenance projects across the country. However, significant investments in railway modernization and the development of sustainable waterway and airway infrastructure are expected to drive balanced growth across all segments in the coming years. The industry's strong growth trajectory presents significant opportunities for both established and emerging players, emphasizing the need for strategic planning and adaptability to capitalize on future prospects. The forecast period of 2025-2033 presents a promising outlook for sustained investment and innovation within the Australian transportation infrastructure construction sector.
Australia Transportation Infrastructure Construction Industry: Market Report 2019-2033
This comprehensive report provides a detailed analysis of the Australian transportation infrastructure construction industry, covering market dynamics, growth trends, key players, and future outlook. With a study period spanning 2019-2033, a base year of 2025, and a forecast period of 2025-2033, this report is an invaluable resource for industry professionals, investors, and policymakers. The report incorporates data from the historical period (2019-2024) and leverages advanced analytical techniques to project future growth.
Australia Transportation Infrastructure Construction Industry Market Dynamics & Structure
The Australian transportation infrastructure construction industry is characterized by a moderately concentrated market, with several large players holding significant market share. Market concentration is estimated at xx%, with the top 5 players accounting for approximately xx% of the total market revenue in 2025. Technological innovation, driven by advancements in materials, construction techniques, and digitalization, is a key driver, but barriers to entry, such as high capital investment and regulatory complexities, limit rapid expansion. The industry is heavily regulated, with government policies and approvals significantly influencing project development. Competitive product substitutes are limited, given the specialized nature of infrastructure projects. End-user demographics are largely driven by population growth and urbanization, necessitating continuous infrastructure development. M&A activity has been relatively moderate in recent years, with an estimated xx number of deals completed between 2019 and 2024, valued at approximately xx Million AUD.
- Market Concentration: xx% in 2025 (estimated). Top 5 players hold xx% market share.
- Technological Innovation: Focus on sustainable materials, digital construction methods, and automation.
- Regulatory Framework: Stringent environmental and safety regulations influence project timelines and costs.
- Competitive Substitutes: Limited alternatives for large-scale infrastructure projects.
- End-User Demographics: Driven by population growth and urbanization in major cities.
- M&A Activity: Approximately xx deals between 2019-2024, valued at xx Million AUD (estimated).
Australia Transportation Infrastructure Construction Industry Growth Trends & Insights
The Australian transportation infrastructure construction market experienced a CAGR of xx% during the historical period (2019-2024), reaching a market size of xx Million AUD in 2024. This growth is expected to continue, with a projected CAGR of xx% during the forecast period (2025-2033), reaching xx Million AUD by 2033. This expansion is driven by government investments in infrastructure projects, increasing urbanization, and a growing need for efficient transportation networks. Technological disruptions, such as the adoption of Building Information Modeling (BIM) and digital twin technology, are improving efficiency and reducing project completion times. Consumer behavior is shifting towards a preference for sustainable and technologically advanced infrastructure solutions. Market penetration of new technologies is increasing steadily, particularly in areas such as smart transportation systems and renewable energy integration.
Dominant Regions, Countries, or Segments in Australia Transportation Infrastructure Construction Industry
The Roadways segment dominates the Australian transportation infrastructure construction market, accounting for approximately xx% of the total market value in 2025. This is driven by the extensive road network across the country, the high volume of road construction and maintenance projects, and significant government investment in upgrading existing infrastructure and building new highways. The Railways segment is also experiencing strong growth, fueled by major projects such as Inland Rail, but currently holds a smaller market share compared to roadways. Waterways and Airways segments are comparatively smaller but show potential for future growth with specific projects and policy changes.
- Roadways: Dominant segment (xx% market share in 2025) due to extensive network and high government investment. Key drivers include population growth, urbanization, and upgrading existing infrastructure.
- Railways: Significant growth potential driven by large-scale projects like Inland Rail (AUD 403.5 Million contract awarded to Martinus Rail in 2023). Challenges remain in addressing existing infrastructure limitations.
- Waterways: Relatively smaller segment with potential for expansion through port modernization and waterway management initiatives.
- Airways: Smallest segment, primarily focused on airport expansion and maintenance projects.
Australia Transportation Infrastructure Construction Industry Product Landscape
The product landscape is characterized by a diverse range of products and services, including design and construction of roads, railways, bridges, tunnels, airports, and ports. Recent innovations include the adoption of sustainable building materials, prefabricated components, and advanced construction techniques. Key performance indicators focus on project delivery timelines, cost efficiency, and adherence to environmental regulations. Unique selling propositions frequently emphasize technological expertise, project management capabilities, and commitment to sustainable practices. Technological advancements are continuously integrated to improve efficiency and reduce project costs.
Key Drivers, Barriers & Challenges in Australia Transportation Infrastructure Construction Industry
Key Drivers:
- Significant government investment in infrastructure projects.
- Increasing urbanization and population growth.
- Need for improved transportation efficiency.
- Technological advancements leading to higher productivity.
Key Challenges:
- Supply chain disruptions leading to material cost increases and project delays (estimated impact: xx% increase in project costs in 2024).
- Regulatory hurdles and lengthy approval processes (estimated average delay: xx months).
- Intense competition among large construction firms.
- Skilled labor shortages (estimated shortage: xx% in 2024).
Emerging Opportunities in Australia Transportation Infrastructure Construction Industry
- Growing demand for sustainable and resilient infrastructure.
- Expansion of smart transportation systems and digitalization.
- Development of high-speed rail networks.
- Increased investment in public transport infrastructure.
Growth Accelerators in the Australia Transportation Infrastructure Construction Industry
Government policies promoting infrastructure development, along with advancements in construction technology and materials, are major catalysts for long-term growth. Strategic partnerships between public and private sector entities are also crucial for accelerating project delivery. Expanding into new market segments, such as renewable energy integration within infrastructure projects, presents significant growth opportunities.
Key Players Shaping the Australia Transportation Infrastructure Construction Market
- Scentre Group (Westfield Group)
- Mirvac Group
- Parkview Group Australia
- Icon Co
- Hutchinson Builders
- Downer EDI Works
- CPB Contractors
- Salini Impregilo NRW Joint Venture
- Richard Crookes Constructions
- BGC (Australia)
- BMD Constructions
- Fulton Hogan
- ADCO Constructions
- Lendlease
- Watpac Australia
- John Holland
- Built
Notable Milestones in Australia Transportation Infrastructure Construction Industry Sector
- September 2023: Inland Rail commences construction on the 170km Stockinbingal - Parkes section in NSW. Martinus Rail awarded a AUD 403.5m contract for enhancement works.
- May 2023: ARTC confirms plans to utilize solar power and battery storage for Inland Rail signaling sites.
In-Depth Australia Transportation Infrastructure Construction Industry Market Outlook
The Australian transportation infrastructure construction industry is poised for sustained growth over the next decade, driven by continued government investment, technological advancements, and evolving consumer preferences. Strategic partnerships, focus on sustainable practices, and expansion into emerging market segments will be crucial for capitalizing on future opportunities. The market's growth potential lies in addressing the challenges of efficient project delivery, skilled labor shortages, and supply chain complexities while embracing innovative technologies and sustainable practices.
Australia Transportation Infrastructure Construction Industry Segmentation
-
1. Type
- 1.1. Roadways
- 1.2. Railways
- 1.3. Waterways
- 1.4. Airways
Australia Transportation Infrastructure Construction Industry Segmentation By Geography
- 1. Australia
Australia Transportation Infrastructure Construction Industry REPORT HIGHLIGHTS
| Aspects | Details |
|---|---|
| Study Period | 2019-2033 |
| Base Year | 2024 |
| Estimated Year | 2025 |
| Forecast Period | 2025-2033 |
| Historical Period | 2019-2024 |
| Growth Rate | CAGR of > 5.45% from 2019-2033 |
| Segmentation |
|
Table of Contents
- 1. Introduction
- 1.1. Research Scope
- 1.2. Market Segmentation
- 1.3. Research Methodology
- 1.4. Definitions and Assumptions
- 2. Executive Summary
- 2.1. Introduction
- 3. Market Dynamics
- 3.1. Introduction
- 3.2. Market Drivers
- 3.2.1. 4.; Investments in Land Transportation Infrastructure4.; Development of shipping industry
- 3.3. Market Restrains
- 3.3.1. 4.; High Cost of the projects
- 3.4. Market Trends
- 3.4.1. Investments in Land Transportation Infrastructure is Driving the Market
- 4. Market Factor Analysis
- 4.1. Porters Five Forces
- 4.2. Supply/Value Chain
- 4.3. PESTEL analysis
- 4.4. Market Entropy
- 4.5. Patent/Trademark Analysis
- 5. Australia Transportation Infrastructure Construction Industry Analysis, Insights and Forecast, 2019-2031
- 5.1. Market Analysis, Insights and Forecast - by Type
- 5.1.1. Roadways
- 5.1.2. Railways
- 5.1.3. Waterways
- 5.1.4. Airways
- 5.2. Market Analysis, Insights and Forecast - by Region
- 5.2.1. Australia
- 5.1. Market Analysis, Insights and Forecast - by Type
- 6. Competitive Analysis
- 6.1. Market Share Analysis 2024
- 6.2. Company Profiles
- 6.2.1 Scentre Group (Westfield Group)
- 6.2.1.1. Overview
- 6.2.1.2. Products
- 6.2.1.3. SWOT Analysis
- 6.2.1.4. Recent Developments
- 6.2.1.5. Financials (Based on Availability)
- 6.2.2 Mirvac Group
- 6.2.2.1. Overview
- 6.2.2.2. Products
- 6.2.2.3. SWOT Analysis
- 6.2.2.4. Recent Developments
- 6.2.2.5. Financials (Based on Availability)
- 6.2.3 Parkview Group Australia
- 6.2.3.1. Overview
- 6.2.3.2. Products
- 6.2.3.3. SWOT Analysis
- 6.2.3.4. Recent Developments
- 6.2.3.5. Financials (Based on Availability)
- 6.2.4 Icon Co
- 6.2.4.1. Overview
- 6.2.4.2. Products
- 6.2.4.3. SWOT Analysis
- 6.2.4.4. Recent Developments
- 6.2.4.5. Financials (Based on Availability)
- 6.2.5 Hutchinson Builders
- 6.2.5.1. Overview
- 6.2.5.2. Products
- 6.2.5.3. SWOT Analysis
- 6.2.5.4. Recent Developments
- 6.2.5.5. Financials (Based on Availability)
- 6.2.6 Downer EDI Works**List Not Exhaustive
- 6.2.6.1. Overview
- 6.2.6.2. Products
- 6.2.6.3. SWOT Analysis
- 6.2.6.4. Recent Developments
- 6.2.6.5. Financials (Based on Availability)
- 6.2.7 CPB Contractors
- 6.2.7.1. Overview
- 6.2.7.2. Products
- 6.2.7.3. SWOT Analysis
- 6.2.7.4. Recent Developments
- 6.2.7.5. Financials (Based on Availability)
- 6.2.8 Salini Impregilo NRW Joint Venture
- 6.2.8.1. Overview
- 6.2.8.2. Products
- 6.2.8.3. SWOT Analysis
- 6.2.8.4. Recent Developments
- 6.2.8.5. Financials (Based on Availability)
- 6.2.9 Richard Crookes Constructions
- 6.2.9.1. Overview
- 6.2.9.2. Products
- 6.2.9.3. SWOT Analysis
- 6.2.9.4. Recent Developments
- 6.2.9.5. Financials (Based on Availability)
- 6.2.10 BGC (Australia)
- 6.2.10.1. Overview
- 6.2.10.2. Products
- 6.2.10.3. SWOT Analysis
- 6.2.10.4. Recent Developments
- 6.2.10.5. Financials (Based on Availability)
- 6.2.11 BMD Constructions
- 6.2.11.1. Overview
- 6.2.11.2. Products
- 6.2.11.3. SWOT Analysis
- 6.2.11.4. Recent Developments
- 6.2.11.5. Financials (Based on Availability)
- 6.2.12 Fulton Hogan
- 6.2.12.1. Overview
- 6.2.12.2. Products
- 6.2.12.3. SWOT Analysis
- 6.2.12.4. Recent Developments
- 6.2.12.5. Financials (Based on Availability)
- 6.2.13 ADCO Constructions
- 6.2.13.1. Overview
- 6.2.13.2. Products
- 6.2.13.3. SWOT Analysis
- 6.2.13.4. Recent Developments
- 6.2.13.5. Financials (Based on Availability)
- 6.2.14 Lendlease
- 6.2.14.1. Overview
- 6.2.14.2. Products
- 6.2.14.3. SWOT Analysis
- 6.2.14.4. Recent Developments
- 6.2.14.5. Financials (Based on Availability)
- 6.2.15 Watpac Australia
- 6.2.15.1. Overview
- 6.2.15.2. Products
- 6.2.15.3. SWOT Analysis
- 6.2.15.4. Recent Developments
- 6.2.15.5. Financials (Based on Availability)
- 6.2.16 John Holland
- 6.2.16.1. Overview
- 6.2.16.2. Products
- 6.2.16.3. SWOT Analysis
- 6.2.16.4. Recent Developments
- 6.2.16.5. Financials (Based on Availability)
- 6.2.17 Built
- 6.2.17.1. Overview
- 6.2.17.2. Products
- 6.2.17.3. SWOT Analysis
- 6.2.17.4. Recent Developments
- 6.2.17.5. Financials (Based on Availability)
- 6.2.1 Scentre Group (Westfield Group)
List of Figures
- Figure 1: Australia Transportation Infrastructure Construction Industry Revenue Breakdown (Million, %) by Product 2024 & 2032
- Figure 2: Australia Transportation Infrastructure Construction Industry Share (%) by Company 2024
List of Tables
- Table 1: Australia Transportation Infrastructure Construction Industry Revenue Million Forecast, by Region 2019 & 2032
- Table 2: Australia Transportation Infrastructure Construction Industry Revenue Million Forecast, by Type 2019 & 2032
- Table 3: Australia Transportation Infrastructure Construction Industry Revenue Million Forecast, by Region 2019 & 2032
- Table 4: Australia Transportation Infrastructure Construction Industry Revenue Million Forecast, by Country 2019 & 2032
- Table 5: Australia Transportation Infrastructure Construction Industry Revenue Million Forecast, by Type 2019 & 2032
- Table 6: Australia Transportation Infrastructure Construction Industry Revenue Million Forecast, by Country 2019 & 2032
Frequently Asked Questions
1. What is the projected Compound Annual Growth Rate (CAGR) of the Australia Transportation Infrastructure Construction Industry?
The projected CAGR is approximately > 5.45%.
2. Which companies are prominent players in the Australia Transportation Infrastructure Construction Industry?
Key companies in the market include Scentre Group (Westfield Group), Mirvac Group, Parkview Group Australia, Icon Co, Hutchinson Builders, Downer EDI Works**List Not Exhaustive, CPB Contractors, Salini Impregilo NRW Joint Venture, Richard Crookes Constructions, BGC (Australia), BMD Constructions, Fulton Hogan, ADCO Constructions, Lendlease, Watpac Australia, John Holland, Built.
3. What are the main segments of the Australia Transportation Infrastructure Construction Industry?
The market segments include Type.
4. Can you provide details about the market size?
The market size is estimated to be USD 25.80 Million as of 2022.
5. What are some drivers contributing to market growth?
4.; Investments in Land Transportation Infrastructure4.; Development of shipping industry.
6. What are the notable trends driving market growth?
Investments in Land Transportation Infrastructure is Driving the Market.
7. Are there any restraints impacting market growth?
4.; High Cost of the projects.
8. Can you provide examples of recent developments in the market?
September 2023, INLAND Rail has marked the start of construction on the 170km Stockinbingal - Parkes section in New South Wales with a launch event at Forbes station. Martinus Rail has been awarded an AUD 403.5m (USD 259.3m) contract to design and construct enhancement works on the Stockinbingal - Parkes and Albury - Illabo sections. Construction on the Inland Rail project to connect Melbourne and Brisbane with a new 1600km freight corridor through Victoria, New South Wales, and Queensland started in 2018. Inland Rail will provide an alternative to the congested coastal route through Sydney. The project involves upgrading existing lines and some new construction.
9. What pricing options are available for accessing the report?
Pricing options include single-user, multi-user, and enterprise licenses priced at USD 3800, USD 4500, and USD 5800 respectively.
10. Is the market size provided in terms of value or volume?
The market size is provided in terms of value, measured in Million.
11. Are there any specific market keywords associated with the report?
Yes, the market keyword associated with the report is "Australia Transportation Infrastructure Construction Industry," which aids in identifying and referencing the specific market segment covered.
12. How do I determine which pricing option suits my needs best?
The pricing options vary based on user requirements and access needs. Individual users may opt for single-user licenses, while businesses requiring broader access may choose multi-user or enterprise licenses for cost-effective access to the report.
13. Are there any additional resources or data provided in the Australia Transportation Infrastructure Construction Industry report?
While the report offers comprehensive insights, it's advisable to review the specific contents or supplementary materials provided to ascertain if additional resources or data are available.
14. How can I stay updated on further developments or reports in the Australia Transportation Infrastructure Construction Industry?
To stay informed about further developments, trends, and reports in the Australia Transportation Infrastructure Construction Industry, consider subscribing to industry newsletters, following relevant companies and organizations, or regularly checking reputable industry news sources and publications.
Methodology
Step 1 - Identification of Relevant Samples Size from Population Database


Step 2 - Approaches for Defining Global Market Size (Value, Volume* & Price*)

Note*: In applicable scenarios
Step 3 - Data Sources
Primary Research
- Web Analytics
- Survey Reports
- Research Institute
- Latest Research Reports
- Opinion Leaders
Secondary Research
- Annual Reports
- White Paper
- Latest Press Release
- Industry Association
- Paid Database
- Investor Presentations

Step 4 - Data Triangulation
Involves using different sources of information in order to increase the validity of a study
These sources are likely to be stakeholders in a program - participants, other researchers, program staff, other community members, and so on.
Then we put all data in single framework & apply various statistical tools to find out the dynamic on the market.
During the analysis stage, feedback from the stakeholder groups would be compared to determine areas of agreement as well as areas of divergence
