

Key Insights
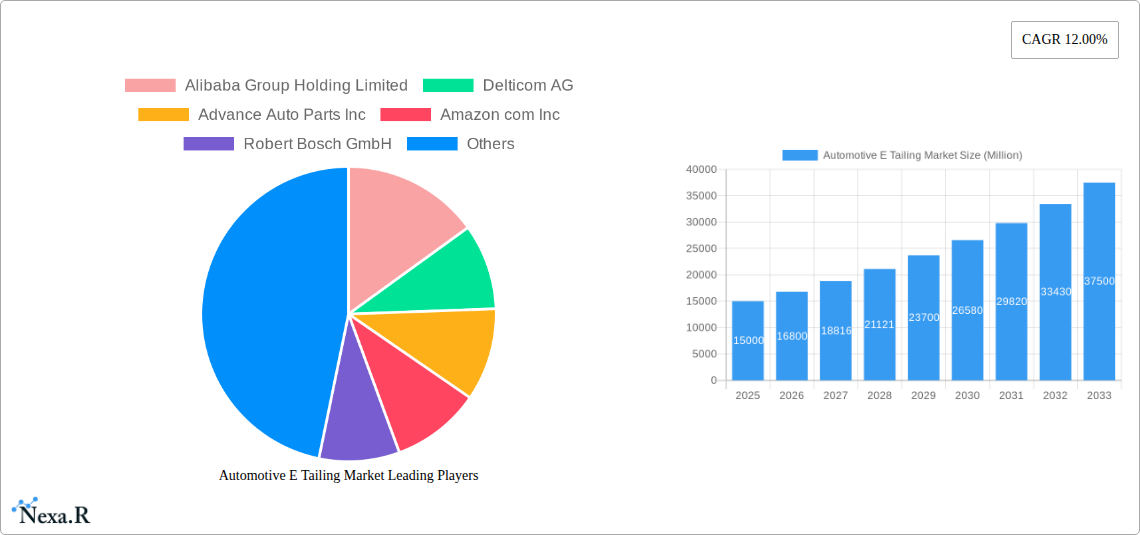
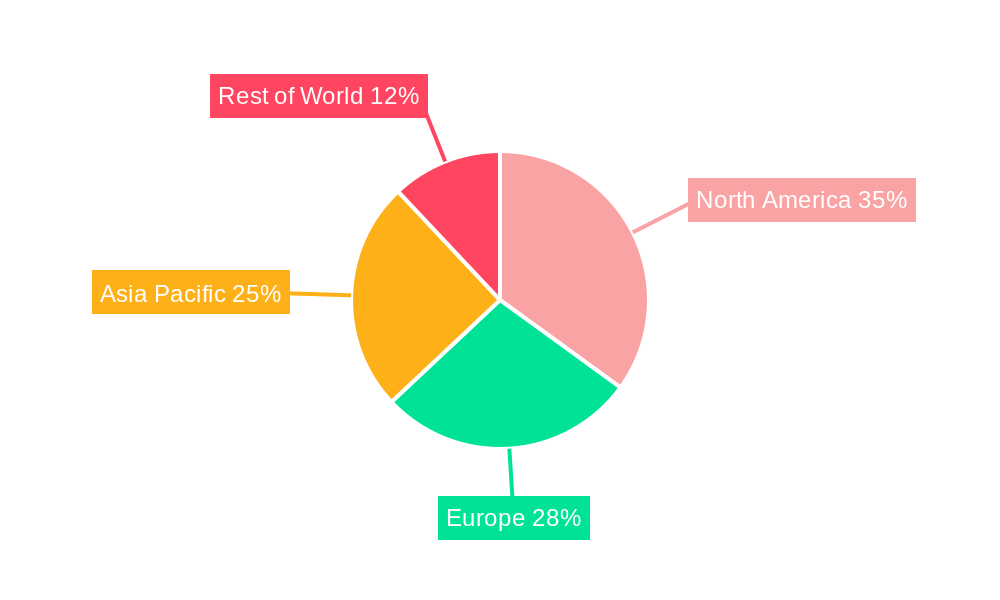
The global automotive e-tailing market is experiencing robust growth, driven by the increasing penetration of e-commerce, the rising preference for online shopping among consumers, and the expanding availability of automotive parts and accessories online. The market's Compound Annual Growth Rate (CAGR) of 12% from 2019 to 2024 suggests a significant upward trajectory, indicating substantial market expansion. This growth is further fueled by advancements in logistics and delivery networks, making online purchasing of automotive products more convenient and reliable. The segmentation of the market by component type (electrical, infotainment, engine, tires, etc.), vehicle type (passenger cars, commercial vehicles, two-wheelers), and vendor type (OEMs and third-party vendors) provides valuable insights into diverse growth patterns within the sector. North America and Asia-Pacific are projected to be leading regional markets due to factors such as high vehicle ownership, robust e-commerce infrastructure, and growing disposable incomes. The presence of major e-commerce players like Alibaba, Amazon, and Walmart further underlines the market's dynamism and competitive landscape.
However, challenges remain. The complexities of shipping bulky automotive parts, concerns regarding product authenticity and quality control, and the need for specialized technical expertise in certain product categories could hinder growth. Furthermore, the market is likely to face pressure from fluctuating fuel prices and overall economic conditions impacting consumer spending. Nevertheless, the ongoing integration of advanced technologies, such as augmented reality and virtual reality, for enhancing online shopping experiences and the emergence of innovative business models, like subscription services for automotive parts, are expected to drive growth and mitigate some of the challenges. The forecast period of 2025-2033 promises continued expansion, making automotive e-tailing an attractive market for investors and businesses alike.
Automotive E-Tailing Market: A Comprehensive Report (2019-2033)
This comprehensive report provides a detailed analysis of the Automotive E-Tailing market, encompassing its current state, future trajectory, and key players. We delve into market dynamics, growth trends, regional dominance, product landscapes, and emerging opportunities, offering invaluable insights for industry professionals, investors, and strategists. The study period spans from 2019 to 2033, with 2025 serving as the base and estimated year. The market is segmented by component type (electrical components, infotainment and multimedia, engine components, tires and wheels, other component types), vehicle type (passenger cars, commercial vehicles, two-wheelers), and vendor type (OEM, third-party vendor). Key players analyzed include Alibaba Group Holding Limited, Delticom AG, Advance Auto Parts Inc., Amazon.com Inc., Robert Bosch GmbH, AutoZone Inc., Flipkart, eBay Inc., O'Reilly Automotive Inc., and Walmart Inc. (List not exhaustive). The report projects a market valued at xx million units by 2025, poised for significant growth in the forecast period (2025-2033).
Automotive E-Tailing Market Market Dynamics & Structure
The Automotive E-Tailing market is characterized by a dynamic interplay of factors influencing its structure and growth. Market concentration is moderate, with several major players competing alongside numerous smaller, specialized retailers. Technological innovation, particularly in areas like e-commerce platforms, digital catalogs, and AI-powered recommendation systems, is a major driver. Regulatory frameworks concerning data privacy, consumer protection, and product safety significantly impact operations. The rise of subscription services for maintenance and parts is creating new competitive substitutes. End-user demographics, including age, tech-savviness, and DIY inclination, significantly influence buying behavior.
- Market Concentration: Moderate, with a mix of large multinational corporations and smaller specialized players. The top 5 players control approximately xx% of the market share (2024).
- Technological Innovation: Key innovations include AI-driven personalized recommendations, AR/VR for parts visualization, and improved logistics systems.
- Regulatory Framework: Compliance with data privacy regulations (e.g., GDPR, CCPA) is a critical operational challenge.
- Competitive Substitutes: Subscription-based maintenance services and in-person repair shops present competition.
- M&A Trends: The last 5 years have witnessed xx M&A deals, primarily driven by expanding market reach and enhancing technological capabilities.
Automotive E-Tailing Market Growth Trends & Insights
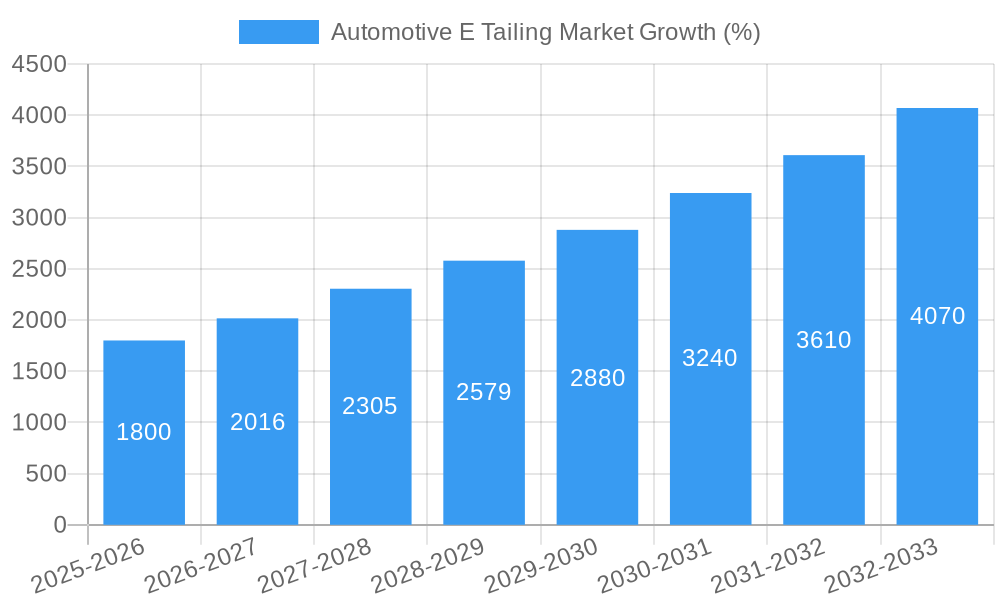
The Automotive E-Tailing market experienced significant growth during the historical period (2019-2024), driven by increasing internet penetration, rising adoption of e-commerce, and a preference for convenience. The market is expected to maintain a healthy Compound Annual Growth Rate (CAGR) of xx% during the forecast period (2025-2033). Technological disruptions, such as the expansion of mobile commerce and the integration of IoT devices, further accelerate growth. Consumer behavior is shifting toward online purchasing due to convenience and competitive pricing. The market penetration rate in mature markets is currently at xx%, projected to reach xx% by 2033, indicating substantial growth potential.
Dominant Regions, Countries, or Segments in Automotive E-Tailing Market
North America and Europe currently dominate the Automotive E-Tailing market due to high internet penetration, established e-commerce infrastructure, and high disposable incomes. However, Asia-Pacific, particularly China and India, shows significant growth potential due to increasing vehicle ownership, expanding middle class, and rapid e-commerce adoption.
- By Component Type: The engine components segment holds the largest market share currently, followed by electrical components and tires and wheels.
- By Vehicle Type: Passenger cars segment dominates, but the commercial vehicles segment is expected to experience faster growth in the forecast period.
- By Vendor Type: Third-party vendors currently lead the market; however, OEMs are increasingly adopting e-tailing strategies.
- Key Drivers: Robust e-commerce infrastructure, supportive government policies promoting digital trade, and expanding vehicle ownership in developing economies contribute significantly to market dominance.
Automotive E-Tailing Market Product Landscape
The Automotive E-Tailing market showcases a diverse range of products, from individual parts to entire kits. Product innovations focus on improved searchability, detailed product descriptions with high-quality images and videos, and interactive tools for fitting checks. Performance metrics emphasize customer reviews, delivery speed, and return policies. Unique selling propositions involve offering competitive prices, exclusive deals, and loyalty programs. Technological advancements include integrating AR/VR for parts visualization and AI-powered recommendation engines, enhancing customer experience.
Key Drivers, Barriers & Challenges in Automotive E-Tailing Market
Key Drivers:
- Increasing internet and smartphone penetration.
- Growing preference for convenient online shopping.
- Expanding vehicle ownership, particularly in developing economies.
- Technological advancements enhancing online shopping experience.
Key Challenges and Restraints:
- Complex supply chain logistics for parts delivery and returns.
- Counterfeit products and quality control issues.
- Ensuring data security and protecting consumer privacy.
- Regulatory hurdles related to e-commerce in certain regions. The estimated impact of these challenges on the market is a reduction in annual growth of approximately xx%
Emerging Opportunities in Automotive E-Tailing Market
- Expansion into underserved markets with limited brick-and-mortar options.
- Development of specialized e-tailing platforms for specific vehicle types or parts.
- Increased focus on value-added services, such as virtual consultations and installation guides.
- Leveraging big data analytics to personalize offerings and enhance customer loyalty.
Growth Accelerators in the Automotive E-Tailing Market Industry
Strategic partnerships between online retailers and automotive manufacturers, technological advancements in supply chain management and fulfillment, and aggressive marketing campaigns promoting online shopping experience are key growth catalysts. Expansion into newer markets coupled with continuous product diversification and improvement further enhance the market's long-term growth prospects.
Key Players Shaping the Automotive E-Tailing Market Market
- Alibaba Group Holding Limited
- Delticom AG
- Advance Auto Parts Inc.
- Amazon.com Inc.
- Robert Bosch GmbH
- AutoZone Inc.
- Flipkart
- eBay Inc.
- O'Reilly Automotive Inc.
- Walmart Inc.
Notable Milestones in Automotive E-Tailing Market Sector
- February 2021: CarParts.com partnered with McDowell and Front Row Motorsports (FRM) for increased brand engagement.
- February 2021: Advance Auto Parts partnered with NASCAR and Team Penske, leveraging NASCAR sponsorship for increased visibility.
- November 2021: Advance Auto Parts launched Carquest by Advance, targeting the DIY automotive repair market.
- December 2021: Alibaba Group Holding Ltd. reorganized its e-commerce businesses for improved agility and growth.
In-Depth Automotive E-Tailing Market Market Outlook
The Automotive E-Tailing market is poised for sustained growth, driven by ongoing technological innovation, expanding e-commerce adoption globally, and the increasing preference for online convenience. Strategic partnerships, market expansion, and the development of innovative solutions will shape the future of the sector. Opportunities abound for businesses that can effectively leverage technology, enhance customer experiences, and efficiently manage complex supply chains. The market presents promising prospects for both established players and new entrants.
Automotive E Tailing Market Segmentation
-
1. Component Type
- 1.1. Electrical Components
- 1.2. Infotainment and Multimedia
- 1.3. Engine Components
- 1.4. Tires and Wheel
- 1.5. Other Component Types
-
2. Vehicle Type
- 2.1. Passenger Cars
- 2.2. Commercial Vehicles
- 2.3. Two-wheelers
-
3. Vendor Type
- 3.1. OEM
- 3.2. Third-party Vendor
Automotive E Tailing Market Segmentation By Geography
-
1. North America
- 1.1. United States
- 1.2. Canada
- 1.3. Rest of North America
-
2. Europe
- 2.1. Germany
- 2.2. United Kingdom
- 2.3. France
- 2.4. Italy
- 2.5. Rest of Europe
-
3. Asia Pacific
- 3.1. India
- 3.2. China
- 3.3. Japan
- 3.4. South Korea
- 3.5. Rest of Asia Pacific
-
4. Rest of the World
- 4.1. South America
- 4.2. Middle East and Africa
Automotive E Tailing Market REPORT HIGHLIGHTS
| Aspects | Details |
|---|---|
| Study Period | 2019-2033 |
| Base Year | 2024 |
| Estimated Year | 2025 |
| Forecast Period | 2025-2033 |
| Historical Period | 2019-2024 |
| Growth Rate | CAGR of 12.00% from 2019-2033 |
| Segmentation |
|
Table of Contents
- 1. Introduction
- 1.1. Research Scope
- 1.2. Market Segmentation
- 1.3. Research Methodology
- 1.4. Definitions and Assumptions
- 2. Executive Summary
- 2.1. Introduction
- 3. Market Dynamics
- 3.1. Introduction
- 3.2. Market Drivers
- 3.2.1. Rise in Vehicle Electrification
- 3.3. Market Restrains
- 3.3.1. The Cost of Raw Materials Used in the Manufacturing of Switches is High
- 3.4. Market Trends
- 3.4.1. The Infotainment and Multimedia Segment to Hold Major Share in the Market
- 4. Market Factor Analysis
- 4.1. Porters Five Forces
- 4.2. Supply/Value Chain
- 4.3. PESTEL analysis
- 4.4. Market Entropy
- 4.5. Patent/Trademark Analysis
- 5. Global Automotive E Tailing Market Analysis, Insights and Forecast, 2019-2031
- 5.1. Market Analysis, Insights and Forecast - by Component Type
- 5.1.1. Electrical Components
- 5.1.2. Infotainment and Multimedia
- 5.1.3. Engine Components
- 5.1.4. Tires and Wheel
- 5.1.5. Other Component Types
- 5.2. Market Analysis, Insights and Forecast - by Vehicle Type
- 5.2.1. Passenger Cars
- 5.2.2. Commercial Vehicles
- 5.2.3. Two-wheelers
- 5.3. Market Analysis, Insights and Forecast - by Vendor Type
- 5.3.1. OEM
- 5.3.2. Third-party Vendor
- 5.4. Market Analysis, Insights and Forecast - by Region
- 5.4.1. North America
- 5.4.2. Europe
- 5.4.3. Asia Pacific
- 5.4.4. Rest of the World
- 5.1. Market Analysis, Insights and Forecast - by Component Type
- 6. North America Automotive E Tailing Market Analysis, Insights and Forecast, 2019-2031
- 6.1. Market Analysis, Insights and Forecast - by Component Type
- 6.1.1. Electrical Components
- 6.1.2. Infotainment and Multimedia
- 6.1.3. Engine Components
- 6.1.4. Tires and Wheel
- 6.1.5. Other Component Types
- 6.2. Market Analysis, Insights and Forecast - by Vehicle Type
- 6.2.1. Passenger Cars
- 6.2.2. Commercial Vehicles
- 6.2.3. Two-wheelers
- 6.3. Market Analysis, Insights and Forecast - by Vendor Type
- 6.3.1. OEM
- 6.3.2. Third-party Vendor
- 6.1. Market Analysis, Insights and Forecast - by Component Type
- 7. Europe Automotive E Tailing Market Analysis, Insights and Forecast, 2019-2031
- 7.1. Market Analysis, Insights and Forecast - by Component Type
- 7.1.1. Electrical Components
- 7.1.2. Infotainment and Multimedia
- 7.1.3. Engine Components
- 7.1.4. Tires and Wheel
- 7.1.5. Other Component Types
- 7.2. Market Analysis, Insights and Forecast - by Vehicle Type
- 7.2.1. Passenger Cars
- 7.2.2. Commercial Vehicles
- 7.2.3. Two-wheelers
- 7.3. Market Analysis, Insights and Forecast - by Vendor Type
- 7.3.1. OEM
- 7.3.2. Third-party Vendor
- 7.1. Market Analysis, Insights and Forecast - by Component Type
- 8. Asia Pacific Automotive E Tailing Market Analysis, Insights and Forecast, 2019-2031
- 8.1. Market Analysis, Insights and Forecast - by Component Type
- 8.1.1. Electrical Components
- 8.1.2. Infotainment and Multimedia
- 8.1.3. Engine Components
- 8.1.4. Tires and Wheel
- 8.1.5. Other Component Types
- 8.2. Market Analysis, Insights and Forecast - by Vehicle Type
- 8.2.1. Passenger Cars
- 8.2.2. Commercial Vehicles
- 8.2.3. Two-wheelers
- 8.3. Market Analysis, Insights and Forecast - by Vendor Type
- 8.3.1. OEM
- 8.3.2. Third-party Vendor
- 8.1. Market Analysis, Insights and Forecast - by Component Type
- 9. Rest of the World Automotive E Tailing Market Analysis, Insights and Forecast, 2019-2031
- 9.1. Market Analysis, Insights and Forecast - by Component Type
- 9.1.1. Electrical Components
- 9.1.2. Infotainment and Multimedia
- 9.1.3. Engine Components
- 9.1.4. Tires and Wheel
- 9.1.5. Other Component Types
- 9.2. Market Analysis, Insights and Forecast - by Vehicle Type
- 9.2.1. Passenger Cars
- 9.2.2. Commercial Vehicles
- 9.2.3. Two-wheelers
- 9.3. Market Analysis, Insights and Forecast - by Vendor Type
- 9.3.1. OEM
- 9.3.2. Third-party Vendor
- 9.1. Market Analysis, Insights and Forecast - by Component Type
- 10. North America Automotive E Tailing Market Analysis, Insights and Forecast, 2019-2031
- 10.1. Market Analysis, Insights and Forecast - By Country/Sub-region
- 10.1.1 United States
- 10.1.2 Canada
- 10.1.3 Rest of North America
- 11. Europe Automotive E Tailing Market Analysis, Insights and Forecast, 2019-2031
- 11.1. Market Analysis, Insights and Forecast - By Country/Sub-region
- 11.1.1 Germany
- 11.1.2 United Kingdom
- 11.1.3 France
- 11.1.4 Italy
- 11.1.5 Rest of Europe
- 12. Asia Pacific Automotive E Tailing Market Analysis, Insights and Forecast, 2019-2031
- 12.1. Market Analysis, Insights and Forecast - By Country/Sub-region
- 12.1.1 India
- 12.1.2 China
- 12.1.3 Japan
- 12.1.4 South Korea
- 12.1.5 Rest of Asia Pacific
- 13. Rest of the World Automotive E Tailing Market Analysis, Insights and Forecast, 2019-2031
- 13.1. Market Analysis, Insights and Forecast - By Country/Sub-region
- 13.1.1 South America
- 13.1.2 Middle East and Africa
- 14. Competitive Analysis
- 14.1. Global Market Share Analysis 2024
- 14.2. Company Profiles
- 14.2.1 Alibaba Group Holding Limited
- 14.2.1.1. Overview
- 14.2.1.2. Products
- 14.2.1.3. SWOT Analysis
- 14.2.1.4. Recent Developments
- 14.2.1.5. Financials (Based on Availability)
- 14.2.2 Delticom AG
- 14.2.2.1. Overview
- 14.2.2.2. Products
- 14.2.2.3. SWOT Analysis
- 14.2.2.4. Recent Developments
- 14.2.2.5. Financials (Based on Availability)
- 14.2.3 Advance Auto Parts Inc
- 14.2.3.1. Overview
- 14.2.3.2. Products
- 14.2.3.3. SWOT Analysis
- 14.2.3.4. Recent Developments
- 14.2.3.5. Financials (Based on Availability)
- 14.2.4 Amazon com Inc
- 14.2.4.1. Overview
- 14.2.4.2. Products
- 14.2.4.3. SWOT Analysis
- 14.2.4.4. Recent Developments
- 14.2.4.5. Financials (Based on Availability)
- 14.2.5 Robert Bosch GmbH
- 14.2.5.1. Overview
- 14.2.5.2. Products
- 14.2.5.3. SWOT Analysis
- 14.2.5.4. Recent Developments
- 14.2.5.5. Financials (Based on Availability)
- 14.2.6 AutoZone Inc
- 14.2.6.1. Overview
- 14.2.6.2. Products
- 14.2.6.3. SWOT Analysis
- 14.2.6.4. Recent Developments
- 14.2.6.5. Financials (Based on Availability)
- 14.2.7 Flipkart*List Not Exhaustive
- 14.2.7.1. Overview
- 14.2.7.2. Products
- 14.2.7.3. SWOT Analysis
- 14.2.7.4. Recent Developments
- 14.2.7.5. Financials (Based on Availability)
- 14.2.8 eBay Inc
- 14.2.8.1. Overview
- 14.2.8.2. Products
- 14.2.8.3. SWOT Analysis
- 14.2.8.4. Recent Developments
- 14.2.8.5. Financials (Based on Availability)
- 14.2.9 O'reilly Automotive Inc
- 14.2.9.1. Overview
- 14.2.9.2. Products
- 14.2.9.3. SWOT Analysis
- 14.2.9.4. Recent Developments
- 14.2.9.5. Financials (Based on Availability)
- 14.2.10 Walmart Inc
- 14.2.10.1. Overview
- 14.2.10.2. Products
- 14.2.10.3. SWOT Analysis
- 14.2.10.4. Recent Developments
- 14.2.10.5. Financials (Based on Availability)
- 14.2.1 Alibaba Group Holding Limited
List of Figures
- Figure 1: Global Automotive E Tailing Market Revenue Breakdown (Million, %) by Region 2024 & 2032
- Figure 2: North America Automotive E Tailing Market Revenue (Million), by Country 2024 & 2032
- Figure 3: North America Automotive E Tailing Market Revenue Share (%), by Country 2024 & 2032
- Figure 4: Europe Automotive E Tailing Market Revenue (Million), by Country 2024 & 2032
- Figure 5: Europe Automotive E Tailing Market Revenue Share (%), by Country 2024 & 2032
- Figure 6: Asia Pacific Automotive E Tailing Market Revenue (Million), by Country 2024 & 2032
- Figure 7: Asia Pacific Automotive E Tailing Market Revenue Share (%), by Country 2024 & 2032
- Figure 8: Rest of the World Automotive E Tailing Market Revenue (Million), by Country 2024 & 2032
- Figure 9: Rest of the World Automotive E Tailing Market Revenue Share (%), by Country 2024 & 2032
- Figure 10: North America Automotive E Tailing Market Revenue (Million), by Component Type 2024 & 2032
- Figure 11: North America Automotive E Tailing Market Revenue Share (%), by Component Type 2024 & 2032
- Figure 12: North America Automotive E Tailing Market Revenue (Million), by Vehicle Type 2024 & 2032
- Figure 13: North America Automotive E Tailing Market Revenue Share (%), by Vehicle Type 2024 & 2032
- Figure 14: North America Automotive E Tailing Market Revenue (Million), by Vendor Type 2024 & 2032
- Figure 15: North America Automotive E Tailing Market Revenue Share (%), by Vendor Type 2024 & 2032
- Figure 16: North America Automotive E Tailing Market Revenue (Million), by Country 2024 & 2032
- Figure 17: North America Automotive E Tailing Market Revenue Share (%), by Country 2024 & 2032
- Figure 18: Europe Automotive E Tailing Market Revenue (Million), by Component Type 2024 & 2032
- Figure 19: Europe Automotive E Tailing Market Revenue Share (%), by Component Type 2024 & 2032
- Figure 20: Europe Automotive E Tailing Market Revenue (Million), by Vehicle Type 2024 & 2032
- Figure 21: Europe Automotive E Tailing Market Revenue Share (%), by Vehicle Type 2024 & 2032
- Figure 22: Europe Automotive E Tailing Market Revenue (Million), by Vendor Type 2024 & 2032
- Figure 23: Europe Automotive E Tailing Market Revenue Share (%), by Vendor Type 2024 & 2032
- Figure 24: Europe Automotive E Tailing Market Revenue (Million), by Country 2024 & 2032
- Figure 25: Europe Automotive E Tailing Market Revenue Share (%), by Country 2024 & 2032
- Figure 26: Asia Pacific Automotive E Tailing Market Revenue (Million), by Component Type 2024 & 2032
- Figure 27: Asia Pacific Automotive E Tailing Market Revenue Share (%), by Component Type 2024 & 2032
- Figure 28: Asia Pacific Automotive E Tailing Market Revenue (Million), by Vehicle Type 2024 & 2032
- Figure 29: Asia Pacific Automotive E Tailing Market Revenue Share (%), by Vehicle Type 2024 & 2032
- Figure 30: Asia Pacific Automotive E Tailing Market Revenue (Million), by Vendor Type 2024 & 2032
- Figure 31: Asia Pacific Automotive E Tailing Market Revenue Share (%), by Vendor Type 2024 & 2032
- Figure 32: Asia Pacific Automotive E Tailing Market Revenue (Million), by Country 2024 & 2032
- Figure 33: Asia Pacific Automotive E Tailing Market Revenue Share (%), by Country 2024 & 2032
- Figure 34: Rest of the World Automotive E Tailing Market Revenue (Million), by Component Type 2024 & 2032
- Figure 35: Rest of the World Automotive E Tailing Market Revenue Share (%), by Component Type 2024 & 2032
- Figure 36: Rest of the World Automotive E Tailing Market Revenue (Million), by Vehicle Type 2024 & 2032
- Figure 37: Rest of the World Automotive E Tailing Market Revenue Share (%), by Vehicle Type 2024 & 2032
- Figure 38: Rest of the World Automotive E Tailing Market Revenue (Million), by Vendor Type 2024 & 2032
- Figure 39: Rest of the World Automotive E Tailing Market Revenue Share (%), by Vendor Type 2024 & 2032
- Figure 40: Rest of the World Automotive E Tailing Market Revenue (Million), by Country 2024 & 2032
- Figure 41: Rest of the World Automotive E Tailing Market Revenue Share (%), by Country 2024 & 2032
List of Tables
- Table 1: Global Automotive E Tailing Market Revenue Million Forecast, by Region 2019 & 2032
- Table 2: Global Automotive E Tailing Market Revenue Million Forecast, by Component Type 2019 & 2032
- Table 3: Global Automotive E Tailing Market Revenue Million Forecast, by Vehicle Type 2019 & 2032
- Table 4: Global Automotive E Tailing Market Revenue Million Forecast, by Vendor Type 2019 & 2032
- Table 5: Global Automotive E Tailing Market Revenue Million Forecast, by Region 2019 & 2032
- Table 6: Global Automotive E Tailing Market Revenue Million Forecast, by Country 2019 & 2032
- Table 7: United States Automotive E Tailing Market Revenue (Million) Forecast, by Application 2019 & 2032
- Table 8: Canada Automotive E Tailing Market Revenue (Million) Forecast, by Application 2019 & 2032
- Table 9: Rest of North America Automotive E Tailing Market Revenue (Million) Forecast, by Application 2019 & 2032
- Table 10: Global Automotive E Tailing Market Revenue Million Forecast, by Country 2019 & 2032
- Table 11: Germany Automotive E Tailing Market Revenue (Million) Forecast, by Application 2019 & 2032
- Table 12: United Kingdom Automotive E Tailing Market Revenue (Million) Forecast, by Application 2019 & 2032
- Table 13: France Automotive E Tailing Market Revenue (Million) Forecast, by Application 2019 & 2032
- Table 14: Italy Automotive E Tailing Market Revenue (Million) Forecast, by Application 2019 & 2032
- Table 15: Rest of Europe Automotive E Tailing Market Revenue (Million) Forecast, by Application 2019 & 2032
- Table 16: Global Automotive E Tailing Market Revenue Million Forecast, by Country 2019 & 2032
- Table 17: India Automotive E Tailing Market Revenue (Million) Forecast, by Application 2019 & 2032
- Table 18: China Automotive E Tailing Market Revenue (Million) Forecast, by Application 2019 & 2032
- Table 19: Japan Automotive E Tailing Market Revenue (Million) Forecast, by Application 2019 & 2032
- Table 20: South Korea Automotive E Tailing Market Revenue (Million) Forecast, by Application 2019 & 2032
- Table 21: Rest of Asia Pacific Automotive E Tailing Market Revenue (Million) Forecast, by Application 2019 & 2032
- Table 22: Global Automotive E Tailing Market Revenue Million Forecast, by Country 2019 & 2032
- Table 23: South America Automotive E Tailing Market Revenue (Million) Forecast, by Application 2019 & 2032
- Table 24: Middle East and Africa Automotive E Tailing Market Revenue (Million) Forecast, by Application 2019 & 2032
- Table 25: Global Automotive E Tailing Market Revenue Million Forecast, by Component Type 2019 & 2032
- Table 26: Global Automotive E Tailing Market Revenue Million Forecast, by Vehicle Type 2019 & 2032
- Table 27: Global Automotive E Tailing Market Revenue Million Forecast, by Vendor Type 2019 & 2032
- Table 28: Global Automotive E Tailing Market Revenue Million Forecast, by Country 2019 & 2032
- Table 29: United States Automotive E Tailing Market Revenue (Million) Forecast, by Application 2019 & 2032
- Table 30: Canada Automotive E Tailing Market Revenue (Million) Forecast, by Application 2019 & 2032
- Table 31: Rest of North America Automotive E Tailing Market Revenue (Million) Forecast, by Application 2019 & 2032
- Table 32: Global Automotive E Tailing Market Revenue Million Forecast, by Component Type 2019 & 2032
- Table 33: Global Automotive E Tailing Market Revenue Million Forecast, by Vehicle Type 2019 & 2032
- Table 34: Global Automotive E Tailing Market Revenue Million Forecast, by Vendor Type 2019 & 2032
- Table 35: Global Automotive E Tailing Market Revenue Million Forecast, by Country 2019 & 2032
- Table 36: Germany Automotive E Tailing Market Revenue (Million) Forecast, by Application 2019 & 2032
- Table 37: United Kingdom Automotive E Tailing Market Revenue (Million) Forecast, by Application 2019 & 2032
- Table 38: France Automotive E Tailing Market Revenue (Million) Forecast, by Application 2019 & 2032
- Table 39: Italy Automotive E Tailing Market Revenue (Million) Forecast, by Application 2019 & 2032
- Table 40: Rest of Europe Automotive E Tailing Market Revenue (Million) Forecast, by Application 2019 & 2032
- Table 41: Global Automotive E Tailing Market Revenue Million Forecast, by Component Type 2019 & 2032
- Table 42: Global Automotive E Tailing Market Revenue Million Forecast, by Vehicle Type 2019 & 2032
- Table 43: Global Automotive E Tailing Market Revenue Million Forecast, by Vendor Type 2019 & 2032
- Table 44: Global Automotive E Tailing Market Revenue Million Forecast, by Country 2019 & 2032
- Table 45: India Automotive E Tailing Market Revenue (Million) Forecast, by Application 2019 & 2032
- Table 46: China Automotive E Tailing Market Revenue (Million) Forecast, by Application 2019 & 2032
- Table 47: Japan Automotive E Tailing Market Revenue (Million) Forecast, by Application 2019 & 2032
- Table 48: South Korea Automotive E Tailing Market Revenue (Million) Forecast, by Application 2019 & 2032
- Table 49: Rest of Asia Pacific Automotive E Tailing Market Revenue (Million) Forecast, by Application 2019 & 2032
- Table 50: Global Automotive E Tailing Market Revenue Million Forecast, by Component Type 2019 & 2032
- Table 51: Global Automotive E Tailing Market Revenue Million Forecast, by Vehicle Type 2019 & 2032
- Table 52: Global Automotive E Tailing Market Revenue Million Forecast, by Vendor Type 2019 & 2032
- Table 53: Global Automotive E Tailing Market Revenue Million Forecast, by Country 2019 & 2032
- Table 54: South America Automotive E Tailing Market Revenue (Million) Forecast, by Application 2019 & 2032
- Table 55: Middle East and Africa Automotive E Tailing Market Revenue (Million) Forecast, by Application 2019 & 2032
Frequently Asked Questions
1. What is the projected Compound Annual Growth Rate (CAGR) of the Automotive E Tailing Market?
The projected CAGR is approximately 12.00%.
2. Which companies are prominent players in the Automotive E Tailing Market?
Key companies in the market include Alibaba Group Holding Limited, Delticom AG, Advance Auto Parts Inc, Amazon com Inc, Robert Bosch GmbH, AutoZone Inc, Flipkart*List Not Exhaustive, eBay Inc, O'reilly Automotive Inc, Walmart Inc.
3. What are the main segments of the Automotive E Tailing Market?
The market segments include Component Type, Vehicle Type, Vendor Type.
4. Can you provide details about the market size?
The market size is estimated to be USD XX Million as of 2022.
5. What are some drivers contributing to market growth?
Rise in Vehicle Electrification.
6. What are the notable trends driving market growth?
The Infotainment and Multimedia Segment to Hold Major Share in the Market.
7. Are there any restraints impacting market growth?
The Cost of Raw Materials Used in the Manufacturing of Switches is High.
8. Can you provide examples of recent developments in the market?
In February 2021, CarParts.com Partnered with McDowell and Front Row Motorsports (FRM) CarParts.com partnered with Front Row Motorsports (FRM) and McDowell on several contests, sweepstakes, promotions, and other activities to get more involved in the spark engagement and sport.
9. What pricing options are available for accessing the report?
Pricing options include single-user, multi-user, and enterprise licenses priced at USD 4750, USD 5250, and USD 8750 respectively.
10. Is the market size provided in terms of value or volume?
The market size is provided in terms of value, measured in Million.
11. Are there any specific market keywords associated with the report?
Yes, the market keyword associated with the report is "Automotive E Tailing Market," which aids in identifying and referencing the specific market segment covered.
12. How do I determine which pricing option suits my needs best?
The pricing options vary based on user requirements and access needs. Individual users may opt for single-user licenses, while businesses requiring broader access may choose multi-user or enterprise licenses for cost-effective access to the report.
13. Are there any additional resources or data provided in the Automotive E Tailing Market report?
While the report offers comprehensive insights, it's advisable to review the specific contents or supplementary materials provided to ascertain if additional resources or data are available.
14. How can I stay updated on further developments or reports in the Automotive E Tailing Market?
To stay informed about further developments, trends, and reports in the Automotive E Tailing Market, consider subscribing to industry newsletters, following relevant companies and organizations, or regularly checking reputable industry news sources and publications.
Methodology
Step 1 - Identification of Relevant Samples Size from Population Database


Step 2 - Approaches for Defining Global Market Size (Value, Volume* & Price*)

Note*: In applicable scenarios
Step 3 - Data Sources
Primary Research
- Web Analytics
- Survey Reports
- Research Institute
- Latest Research Reports
- Opinion Leaders
Secondary Research
- Annual Reports
- White Paper
- Latest Press Release
- Industry Association
- Paid Database
- Investor Presentations

Step 4 - Data Triangulation
Involves using different sources of information in order to increase the validity of a study
These sources are likely to be stakeholders in a program - participants, other researchers, program staff, other community members, and so on.
Then we put all data in single framework & apply various statistical tools to find out the dynamic on the market.
During the analysis stage, feedback from the stakeholder groups would be compared to determine areas of agreement as well as areas of divergence
