

Key Insights
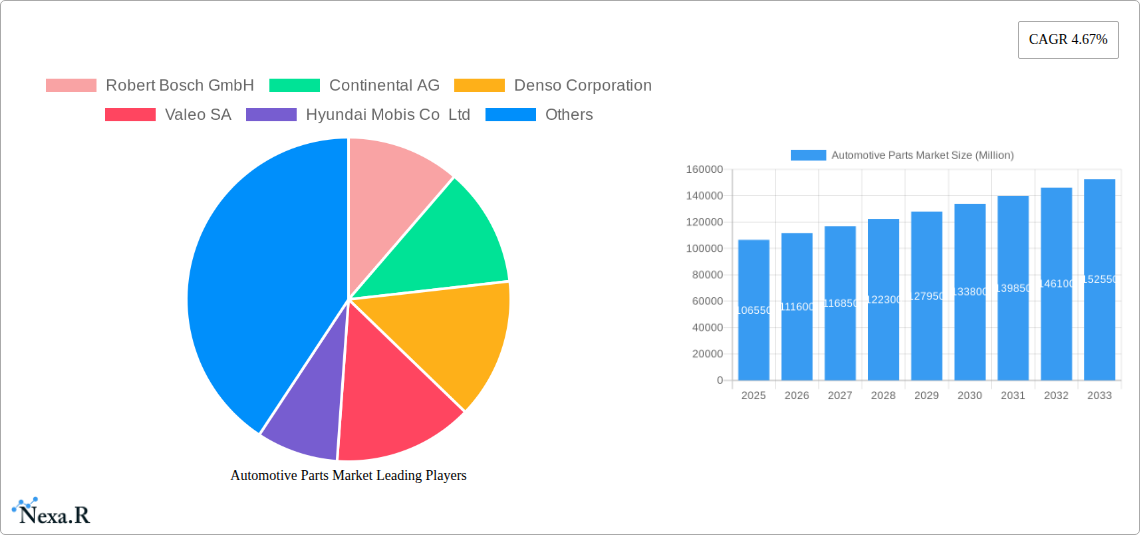
The automotive parts market, valued at $106.55 billion in 2025, is projected to experience robust growth, driven by several key factors. The increasing demand for vehicles globally, particularly in developing economies, fuels significant growth in the replacement and original equipment manufacturer (OEM) segments. Technological advancements, such as the rise of electric vehicles (EVs) and autonomous driving systems, are reshaping the market, necessitating the development of new and sophisticated parts. This shift towards advanced technologies creates opportunities for innovative component manufacturers while simultaneously presenting challenges for traditional suppliers who need to adapt to evolving industry standards. Furthermore, the increasing focus on vehicle safety and fuel efficiency drives demand for advanced safety systems and lightweight components, further propelling market expansion. Stringent government regulations regarding emissions and safety standards also play a significant role, forcing manufacturers to invest in research and development to comply with these regulations. The competitive landscape is characterized by a mix of established global players and smaller specialized companies, leading to intense competition and continuous innovation.
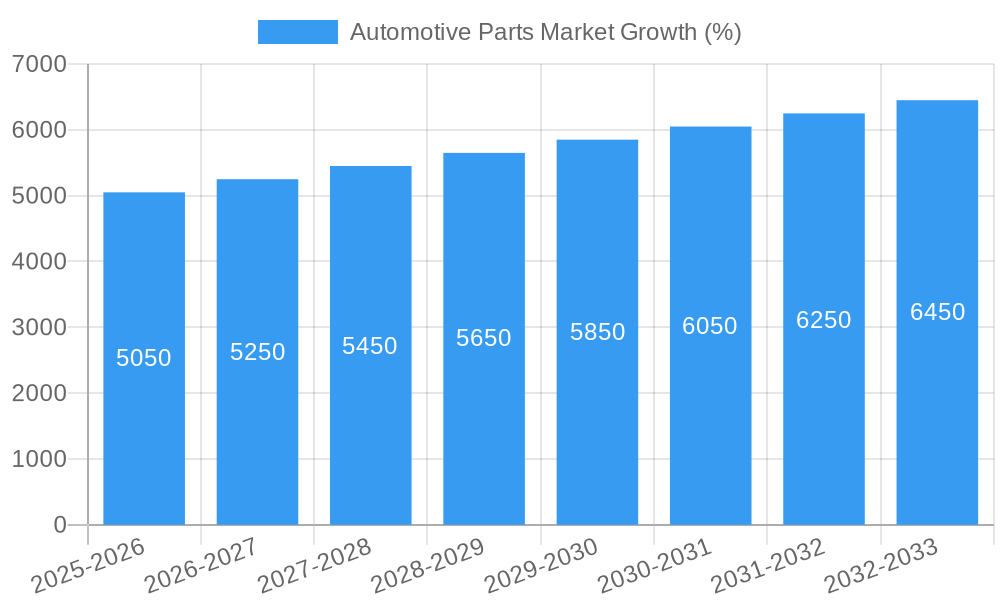
The forecasted Compound Annual Growth Rate (CAGR) of 4.67% from 2025 to 2033 indicates a steady and sustained expansion of the market. This growth trajectory is expected to be influenced by a combination of factors including economic growth in key regions, evolving consumer preferences for technologically advanced vehicles, and continued investment in automotive manufacturing infrastructure. However, potential restraints include economic downturns, fluctuations in raw material prices, and supply chain disruptions, which could impact production and overall market growth. Effective risk management strategies and proactive adaptation to market volatility will be critical for companies operating within this dynamic sector. Geographical variations in market growth are expected, with regions experiencing higher economic growth or stronger adoption of new vehicle technologies demonstrating faster expansion rates.
Automotive Parts Market: A Comprehensive Report (2019-2033)
This in-depth report provides a comprehensive analysis of the Automotive Parts Market, encompassing market dynamics, growth trends, regional dominance, product landscape, key players, and future outlook. The study period covers 2019-2033, with 2025 as the base and estimated year. The report segments the market into various categories, offering granular insights into its evolution and future potential. The total market size is projected to reach xx million units by 2033.
Automotive Parts Market Dynamics & Structure
The Automotive Parts Market is characterized by a moderately concentrated structure, with key players like Robert Bosch GmbH, Continental AG, and Denso Corporation holding significant market share. Technological innovation, particularly in areas like electric vehicles (EVs) and autonomous driving, is a major driver, alongside increasingly stringent regulatory frameworks concerning emissions and safety. The rise of electric vehicles presents both opportunities and challenges, with the need for new components and manufacturing processes. The market also sees competition from substitutes such as 3D-printed parts and alternative materials, though this remains niche.
- Market Concentration: The top 5 players hold approximately xx% of the global market share (2025).
- Technological Innovation: Focus on EV components, ADAS (Advanced Driver-Assistance Systems), and lightweight materials.
- Regulatory Framework: Stringent emission standards and safety regulations are shaping market trends.
- Competitive Substitutes: 3D printing and alternative materials pose a growing, yet limited, threat.
- M&A Trends: A moderate number of mergers and acquisitions, averaging xx deals annually during the historical period (2019-2024), are observed, mainly focused on consolidating technology and expanding geographical reach.
- End-user demographics: Shifting consumer preferences toward SUVs and EVs are impacting component demand.
Automotive Parts Market Growth Trends & Insights
The Automotive Parts Market experienced substantial growth during the historical period (2019-2024), driven by the global increase in vehicle production and the rising demand for advanced features. The market is expected to continue its growth trajectory during the forecast period (2025-2033), albeit at a slightly moderated pace. The adoption of EVs and autonomous driving technologies is a key factor shaping this growth, necessitating the development of new components and systems. Consumer behavior is also shifting towards vehicles with improved safety features and enhanced fuel efficiency, further fueling market demand.
- Market Size Evolution: The market size increased from xx million units in 2019 to xx million units in 2024.
- CAGR (2019-2024): xx%
- Projected CAGR (2025-2033): xx%
- Market Penetration of EVs: xx% in 2024, projected to reach xx% by 2033.
- Technological Disruptions: The shift to EVs is creating significant disruption and opportunities.
Dominant Regions, Countries, or Segments in Automotive Parts Market
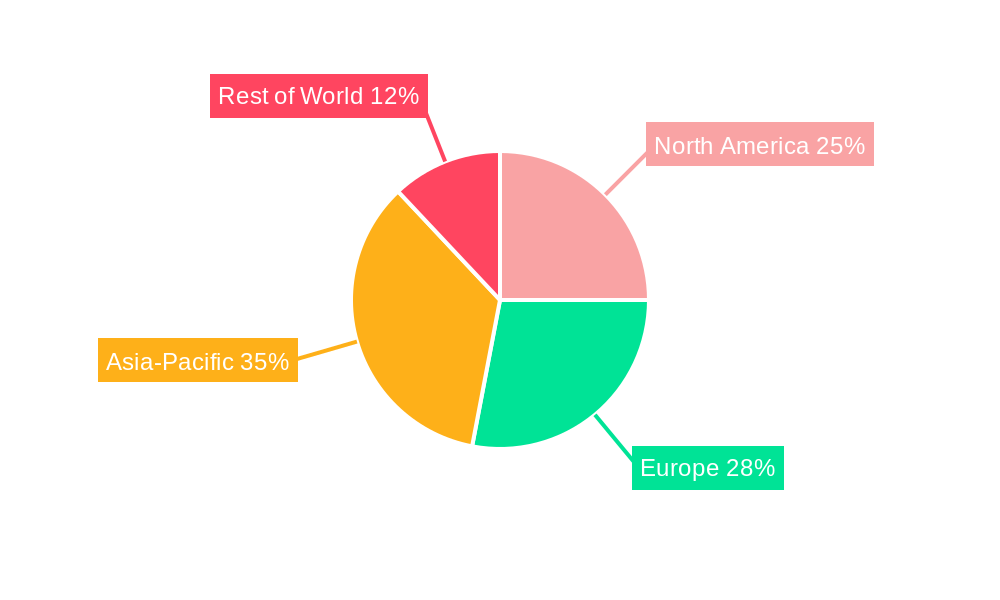
The Asia-Pacific region currently dominates the Automotive Parts Market, driven by robust vehicle production in countries like China, Japan, and India. This dominance is expected to continue, although North America and Europe will also experience significant growth. Within the segments, the increasing demand for EV components and ADAS systems is driving the growth of these specific areas within the market.
- Key Drivers:
- Asia-Pacific: High vehicle production, growing middle class, government support for the automotive industry.
- North America: Strong demand for advanced automotive technologies, large automotive manufacturing base.
- Europe: Focus on sustainable mobility and stringent environmental regulations.
- Dominance Factors: High vehicle production volumes, strong automotive industry presence, and supportive government policies.
- Market Share (2025): Asia-Pacific (xx%), North America (xx%), Europe (xx%).
- Growth Potential: Highest growth potential lies within the EV components segment and emerging markets.
Automotive Parts Market Product Landscape
The automotive parts market offers a wide array of products, including engine components, braking systems, safety systems, electronic components, and body parts. Recent innovations focus on lightweight materials, advanced driver-assistance systems (ADAS), and electric vehicle (EV) components. Key selling propositions include enhanced performance, increased safety, improved fuel efficiency, and reduced emissions. Technological advancements include the integration of artificial intelligence, improved sensor technology, and the adoption of advanced materials like carbon fiber.
Key Drivers, Barriers & Challenges in Automotive Parts Market
Key Drivers: The rising demand for vehicles globally, particularly in developing economies; technological advancements leading to safer and more efficient vehicles; the push towards electrification and automation are driving market expansion. Government regulations promoting fuel efficiency and emission reductions also play a significant role.
Key Challenges: Supply chain disruptions caused by geopolitical events and resource scarcity; intense competition among established players and the emergence of new entrants; fluctuating raw material prices; and stringent regulatory compliance requirements pose considerable challenges to sustained market growth. The impact of these challenges is estimated to reduce the overall market growth by approximately xx% during the forecast period.
Emerging Opportunities in Automotive Parts Market
The market presents significant opportunities in the development and production of EV components, autonomous driving systems, and connected car technologies. Untapped markets in developing countries, the growing adoption of shared mobility services, and the increasing focus on sustainable and eco-friendly materials offer further avenues for growth. The rising demand for personalized and customized automotive parts represents another emerging opportunity.
Growth Accelerators in the Automotive Parts Market Industry
Technological breakthroughs in areas like lightweight materials, advanced sensors, and AI-powered systems are driving long-term growth. Strategic partnerships and collaborations between automotive parts manufacturers and technology companies are also playing a crucial role. Expansions into new markets, particularly in developing economies, and the development of innovative business models focused on services and data analytics are further accelerating growth.
Key Players Shaping the Automotive Parts Market Market
- Robert Bosch GmbH
- Continental AG
- Denso Corporation
- Valeo SA
- Hyundai Mobis Co Ltd
- ZF Friedrichshafen AG
- Magna International Inc
- Faurecia SE
- Lear Corporation
- CATL (Contemporary Amperex Technology Co Ltd)
- Aisin Corporation
- Aptiv Plc
- BorgWarner Inc
- Schaeffler AG
- Cummins Inc
Notable Milestones in Automotive Parts Market Sector
- November 2023: ZF Friedrichshafen AG unveils a groundbreaking electro-mechanical brake system, enhancing efficiency and sustainability.
- January 2024: ZF Friedrichshafen AG introduces a highly advanced Parking Electronic Control Unit (ECU), improving automated parking accessibility.
- April 2024: BorgWarner Inc. invests USD 20.6 million in expanding its electric vehicle product manufacturing facility, boosting EV component production.
In-Depth Automotive Parts Market Market Outlook
The Automotive Parts Market is poised for sustained growth, driven by the continued adoption of EVs and autonomous driving technologies. Strategic opportunities exist for companies focusing on innovation, sustainable practices, and expansion into emerging markets. The market's future success will hinge on the ability of companies to adapt to technological disruptions, address supply chain challenges, and comply with evolving regulations. The market is expected to witness continued consolidation, with strategic mergers and acquisitions playing a crucial role in shaping the industry landscape.
Automotive Parts Market Segmentation
-
1. Type
- 1.1. Driveline and Powertrain
- 1.2. Interior and Exterior
- 1.3. Electrical and Electronics
- 1.4. Body and Chassis
- 1.5. Wheel and Tires
- 1.6. Other types
-
2. Propulsion
- 2.1. Internal Combustion Engine
- 2.2. Battery Electric Vehicles
- 2.3. Hybrid Electric Vehicles
- 2.4. Plug-in Hybrid Electric Vehicles
- 2.5. Fuel Cell Electric Vehicles
-
3. Vehicle Type
- 3.1. Passenger Car
- 3.2. Commercial Vehicles
-
4. Sales Channel
- 4.1. Original Equipment Manufacturers (OEM)
- 4.2. Aftermarket
Automotive Parts Market Segmentation By Geography
-
1. North America
- 1.1. United States
- 1.2. Canada
- 1.3. Rest of North America
-
2. Europe
- 2.1. Germany
- 2.2. United Kingdom
- 2.3. France
- 2.4. Italy
- 2.5. Spain
- 2.6. Rest of Europe
-
3. Asia Pacific
- 3.1. China
- 3.2. India
- 3.3. Japan
- 3.4. South Korea
- 3.5. Rest of Asia Pacific
-
4. Rest of the World
- 4.1. South America
- 4.2. Middle East and Africa
Automotive Parts Market REPORT HIGHLIGHTS
| Aspects | Details |
|---|---|
| Study Period | 2019-2033 |
| Base Year | 2024 |
| Estimated Year | 2025 |
| Forecast Period | 2025-2033 |
| Historical Period | 2019-2024 |
| Growth Rate | CAGR of 4.67% from 2019-2033 |
| Segmentation |
|
Table of Contents
- 1. Introduction
- 1.1. Research Scope
- 1.2. Market Segmentation
- 1.3. Research Methodology
- 1.4. Definitions and Assumptions
- 2. Executive Summary
- 2.1. Introduction
- 3. Market Dynamics
- 3.1. Introduction
- 3.2. Market Drivers
- 3.2.1. Rise in Vehicle Production Across the Globe
- 3.3. Market Restrains
- 3.3.1. Rise in Vehicle Production Across the Globe
- 3.4. Market Trends
- 3.4.1. Battery Electric Vehicles are Witnessing Major Growth
- 4. Market Factor Analysis
- 4.1. Porters Five Forces
- 4.2. Supply/Value Chain
- 4.3. PESTEL analysis
- 4.4. Market Entropy
- 4.5. Patent/Trademark Analysis
- 5. Global Automotive Parts Market Analysis, Insights and Forecast, 2019-2031
- 5.1. Market Analysis, Insights and Forecast - by Type
- 5.1.1. Driveline and Powertrain
- 5.1.2. Interior and Exterior
- 5.1.3. Electrical and Electronics
- 5.1.4. Body and Chassis
- 5.1.5. Wheel and Tires
- 5.1.6. Other types
- 5.2. Market Analysis, Insights and Forecast - by Propulsion
- 5.2.1. Internal Combustion Engine
- 5.2.2. Battery Electric Vehicles
- 5.2.3. Hybrid Electric Vehicles
- 5.2.4. Plug-in Hybrid Electric Vehicles
- 5.2.5. Fuel Cell Electric Vehicles
- 5.3. Market Analysis, Insights and Forecast - by Vehicle Type
- 5.3.1. Passenger Car
- 5.3.2. Commercial Vehicles
- 5.4. Market Analysis, Insights and Forecast - by Sales Channel
- 5.4.1. Original Equipment Manufacturers (OEM)
- 5.4.2. Aftermarket
- 5.5. Market Analysis, Insights and Forecast - by Region
- 5.5.1. North America
- 5.5.2. Europe
- 5.5.3. Asia Pacific
- 5.5.4. Rest of the World
- 5.1. Market Analysis, Insights and Forecast - by Type
- 6. North America Automotive Parts Market Analysis, Insights and Forecast, 2019-2031
- 6.1. Market Analysis, Insights and Forecast - by Type
- 6.1.1. Driveline and Powertrain
- 6.1.2. Interior and Exterior
- 6.1.3. Electrical and Electronics
- 6.1.4. Body and Chassis
- 6.1.5. Wheel and Tires
- 6.1.6. Other types
- 6.2. Market Analysis, Insights and Forecast - by Propulsion
- 6.2.1. Internal Combustion Engine
- 6.2.2. Battery Electric Vehicles
- 6.2.3. Hybrid Electric Vehicles
- 6.2.4. Plug-in Hybrid Electric Vehicles
- 6.2.5. Fuel Cell Electric Vehicles
- 6.3. Market Analysis, Insights and Forecast - by Vehicle Type
- 6.3.1. Passenger Car
- 6.3.2. Commercial Vehicles
- 6.4. Market Analysis, Insights and Forecast - by Sales Channel
- 6.4.1. Original Equipment Manufacturers (OEM)
- 6.4.2. Aftermarket
- 6.1. Market Analysis, Insights and Forecast - by Type
- 7. Europe Automotive Parts Market Analysis, Insights and Forecast, 2019-2031
- 7.1. Market Analysis, Insights and Forecast - by Type
- 7.1.1. Driveline and Powertrain
- 7.1.2. Interior and Exterior
- 7.1.3. Electrical and Electronics
- 7.1.4. Body and Chassis
- 7.1.5. Wheel and Tires
- 7.1.6. Other types
- 7.2. Market Analysis, Insights and Forecast - by Propulsion
- 7.2.1. Internal Combustion Engine
- 7.2.2. Battery Electric Vehicles
- 7.2.3. Hybrid Electric Vehicles
- 7.2.4. Plug-in Hybrid Electric Vehicles
- 7.2.5. Fuel Cell Electric Vehicles
- 7.3. Market Analysis, Insights and Forecast - by Vehicle Type
- 7.3.1. Passenger Car
- 7.3.2. Commercial Vehicles
- 7.4. Market Analysis, Insights and Forecast - by Sales Channel
- 7.4.1. Original Equipment Manufacturers (OEM)
- 7.4.2. Aftermarket
- 7.1. Market Analysis, Insights and Forecast - by Type
- 8. Asia Pacific Automotive Parts Market Analysis, Insights and Forecast, 2019-2031
- 8.1. Market Analysis, Insights and Forecast - by Type
- 8.1.1. Driveline and Powertrain
- 8.1.2. Interior and Exterior
- 8.1.3. Electrical and Electronics
- 8.1.4. Body and Chassis
- 8.1.5. Wheel and Tires
- 8.1.6. Other types
- 8.2. Market Analysis, Insights and Forecast - by Propulsion
- 8.2.1. Internal Combustion Engine
- 8.2.2. Battery Electric Vehicles
- 8.2.3. Hybrid Electric Vehicles
- 8.2.4. Plug-in Hybrid Electric Vehicles
- 8.2.5. Fuel Cell Electric Vehicles
- 8.3. Market Analysis, Insights and Forecast - by Vehicle Type
- 8.3.1. Passenger Car
- 8.3.2. Commercial Vehicles
- 8.4. Market Analysis, Insights and Forecast - by Sales Channel
- 8.4.1. Original Equipment Manufacturers (OEM)
- 8.4.2. Aftermarket
- 8.1. Market Analysis, Insights and Forecast - by Type
- 9. Rest of the World Automotive Parts Market Analysis, Insights and Forecast, 2019-2031
- 9.1. Market Analysis, Insights and Forecast - by Type
- 9.1.1. Driveline and Powertrain
- 9.1.2. Interior and Exterior
- 9.1.3. Electrical and Electronics
- 9.1.4. Body and Chassis
- 9.1.5. Wheel and Tires
- 9.1.6. Other types
- 9.2. Market Analysis, Insights and Forecast - by Propulsion
- 9.2.1. Internal Combustion Engine
- 9.2.2. Battery Electric Vehicles
- 9.2.3. Hybrid Electric Vehicles
- 9.2.4. Plug-in Hybrid Electric Vehicles
- 9.2.5. Fuel Cell Electric Vehicles
- 9.3. Market Analysis, Insights and Forecast - by Vehicle Type
- 9.3.1. Passenger Car
- 9.3.2. Commercial Vehicles
- 9.4. Market Analysis, Insights and Forecast - by Sales Channel
- 9.4.1. Original Equipment Manufacturers (OEM)
- 9.4.2. Aftermarket
- 9.1. Market Analysis, Insights and Forecast - by Type
- 10. Competitive Analysis
- 10.1. Global Market Share Analysis 2024
- 10.2. Company Profiles
- 10.2.1 Robert Bosch GmbH
- 10.2.1.1. Overview
- 10.2.1.2. Products
- 10.2.1.3. SWOT Analysis
- 10.2.1.4. Recent Developments
- 10.2.1.5. Financials (Based on Availability)
- 10.2.2 Continental AG
- 10.2.2.1. Overview
- 10.2.2.2. Products
- 10.2.2.3. SWOT Analysis
- 10.2.2.4. Recent Developments
- 10.2.2.5. Financials (Based on Availability)
- 10.2.3 Denso Corporation
- 10.2.3.1. Overview
- 10.2.3.2. Products
- 10.2.3.3. SWOT Analysis
- 10.2.3.4. Recent Developments
- 10.2.3.5. Financials (Based on Availability)
- 10.2.4 Valeo SA
- 10.2.4.1. Overview
- 10.2.4.2. Products
- 10.2.4.3. SWOT Analysis
- 10.2.4.4. Recent Developments
- 10.2.4.5. Financials (Based on Availability)
- 10.2.5 Hyundai Mobis Co Ltd
- 10.2.5.1. Overview
- 10.2.5.2. Products
- 10.2.5.3. SWOT Analysis
- 10.2.5.4. Recent Developments
- 10.2.5.5. Financials (Based on Availability)
- 10.2.6 ZF Friedrichshafen AG
- 10.2.6.1. Overview
- 10.2.6.2. Products
- 10.2.6.3. SWOT Analysis
- 10.2.6.4. Recent Developments
- 10.2.6.5. Financials (Based on Availability)
- 10.2.7 Magna International Inc
- 10.2.7.1. Overview
- 10.2.7.2. Products
- 10.2.7.3. SWOT Analysis
- 10.2.7.4. Recent Developments
- 10.2.7.5. Financials (Based on Availability)
- 10.2.8 Faurecia SE
- 10.2.8.1. Overview
- 10.2.8.2. Products
- 10.2.8.3. SWOT Analysis
- 10.2.8.4. Recent Developments
- 10.2.8.5. Financials (Based on Availability)
- 10.2.9 Lear Corporation
- 10.2.9.1. Overview
- 10.2.9.2. Products
- 10.2.9.3. SWOT Analysis
- 10.2.9.4. Recent Developments
- 10.2.9.5. Financials (Based on Availability)
- 10.2.10 CATL (Contemporary Amperex Technology Co Ltd)
- 10.2.10.1. Overview
- 10.2.10.2. Products
- 10.2.10.3. SWOT Analysis
- 10.2.10.4. Recent Developments
- 10.2.10.5. Financials (Based on Availability)
- 10.2.11 Aisin Corporation
- 10.2.11.1. Overview
- 10.2.11.2. Products
- 10.2.11.3. SWOT Analysis
- 10.2.11.4. Recent Developments
- 10.2.11.5. Financials (Based on Availability)
- 10.2.12 Aptiv Plc
- 10.2.12.1. Overview
- 10.2.12.2. Products
- 10.2.12.3. SWOT Analysis
- 10.2.12.4. Recent Developments
- 10.2.12.5. Financials (Based on Availability)
- 10.2.13 BorgWarner Inc
- 10.2.13.1. Overview
- 10.2.13.2. Products
- 10.2.13.3. SWOT Analysis
- 10.2.13.4. Recent Developments
- 10.2.13.5. Financials (Based on Availability)
- 10.2.14 Schaeffler AG
- 10.2.14.1. Overview
- 10.2.14.2. Products
- 10.2.14.3. SWOT Analysis
- 10.2.14.4. Recent Developments
- 10.2.14.5. Financials (Based on Availability)
- 10.2.15 Cummins Inc
- 10.2.15.1. Overview
- 10.2.15.2. Products
- 10.2.15.3. SWOT Analysis
- 10.2.15.4. Recent Developments
- 10.2.15.5. Financials (Based on Availability)
- 10.2.1 Robert Bosch GmbH
List of Figures
- Figure 1: Global Automotive Parts Market Revenue Breakdown (Million, %) by Region 2024 & 2032
- Figure 2: Global Automotive Parts Market Volume Breakdown (Billion, %) by Region 2024 & 2032
- Figure 3: North America Automotive Parts Market Revenue (Million), by Type 2024 & 2032
- Figure 4: North America Automotive Parts Market Volume (Billion), by Type 2024 & 2032
- Figure 5: North America Automotive Parts Market Revenue Share (%), by Type 2024 & 2032
- Figure 6: North America Automotive Parts Market Volume Share (%), by Type 2024 & 2032
- Figure 7: North America Automotive Parts Market Revenue (Million), by Propulsion 2024 & 2032
- Figure 8: North America Automotive Parts Market Volume (Billion), by Propulsion 2024 & 2032
- Figure 9: North America Automotive Parts Market Revenue Share (%), by Propulsion 2024 & 2032
- Figure 10: North America Automotive Parts Market Volume Share (%), by Propulsion 2024 & 2032
- Figure 11: North America Automotive Parts Market Revenue (Million), by Vehicle Type 2024 & 2032
- Figure 12: North America Automotive Parts Market Volume (Billion), by Vehicle Type 2024 & 2032
- Figure 13: North America Automotive Parts Market Revenue Share (%), by Vehicle Type 2024 & 2032
- Figure 14: North America Automotive Parts Market Volume Share (%), by Vehicle Type 2024 & 2032
- Figure 15: North America Automotive Parts Market Revenue (Million), by Sales Channel 2024 & 2032
- Figure 16: North America Automotive Parts Market Volume (Billion), by Sales Channel 2024 & 2032
- Figure 17: North America Automotive Parts Market Revenue Share (%), by Sales Channel 2024 & 2032
- Figure 18: North America Automotive Parts Market Volume Share (%), by Sales Channel 2024 & 2032
- Figure 19: North America Automotive Parts Market Revenue (Million), by Country 2024 & 2032
- Figure 20: North America Automotive Parts Market Volume (Billion), by Country 2024 & 2032
- Figure 21: North America Automotive Parts Market Revenue Share (%), by Country 2024 & 2032
- Figure 22: North America Automotive Parts Market Volume Share (%), by Country 2024 & 2032
- Figure 23: Europe Automotive Parts Market Revenue (Million), by Type 2024 & 2032
- Figure 24: Europe Automotive Parts Market Volume (Billion), by Type 2024 & 2032
- Figure 25: Europe Automotive Parts Market Revenue Share (%), by Type 2024 & 2032
- Figure 26: Europe Automotive Parts Market Volume Share (%), by Type 2024 & 2032
- Figure 27: Europe Automotive Parts Market Revenue (Million), by Propulsion 2024 & 2032
- Figure 28: Europe Automotive Parts Market Volume (Billion), by Propulsion 2024 & 2032
- Figure 29: Europe Automotive Parts Market Revenue Share (%), by Propulsion 2024 & 2032
- Figure 30: Europe Automotive Parts Market Volume Share (%), by Propulsion 2024 & 2032
- Figure 31: Europe Automotive Parts Market Revenue (Million), by Vehicle Type 2024 & 2032
- Figure 32: Europe Automotive Parts Market Volume (Billion), by Vehicle Type 2024 & 2032
- Figure 33: Europe Automotive Parts Market Revenue Share (%), by Vehicle Type 2024 & 2032
- Figure 34: Europe Automotive Parts Market Volume Share (%), by Vehicle Type 2024 & 2032
- Figure 35: Europe Automotive Parts Market Revenue (Million), by Sales Channel 2024 & 2032
- Figure 36: Europe Automotive Parts Market Volume (Billion), by Sales Channel 2024 & 2032
- Figure 37: Europe Automotive Parts Market Revenue Share (%), by Sales Channel 2024 & 2032
- Figure 38: Europe Automotive Parts Market Volume Share (%), by Sales Channel 2024 & 2032
- Figure 39: Europe Automotive Parts Market Revenue (Million), by Country 2024 & 2032
- Figure 40: Europe Automotive Parts Market Volume (Billion), by Country 2024 & 2032
- Figure 41: Europe Automotive Parts Market Revenue Share (%), by Country 2024 & 2032
- Figure 42: Europe Automotive Parts Market Volume Share (%), by Country 2024 & 2032
- Figure 43: Asia Pacific Automotive Parts Market Revenue (Million), by Type 2024 & 2032
- Figure 44: Asia Pacific Automotive Parts Market Volume (Billion), by Type 2024 & 2032
- Figure 45: Asia Pacific Automotive Parts Market Revenue Share (%), by Type 2024 & 2032
- Figure 46: Asia Pacific Automotive Parts Market Volume Share (%), by Type 2024 & 2032
- Figure 47: Asia Pacific Automotive Parts Market Revenue (Million), by Propulsion 2024 & 2032
- Figure 48: Asia Pacific Automotive Parts Market Volume (Billion), by Propulsion 2024 & 2032
- Figure 49: Asia Pacific Automotive Parts Market Revenue Share (%), by Propulsion 2024 & 2032
- Figure 50: Asia Pacific Automotive Parts Market Volume Share (%), by Propulsion 2024 & 2032
- Figure 51: Asia Pacific Automotive Parts Market Revenue (Million), by Vehicle Type 2024 & 2032
- Figure 52: Asia Pacific Automotive Parts Market Volume (Billion), by Vehicle Type 2024 & 2032
- Figure 53: Asia Pacific Automotive Parts Market Revenue Share (%), by Vehicle Type 2024 & 2032
- Figure 54: Asia Pacific Automotive Parts Market Volume Share (%), by Vehicle Type 2024 & 2032
- Figure 55: Asia Pacific Automotive Parts Market Revenue (Million), by Sales Channel 2024 & 2032
- Figure 56: Asia Pacific Automotive Parts Market Volume (Billion), by Sales Channel 2024 & 2032
- Figure 57: Asia Pacific Automotive Parts Market Revenue Share (%), by Sales Channel 2024 & 2032
- Figure 58: Asia Pacific Automotive Parts Market Volume Share (%), by Sales Channel 2024 & 2032
- Figure 59: Asia Pacific Automotive Parts Market Revenue (Million), by Country 2024 & 2032
- Figure 60: Asia Pacific Automotive Parts Market Volume (Billion), by Country 2024 & 2032
- Figure 61: Asia Pacific Automotive Parts Market Revenue Share (%), by Country 2024 & 2032
- Figure 62: Asia Pacific Automotive Parts Market Volume Share (%), by Country 2024 & 2032
- Figure 63: Rest of the World Automotive Parts Market Revenue (Million), by Type 2024 & 2032
- Figure 64: Rest of the World Automotive Parts Market Volume (Billion), by Type 2024 & 2032
- Figure 65: Rest of the World Automotive Parts Market Revenue Share (%), by Type 2024 & 2032
- Figure 66: Rest of the World Automotive Parts Market Volume Share (%), by Type 2024 & 2032
- Figure 67: Rest of the World Automotive Parts Market Revenue (Million), by Propulsion 2024 & 2032
- Figure 68: Rest of the World Automotive Parts Market Volume (Billion), by Propulsion 2024 & 2032
- Figure 69: Rest of the World Automotive Parts Market Revenue Share (%), by Propulsion 2024 & 2032
- Figure 70: Rest of the World Automotive Parts Market Volume Share (%), by Propulsion 2024 & 2032
- Figure 71: Rest of the World Automotive Parts Market Revenue (Million), by Vehicle Type 2024 & 2032
- Figure 72: Rest of the World Automotive Parts Market Volume (Billion), by Vehicle Type 2024 & 2032
- Figure 73: Rest of the World Automotive Parts Market Revenue Share (%), by Vehicle Type 2024 & 2032
- Figure 74: Rest of the World Automotive Parts Market Volume Share (%), by Vehicle Type 2024 & 2032
- Figure 75: Rest of the World Automotive Parts Market Revenue (Million), by Sales Channel 2024 & 2032
- Figure 76: Rest of the World Automotive Parts Market Volume (Billion), by Sales Channel 2024 & 2032
- Figure 77: Rest of the World Automotive Parts Market Revenue Share (%), by Sales Channel 2024 & 2032
- Figure 78: Rest of the World Automotive Parts Market Volume Share (%), by Sales Channel 2024 & 2032
- Figure 79: Rest of the World Automotive Parts Market Revenue (Million), by Country 2024 & 2032
- Figure 80: Rest of the World Automotive Parts Market Volume (Billion), by Country 2024 & 2032
- Figure 81: Rest of the World Automotive Parts Market Revenue Share (%), by Country 2024 & 2032
- Figure 82: Rest of the World Automotive Parts Market Volume Share (%), by Country 2024 & 2032
List of Tables
- Table 1: Global Automotive Parts Market Revenue Million Forecast, by Region 2019 & 2032
- Table 2: Global Automotive Parts Market Volume Billion Forecast, by Region 2019 & 2032
- Table 3: Global Automotive Parts Market Revenue Million Forecast, by Type 2019 & 2032
- Table 4: Global Automotive Parts Market Volume Billion Forecast, by Type 2019 & 2032
- Table 5: Global Automotive Parts Market Revenue Million Forecast, by Propulsion 2019 & 2032
- Table 6: Global Automotive Parts Market Volume Billion Forecast, by Propulsion 2019 & 2032
- Table 7: Global Automotive Parts Market Revenue Million Forecast, by Vehicle Type 2019 & 2032
- Table 8: Global Automotive Parts Market Volume Billion Forecast, by Vehicle Type 2019 & 2032
- Table 9: Global Automotive Parts Market Revenue Million Forecast, by Sales Channel 2019 & 2032
- Table 10: Global Automotive Parts Market Volume Billion Forecast, by Sales Channel 2019 & 2032
- Table 11: Global Automotive Parts Market Revenue Million Forecast, by Region 2019 & 2032
- Table 12: Global Automotive Parts Market Volume Billion Forecast, by Region 2019 & 2032
- Table 13: Global Automotive Parts Market Revenue Million Forecast, by Type 2019 & 2032
- Table 14: Global Automotive Parts Market Volume Billion Forecast, by Type 2019 & 2032
- Table 15: Global Automotive Parts Market Revenue Million Forecast, by Propulsion 2019 & 2032
- Table 16: Global Automotive Parts Market Volume Billion Forecast, by Propulsion 2019 & 2032
- Table 17: Global Automotive Parts Market Revenue Million Forecast, by Vehicle Type 2019 & 2032
- Table 18: Global Automotive Parts Market Volume Billion Forecast, by Vehicle Type 2019 & 2032
- Table 19: Global Automotive Parts Market Revenue Million Forecast, by Sales Channel 2019 & 2032
- Table 20: Global Automotive Parts Market Volume Billion Forecast, by Sales Channel 2019 & 2032
- Table 21: Global Automotive Parts Market Revenue Million Forecast, by Country 2019 & 2032
- Table 22: Global Automotive Parts Market Volume Billion Forecast, by Country 2019 & 2032
- Table 23: United States Automotive Parts Market Revenue (Million) Forecast, by Application 2019 & 2032
- Table 24: United States Automotive Parts Market Volume (Billion) Forecast, by Application 2019 & 2032
- Table 25: Canada Automotive Parts Market Revenue (Million) Forecast, by Application 2019 & 2032
- Table 26: Canada Automotive Parts Market Volume (Billion) Forecast, by Application 2019 & 2032
- Table 27: Rest of North America Automotive Parts Market Revenue (Million) Forecast, by Application 2019 & 2032
- Table 28: Rest of North America Automotive Parts Market Volume (Billion) Forecast, by Application 2019 & 2032
- Table 29: Global Automotive Parts Market Revenue Million Forecast, by Type 2019 & 2032
- Table 30: Global Automotive Parts Market Volume Billion Forecast, by Type 2019 & 2032
- Table 31: Global Automotive Parts Market Revenue Million Forecast, by Propulsion 2019 & 2032
- Table 32: Global Automotive Parts Market Volume Billion Forecast, by Propulsion 2019 & 2032
- Table 33: Global Automotive Parts Market Revenue Million Forecast, by Vehicle Type 2019 & 2032
- Table 34: Global Automotive Parts Market Volume Billion Forecast, by Vehicle Type 2019 & 2032
- Table 35: Global Automotive Parts Market Revenue Million Forecast, by Sales Channel 2019 & 2032
- Table 36: Global Automotive Parts Market Volume Billion Forecast, by Sales Channel 2019 & 2032
- Table 37: Global Automotive Parts Market Revenue Million Forecast, by Country 2019 & 2032
- Table 38: Global Automotive Parts Market Volume Billion Forecast, by Country 2019 & 2032
- Table 39: Germany Automotive Parts Market Revenue (Million) Forecast, by Application 2019 & 2032
- Table 40: Germany Automotive Parts Market Volume (Billion) Forecast, by Application 2019 & 2032
- Table 41: United Kingdom Automotive Parts Market Revenue (Million) Forecast, by Application 2019 & 2032
- Table 42: United Kingdom Automotive Parts Market Volume (Billion) Forecast, by Application 2019 & 2032
- Table 43: France Automotive Parts Market Revenue (Million) Forecast, by Application 2019 & 2032
- Table 44: France Automotive Parts Market Volume (Billion) Forecast, by Application 2019 & 2032
- Table 45: Italy Automotive Parts Market Revenue (Million) Forecast, by Application 2019 & 2032
- Table 46: Italy Automotive Parts Market Volume (Billion) Forecast, by Application 2019 & 2032
- Table 47: Spain Automotive Parts Market Revenue (Million) Forecast, by Application 2019 & 2032
- Table 48: Spain Automotive Parts Market Volume (Billion) Forecast, by Application 2019 & 2032
- Table 49: Rest of Europe Automotive Parts Market Revenue (Million) Forecast, by Application 2019 & 2032
- Table 50: Rest of Europe Automotive Parts Market Volume (Billion) Forecast, by Application 2019 & 2032
- Table 51: Global Automotive Parts Market Revenue Million Forecast, by Type 2019 & 2032
- Table 52: Global Automotive Parts Market Volume Billion Forecast, by Type 2019 & 2032
- Table 53: Global Automotive Parts Market Revenue Million Forecast, by Propulsion 2019 & 2032
- Table 54: Global Automotive Parts Market Volume Billion Forecast, by Propulsion 2019 & 2032
- Table 55: Global Automotive Parts Market Revenue Million Forecast, by Vehicle Type 2019 & 2032
- Table 56: Global Automotive Parts Market Volume Billion Forecast, by Vehicle Type 2019 & 2032
- Table 57: Global Automotive Parts Market Revenue Million Forecast, by Sales Channel 2019 & 2032
- Table 58: Global Automotive Parts Market Volume Billion Forecast, by Sales Channel 2019 & 2032
- Table 59: Global Automotive Parts Market Revenue Million Forecast, by Country 2019 & 2032
- Table 60: Global Automotive Parts Market Volume Billion Forecast, by Country 2019 & 2032
- Table 61: China Automotive Parts Market Revenue (Million) Forecast, by Application 2019 & 2032
- Table 62: China Automotive Parts Market Volume (Billion) Forecast, by Application 2019 & 2032
- Table 63: India Automotive Parts Market Revenue (Million) Forecast, by Application 2019 & 2032
- Table 64: India Automotive Parts Market Volume (Billion) Forecast, by Application 2019 & 2032
- Table 65: Japan Automotive Parts Market Revenue (Million) Forecast, by Application 2019 & 2032
- Table 66: Japan Automotive Parts Market Volume (Billion) Forecast, by Application 2019 & 2032
- Table 67: South Korea Automotive Parts Market Revenue (Million) Forecast, by Application 2019 & 2032
- Table 68: South Korea Automotive Parts Market Volume (Billion) Forecast, by Application 2019 & 2032
- Table 69: Rest of Asia Pacific Automotive Parts Market Revenue (Million) Forecast, by Application 2019 & 2032
- Table 70: Rest of Asia Pacific Automotive Parts Market Volume (Billion) Forecast, by Application 2019 & 2032
- Table 71: Global Automotive Parts Market Revenue Million Forecast, by Type 2019 & 2032
- Table 72: Global Automotive Parts Market Volume Billion Forecast, by Type 2019 & 2032
- Table 73: Global Automotive Parts Market Revenue Million Forecast, by Propulsion 2019 & 2032
- Table 74: Global Automotive Parts Market Volume Billion Forecast, by Propulsion 2019 & 2032
- Table 75: Global Automotive Parts Market Revenue Million Forecast, by Vehicle Type 2019 & 2032
- Table 76: Global Automotive Parts Market Volume Billion Forecast, by Vehicle Type 2019 & 2032
- Table 77: Global Automotive Parts Market Revenue Million Forecast, by Sales Channel 2019 & 2032
- Table 78: Global Automotive Parts Market Volume Billion Forecast, by Sales Channel 2019 & 2032
- Table 79: Global Automotive Parts Market Revenue Million Forecast, by Country 2019 & 2032
- Table 80: Global Automotive Parts Market Volume Billion Forecast, by Country 2019 & 2032
- Table 81: South America Automotive Parts Market Revenue (Million) Forecast, by Application 2019 & 2032
- Table 82: South America Automotive Parts Market Volume (Billion) Forecast, by Application 2019 & 2032
- Table 83: Middle East and Africa Automotive Parts Market Revenue (Million) Forecast, by Application 2019 & 2032
- Table 84: Middle East and Africa Automotive Parts Market Volume (Billion) Forecast, by Application 2019 & 2032
Frequently Asked Questions
1. What is the projected Compound Annual Growth Rate (CAGR) of the Automotive Parts Market?
The projected CAGR is approximately 4.67%.
2. Which companies are prominent players in the Automotive Parts Market?
Key companies in the market include Robert Bosch GmbH, Continental AG, Denso Corporation, Valeo SA, Hyundai Mobis Co Ltd, ZF Friedrichshafen AG, Magna International Inc, Faurecia SE, Lear Corporation, CATL (Contemporary Amperex Technology Co Ltd), Aisin Corporation, Aptiv Plc, BorgWarner Inc, Schaeffler AG, Cummins Inc.
3. What are the main segments of the Automotive Parts Market?
The market segments include Type, Propulsion, Vehicle Type, Sales Channel.
4. Can you provide details about the market size?
The market size is estimated to be USD 106.55 Million as of 2022.
5. What are some drivers contributing to market growth?
Rise in Vehicle Production Across the Globe.
6. What are the notable trends driving market growth?
Battery Electric Vehicles are Witnessing Major Growth.
7. Are there any restraints impacting market growth?
Rise in Vehicle Production Across the Globe.
8. Can you provide examples of recent developments in the market?
April 2024: BorgWarner Inc. invested USD 20.6 million for the expansion of an electric vehicle product manufacturing facility in the United States. With this investment, the company has expanded its development and testing of EV products, including battery modules, battery packs, and DC fast chargers. It has also scaled up its manufacturing operations for DC fast chargers.
9. What pricing options are available for accessing the report?
Pricing options include single-user, multi-user, and enterprise licenses priced at USD 4750, USD 5250, and USD 8750 respectively.
10. Is the market size provided in terms of value or volume?
The market size is provided in terms of value, measured in Million and volume, measured in Billion.
11. Are there any specific market keywords associated with the report?
Yes, the market keyword associated with the report is "Automotive Parts Market," which aids in identifying and referencing the specific market segment covered.
12. How do I determine which pricing option suits my needs best?
The pricing options vary based on user requirements and access needs. Individual users may opt for single-user licenses, while businesses requiring broader access may choose multi-user or enterprise licenses for cost-effective access to the report.
13. Are there any additional resources or data provided in the Automotive Parts Market report?
While the report offers comprehensive insights, it's advisable to review the specific contents or supplementary materials provided to ascertain if additional resources or data are available.
14. How can I stay updated on further developments or reports in the Automotive Parts Market?
To stay informed about further developments, trends, and reports in the Automotive Parts Market, consider subscribing to industry newsletters, following relevant companies and organizations, or regularly checking reputable industry news sources and publications.
Methodology
Step 1 - Identification of Relevant Samples Size from Population Database


Step 2 - Approaches for Defining Global Market Size (Value, Volume* & Price*)

Note*: In applicable scenarios
Step 3 - Data Sources
Primary Research
- Web Analytics
- Survey Reports
- Research Institute
- Latest Research Reports
- Opinion Leaders
Secondary Research
- Annual Reports
- White Paper
- Latest Press Release
- Industry Association
- Paid Database
- Investor Presentations

Step 4 - Data Triangulation
Involves using different sources of information in order to increase the validity of a study
These sources are likely to be stakeholders in a program - participants, other researchers, program staff, other community members, and so on.
Then we put all data in single framework & apply various statistical tools to find out the dynamic on the market.
During the analysis stage, feedback from the stakeholder groups would be compared to determine areas of agreement as well as areas of divergence
