

Key Insights
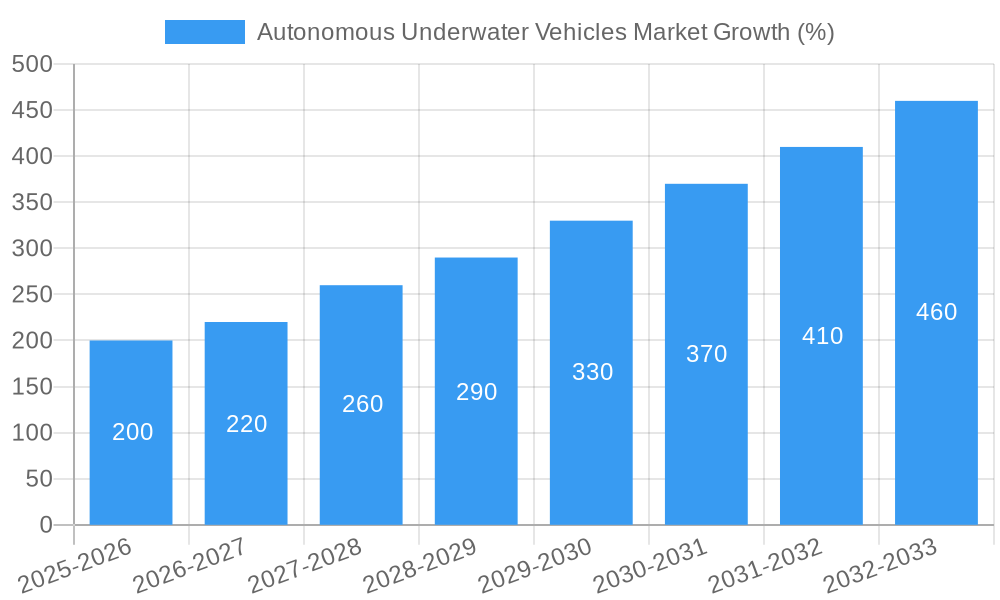
The Autonomous Underwater Vehicles (AUV) market is experiencing robust growth, projected to reach a substantial size driven by increasing demand across diverse sectors. The market's Compound Annual Growth Rate (CAGR) of 13.05% from 2019 to 2033 reflects a significant expansion, fueled primarily by advancements in sensor technology, improved navigation systems, and the growing need for efficient underwater exploration and surveillance. Key application areas like oceanography research, military operations (including mine countermeasures and anti-submarine warfare), and civil infrastructure inspection contribute significantly to this growth. The adoption of AUVs is further propelled by the limitations and risks associated with traditional manned underwater operations, making AUVs a safer and more cost-effective alternative. The segmentation of the market into propulsion systems (electrical, mechanical, and hybrid) reflects the ongoing innovation and competition within the industry, with each type offering distinct advantages based on mission requirements. Leading companies such as Teledyne Marine, General Dynamics, and Kongsberg Gruppen are driving innovation and shaping the market landscape through continuous R&D and strategic partnerships. The market's geographical distribution is expected to show robust growth across North America, Europe, and the Asia-Pacific region, with North America and Europe maintaining a significant market share driven by established research infrastructure and defense spending.
The market's growth, however, is not without its challenges. High initial investment costs for AUV development and deployment, along with the need for skilled personnel for operation and maintenance, pose significant barriers to entry for smaller players. Furthermore, technical complexities related to underwater communication and navigation, along with environmental factors influencing AUV performance, require continuous improvements and advancements. Despite these restraints, the long-term outlook for the AUV market remains positive, driven by ongoing technological improvements, rising government investments in marine research and defense, and the growing focus on sustainable ocean management. The increasing use of AUVs in offshore energy exploration and inspection is also expected to contribute significantly to market growth in the coming years. Market expansion is anticipated particularly in the Asia-Pacific region, driven by increasing infrastructure development and government initiatives.

Autonomous Underwater Vehicles (AUV) Market: A Comprehensive Report (2019-2033)
This comprehensive report provides an in-depth analysis of the Autonomous Underwater Vehicles (AUV) market, encompassing market dynamics, growth trends, regional dominance, product landscapes, key players, and future outlook. The report covers the parent market of underwater vehicles and the child market of autonomous underwater vehicles, offering a granular view of this rapidly evolving sector. The study period spans from 2019 to 2033, with 2025 serving as the base and estimated year. The market size is presented in million units.
Autonomous Underwater Vehicles Market Dynamics & Structure
The AUV market exhibits a moderately concentrated landscape, with key players such as Teledyne Marine, Kongsberg Gruppen, and Lockheed Martin holding significant market share (estimated at xx%). Technological innovation, driven by advancements in sensor technology, AI, and propulsion systems, is a major growth driver. Stringent regulatory frameworks governing underwater operations and environmental concerns influence market dynamics. The market faces competition from remotely operated vehicles (ROVs) and other underwater technologies, although AUVs' autonomy offers a competitive advantage. End-user demographics include military, civil, and scientific research organizations. M&A activity in the sector has been moderate (xx deals in the last 5 years), primarily focused on consolidating technological capabilities and expanding market reach.
- Market Concentration: Moderately concentrated, with top players holding xx% market share.
- Technological Innovation: Advancements in AI, sensor technology, and propulsion systems are key drivers.
- Regulatory Framework: Stringent regulations impacting market entry and operations.
- Competitive Substitutes: ROVs and other underwater technologies pose competition.
- End-User Demographics: Military, civil, and research organizations dominate the market.
- M&A Trends: Moderate activity focused on technological integration and market expansion.
Autonomous Underwater Vehicles Market Growth Trends & Insights
The global AUV market experienced significant growth during the historical period (2019-2024), expanding from xx million units to xx million units. This growth is projected to continue at a Compound Annual Growth Rate (CAGR) of xx% during the forecast period (2025-2033), reaching an estimated xx million units by 2033. Market penetration is currently at xx% in key regions, with significant growth potential in developing economies. Technological disruptions, such as the adoption of hybrid propulsion systems and advanced AI algorithms for enhanced autonomy and navigation, are accelerating market expansion. Consumer behavior shifts towards increased reliance on autonomous solutions for various underwater applications further contribute to market growth.
Dominant Regions, Countries, or Segments in Autonomous Underwater Vehicles Market
The military segment currently dominates the AUV market, accounting for xx% of the total market share. This is driven by significant investments in defense technologies and a growing need for autonomous underwater surveillance and defense systems. North America and Europe are currently the leading regions, fueled by substantial defense budgets and advanced technological capabilities. However, the Asia-Pacific region is experiencing rapid growth, driven by increasing government investments in maritime security and exploration.
- Military Segment Dominance: High demand for autonomous surveillance and defense systems.
- North America & Europe: Established markets with high defense spending.
- Asia-Pacific Region: Rapid growth driven by increasing government investments.
- Civil Applications: Growing demand in oceanography, environmental monitoring, and offshore operations.
Autonomous Underwater Vehicles Market Product Landscape
AUV technology is constantly evolving, with innovations focusing on enhanced maneuverability, extended operational endurance, improved sensor integration, and increased payload capacity. Products range from small, man-portable AUVs to large, deep-sea vehicles capable of operating for extended durations. Key features driving product differentiation include sophisticated navigation systems, advanced sensor suites, and robust communication capabilities.
Key Drivers, Barriers & Challenges in Autonomous Underwater Vehicles Market
Key Drivers:
- Increasing demand for underwater surveillance and defense systems.
- Growing adoption of AUVs in oceanographic research and environmental monitoring.
- Advancements in AI, sensor technology, and propulsion systems.
- Expanding offshore oil and gas exploration activities.
Challenges and Restraints:
- High initial investment costs associated with AUV development and deployment.
- Limited operational range and endurance for certain AUV types.
- Potential risks associated with underwater operations and environmental impacts.
- Supply chain disruptions impacting the availability of critical components.
Emerging Opportunities in Autonomous Underwater Vehicles Market
Emerging opportunities include the expansion of AUV applications in infrastructure inspection, underwater cable maintenance, and aquaculture. The development of miniaturized, low-cost AUVs is opening new market segments. The integration of AUVs with other underwater technologies, such as remotely operated vehicles (ROVs), and the development of hybrid and electric propulsion systems are also creating exciting possibilities.
Growth Accelerators in the Autonomous Underwater Vehicles Market Industry
Technological advancements, strategic collaborations between technology providers and end-users, and the expansion of global research and development efforts are key growth accelerators. Government initiatives promoting the adoption of autonomous technologies in various sectors are further driving market expansion.
Key Players Shaping the Autonomous Underwater Vehicles Market Market
- Teledyne Marine (Teledyne Technologies Inc)
- General Dynamics Corporation
- Anduril Industries Inc
- Mazagaon Dockyard Limite
- Kongsberg Gruppen ASA
- Lockheed Martin Corporation
- Exail Technologies
- Huntington Ingalls Industries Inc
- The Boeing Company
Notable Milestones in Autonomous Underwater Vehicles Market Sector
- July 2023: Launch of Neerakshi AUV by GRSE Ltd and AEPL in India.
- December 2022: UK Royal Navy awards USD 18.86 million contract to Marlin Submarines Ltd.
- November 2022: Exail Technologies awarded USD 3.72 million contract by the French Defence Procurement Agency.
- June 2022: Jaia Robotics raises over USD 1 million in funding.
In-Depth Autonomous Underwater Vehicles Market Market Outlook
The AUV market is poised for significant growth in the coming years, driven by technological advancements, increasing demand from various sectors, and substantial investments in research and development. Strategic partnerships, market expansion into developing economies, and the development of innovative applications will create substantial opportunities for market players. The focus on developing more efficient, cost-effective, and environmentally friendly AUV technologies will shape the future landscape of this dynamic market.
Autonomous Underwater Vehicles Market Segmentation
- 1. Production Analysis
- 2. Consumption Analysis
- 3. Import Market Analysis (Value & Volume)
- 4. Export Market Analysis (Value & Volume)
- 5. Price Trend Analysis
Autonomous Underwater Vehicles Market Segmentation By Geography
-
1. North America
- 1.1. United States
- 1.2. Canada
- 1.3. Mexico
-
2. South America
- 2.1. Brazil
- 2.2. Argentina
- 2.3. Rest of South America
-
3. Europe
- 3.1. United Kingdom
- 3.2. Germany
- 3.3. France
- 3.4. Italy
- 3.5. Spain
- 3.6. Russia
- 3.7. Benelux
- 3.8. Nordics
- 3.9. Rest of Europe
-
4. Middle East & Africa
- 4.1. Turkey
- 4.2. Israel
- 4.3. GCC
- 4.4. North Africa
- 4.5. South Africa
- 4.6. Rest of Middle East & Africa
-
5. Asia Pacific
- 5.1. China
- 5.2. India
- 5.3. Japan
- 5.4. South Korea
- 5.5. ASEAN
- 5.6. Oceania
- 5.7. Rest of Asia Pacific

Autonomous Underwater Vehicles Market REPORT HIGHLIGHTS
| Aspects | Details |
|---|---|
| Study Period | 2019-2033 |
| Base Year | 2024 |
| Estimated Year | 2025 |
| Forecast Period | 2025-2033 |
| Historical Period | 2019-2024 |
| Growth Rate | CAGR of 13.05% from 2019-2033 |
| Segmentation |
|
Table of Contents
- 1. Introduction
- 1.1. Research Scope
- 1.2. Market Segmentation
- 1.3. Research Methodology
- 1.4. Definitions and Assumptions
- 2. Executive Summary
- 2.1. Introduction
- 3. Market Dynamics
- 3.1. Introduction
- 3.2. Market Drivers
- 3.2.1. Increase in Internet of Things (IoT) and Autonomous Systems; Rise in Demand for Military and Defense Satellite Communication Solutions
- 3.3. Market Restrains
- 3.3.1. Cybersecurity Threats to Satellite Communication; Interference in Transmission of Data
- 3.4. Market Trends
- 3.4.1. Civil Segment is Expected to Experience Substantial Growth During the Forecast Period
- 4. Market Factor Analysis
- 4.1. Porters Five Forces
- 4.2. Supply/Value Chain
- 4.3. PESTEL analysis
- 4.4. Market Entropy
- 4.5. Patent/Trademark Analysis
- 5. Global Autonomous Underwater Vehicles Market Analysis, Insights and Forecast, 2019-2031
- 5.1. Market Analysis, Insights and Forecast - by Production Analysis
- 5.2. Market Analysis, Insights and Forecast - by Consumption Analysis
- 5.3. Market Analysis, Insights and Forecast - by Import Market Analysis (Value & Volume)
- 5.4. Market Analysis, Insights and Forecast - by Export Market Analysis (Value & Volume)
- 5.5. Market Analysis, Insights and Forecast - by Price Trend Analysis
- 5.6. Market Analysis, Insights and Forecast - by Region
- 5.6.1. North America
- 5.6.2. South America
- 5.6.3. Europe
- 5.6.4. Middle East & Africa
- 5.6.5. Asia Pacific
- 5.1. Market Analysis, Insights and Forecast - by Production Analysis
- 6. North America Autonomous Underwater Vehicles Market Analysis, Insights and Forecast, 2019-2031
- 6.1. Market Analysis, Insights and Forecast - by Production Analysis
- 6.2. Market Analysis, Insights and Forecast - by Consumption Analysis
- 6.3. Market Analysis, Insights and Forecast - by Import Market Analysis (Value & Volume)
- 6.4. Market Analysis, Insights and Forecast - by Export Market Analysis (Value & Volume)
- 6.5. Market Analysis, Insights and Forecast - by Price Trend Analysis
- 6.1. Market Analysis, Insights and Forecast - by Production Analysis
- 7. South America Autonomous Underwater Vehicles Market Analysis, Insights and Forecast, 2019-2031
- 7.1. Market Analysis, Insights and Forecast - by Production Analysis
- 7.2. Market Analysis, Insights and Forecast - by Consumption Analysis
- 7.3. Market Analysis, Insights and Forecast - by Import Market Analysis (Value & Volume)
- 7.4. Market Analysis, Insights and Forecast - by Export Market Analysis (Value & Volume)
- 7.5. Market Analysis, Insights and Forecast - by Price Trend Analysis
- 7.1. Market Analysis, Insights and Forecast - by Production Analysis
- 8. Europe Autonomous Underwater Vehicles Market Analysis, Insights and Forecast, 2019-2031
- 8.1. Market Analysis, Insights and Forecast - by Production Analysis
- 8.2. Market Analysis, Insights and Forecast - by Consumption Analysis
- 8.3. Market Analysis, Insights and Forecast - by Import Market Analysis (Value & Volume)
- 8.4. Market Analysis, Insights and Forecast - by Export Market Analysis (Value & Volume)
- 8.5. Market Analysis, Insights and Forecast - by Price Trend Analysis
- 8.1. Market Analysis, Insights and Forecast - by Production Analysis
- 9. Middle East & Africa Autonomous Underwater Vehicles Market Analysis, Insights and Forecast, 2019-2031
- 9.1. Market Analysis, Insights and Forecast - by Production Analysis
- 9.2. Market Analysis, Insights and Forecast - by Consumption Analysis
- 9.3. Market Analysis, Insights and Forecast - by Import Market Analysis (Value & Volume)
- 9.4. Market Analysis, Insights and Forecast - by Export Market Analysis (Value & Volume)
- 9.5. Market Analysis, Insights and Forecast - by Price Trend Analysis
- 9.1. Market Analysis, Insights and Forecast - by Production Analysis
- 10. Asia Pacific Autonomous Underwater Vehicles Market Analysis, Insights and Forecast, 2019-2031
- 10.1. Market Analysis, Insights and Forecast - by Production Analysis
- 10.2. Market Analysis, Insights and Forecast - by Consumption Analysis
- 10.3. Market Analysis, Insights and Forecast - by Import Market Analysis (Value & Volume)
- 10.4. Market Analysis, Insights and Forecast - by Export Market Analysis (Value & Volume)
- 10.5. Market Analysis, Insights and Forecast - by Price Trend Analysis
- 10.1. Market Analysis, Insights and Forecast - by Production Analysis
- 11. North America Autonomous Underwater Vehicles Market Analysis, Insights and Forecast, 2019-2031
- 11.1. Market Analysis, Insights and Forecast - By Country/Sub-region
- 11.1.1 United States
- 11.1.2 Canada
- 12. Europe Autonomous Underwater Vehicles Market Analysis, Insights and Forecast, 2019-2031
- 12.1. Market Analysis, Insights and Forecast - By Country/Sub-region
- 12.1.1 United Kingdom
- 12.1.2 Germany
- 12.1.3 France
- 12.1.4 Rest of Europe
- 13. Asia Pacific Autonomous Underwater Vehicles Market Analysis, Insights and Forecast, 2019-2031
- 13.1. Market Analysis, Insights and Forecast - By Country/Sub-region
- 13.1.1 China
- 13.1.2 India
- 13.1.3 Japan
- 13.1.4 South Korea
- 13.1.5 Rest of Asia Pacific
- 14. Rest of the World Autonomous Underwater Vehicles Market Analysis, Insights and Forecast, 2019-2031
- 14.1. Market Analysis, Insights and Forecast - By Country/Sub-region
- 14.1.1.
- 15. Competitive Analysis
- 15.1. Global Market Share Analysis 2024
- 15.2. Company Profiles
- 15.2.1 Teledyne Marine (Teledyne Technologies Inc )
- 15.2.1.1. Overview
- 15.2.1.2. Products
- 15.2.1.3. SWOT Analysis
- 15.2.1.4. Recent Developments
- 15.2.1.5. Financials (Based on Availability)
- 15.2.2 General Dynamics Corporation
- 15.2.2.1. Overview
- 15.2.2.2. Products
- 15.2.2.3. SWOT Analysis
- 15.2.2.4. Recent Developments
- 15.2.2.5. Financials (Based on Availability)
- 15.2.3 Anduril Industries Inc
- 15.2.3.1. Overview
- 15.2.3.2. Products
- 15.2.3.3. SWOT Analysis
- 15.2.3.4. Recent Developments
- 15.2.3.5. Financials (Based on Availability)
- 15.2.4 Mazagaon Dockyard Limite
- 15.2.4.1. Overview
- 15.2.4.2. Products
- 15.2.4.3. SWOT Analysis
- 15.2.4.4. Recent Developments
- 15.2.4.5. Financials (Based on Availability)
- 15.2.5 Kongsberg Gruppen ASA
- 15.2.5.1. Overview
- 15.2.5.2. Products
- 15.2.5.3. SWOT Analysis
- 15.2.5.4. Recent Developments
- 15.2.5.5. Financials (Based on Availability)
- 15.2.6 Lockheed Martin Corporation
- 15.2.6.1. Overview
- 15.2.6.2. Products
- 15.2.6.3. SWOT Analysis
- 15.2.6.4. Recent Developments
- 15.2.6.5. Financials (Based on Availability)
- 15.2.7 Exail Technologies
- 15.2.7.1. Overview
- 15.2.7.2. Products
- 15.2.7.3. SWOT Analysis
- 15.2.7.4. Recent Developments
- 15.2.7.5. Financials (Based on Availability)
- 15.2.8 Huntington Ingalls Industries Inc
- 15.2.8.1. Overview
- 15.2.8.2. Products
- 15.2.8.3. SWOT Analysis
- 15.2.8.4. Recent Developments
- 15.2.8.5. Financials (Based on Availability)
- 15.2.9 The Boeing Company
- 15.2.9.1. Overview
- 15.2.9.2. Products
- 15.2.9.3. SWOT Analysis
- 15.2.9.4. Recent Developments
- 15.2.9.5. Financials (Based on Availability)
- 15.2.1 Teledyne Marine (Teledyne Technologies Inc )
List of Figures
- Figure 1: Global Autonomous Underwater Vehicles Market Revenue Breakdown (Million, %) by Region 2024 & 2032
- Figure 2: North America Autonomous Underwater Vehicles Market Revenue (Million), by Country 2024 & 2032
- Figure 3: North America Autonomous Underwater Vehicles Market Revenue Share (%), by Country 2024 & 2032
- Figure 4: Europe Autonomous Underwater Vehicles Market Revenue (Million), by Country 2024 & 2032
- Figure 5: Europe Autonomous Underwater Vehicles Market Revenue Share (%), by Country 2024 & 2032
- Figure 6: Asia Pacific Autonomous Underwater Vehicles Market Revenue (Million), by Country 2024 & 2032
- Figure 7: Asia Pacific Autonomous Underwater Vehicles Market Revenue Share (%), by Country 2024 & 2032
- Figure 8: Rest of the World Autonomous Underwater Vehicles Market Revenue (Million), by Country 2024 & 2032
- Figure 9: Rest of the World Autonomous Underwater Vehicles Market Revenue Share (%), by Country 2024 & 2032
- Figure 10: North America Autonomous Underwater Vehicles Market Revenue (Million), by Production Analysis 2024 & 2032
- Figure 11: North America Autonomous Underwater Vehicles Market Revenue Share (%), by Production Analysis 2024 & 2032
- Figure 12: North America Autonomous Underwater Vehicles Market Revenue (Million), by Consumption Analysis 2024 & 2032
- Figure 13: North America Autonomous Underwater Vehicles Market Revenue Share (%), by Consumption Analysis 2024 & 2032
- Figure 14: North America Autonomous Underwater Vehicles Market Revenue (Million), by Import Market Analysis (Value & Volume) 2024 & 2032
- Figure 15: North America Autonomous Underwater Vehicles Market Revenue Share (%), by Import Market Analysis (Value & Volume) 2024 & 2032
- Figure 16: North America Autonomous Underwater Vehicles Market Revenue (Million), by Export Market Analysis (Value & Volume) 2024 & 2032
- Figure 17: North America Autonomous Underwater Vehicles Market Revenue Share (%), by Export Market Analysis (Value & Volume) 2024 & 2032
- Figure 18: North America Autonomous Underwater Vehicles Market Revenue (Million), by Price Trend Analysis 2024 & 2032
- Figure 19: North America Autonomous Underwater Vehicles Market Revenue Share (%), by Price Trend Analysis 2024 & 2032
- Figure 20: North America Autonomous Underwater Vehicles Market Revenue (Million), by Country 2024 & 2032
- Figure 21: North America Autonomous Underwater Vehicles Market Revenue Share (%), by Country 2024 & 2032
- Figure 22: South America Autonomous Underwater Vehicles Market Revenue (Million), by Production Analysis 2024 & 2032
- Figure 23: South America Autonomous Underwater Vehicles Market Revenue Share (%), by Production Analysis 2024 & 2032
- Figure 24: South America Autonomous Underwater Vehicles Market Revenue (Million), by Consumption Analysis 2024 & 2032
- Figure 25: South America Autonomous Underwater Vehicles Market Revenue Share (%), by Consumption Analysis 2024 & 2032
- Figure 26: South America Autonomous Underwater Vehicles Market Revenue (Million), by Import Market Analysis (Value & Volume) 2024 & 2032
- Figure 27: South America Autonomous Underwater Vehicles Market Revenue Share (%), by Import Market Analysis (Value & Volume) 2024 & 2032
- Figure 28: South America Autonomous Underwater Vehicles Market Revenue (Million), by Export Market Analysis (Value & Volume) 2024 & 2032
- Figure 29: South America Autonomous Underwater Vehicles Market Revenue Share (%), by Export Market Analysis (Value & Volume) 2024 & 2032
- Figure 30: South America Autonomous Underwater Vehicles Market Revenue (Million), by Price Trend Analysis 2024 & 2032
- Figure 31: South America Autonomous Underwater Vehicles Market Revenue Share (%), by Price Trend Analysis 2024 & 2032
- Figure 32: South America Autonomous Underwater Vehicles Market Revenue (Million), by Country 2024 & 2032
- Figure 33: South America Autonomous Underwater Vehicles Market Revenue Share (%), by Country 2024 & 2032
- Figure 34: Europe Autonomous Underwater Vehicles Market Revenue (Million), by Production Analysis 2024 & 2032
- Figure 35: Europe Autonomous Underwater Vehicles Market Revenue Share (%), by Production Analysis 2024 & 2032
- Figure 36: Europe Autonomous Underwater Vehicles Market Revenue (Million), by Consumption Analysis 2024 & 2032
- Figure 37: Europe Autonomous Underwater Vehicles Market Revenue Share (%), by Consumption Analysis 2024 & 2032
- Figure 38: Europe Autonomous Underwater Vehicles Market Revenue (Million), by Import Market Analysis (Value & Volume) 2024 & 2032
- Figure 39: Europe Autonomous Underwater Vehicles Market Revenue Share (%), by Import Market Analysis (Value & Volume) 2024 & 2032
- Figure 40: Europe Autonomous Underwater Vehicles Market Revenue (Million), by Export Market Analysis (Value & Volume) 2024 & 2032
- Figure 41: Europe Autonomous Underwater Vehicles Market Revenue Share (%), by Export Market Analysis (Value & Volume) 2024 & 2032
- Figure 42: Europe Autonomous Underwater Vehicles Market Revenue (Million), by Price Trend Analysis 2024 & 2032
- Figure 43: Europe Autonomous Underwater Vehicles Market Revenue Share (%), by Price Trend Analysis 2024 & 2032
- Figure 44: Europe Autonomous Underwater Vehicles Market Revenue (Million), by Country 2024 & 2032
- Figure 45: Europe Autonomous Underwater Vehicles Market Revenue Share (%), by Country 2024 & 2032
- Figure 46: Middle East & Africa Autonomous Underwater Vehicles Market Revenue (Million), by Production Analysis 2024 & 2032
- Figure 47: Middle East & Africa Autonomous Underwater Vehicles Market Revenue Share (%), by Production Analysis 2024 & 2032
- Figure 48: Middle East & Africa Autonomous Underwater Vehicles Market Revenue (Million), by Consumption Analysis 2024 & 2032
- Figure 49: Middle East & Africa Autonomous Underwater Vehicles Market Revenue Share (%), by Consumption Analysis 2024 & 2032
- Figure 50: Middle East & Africa Autonomous Underwater Vehicles Market Revenue (Million), by Import Market Analysis (Value & Volume) 2024 & 2032
- Figure 51: Middle East & Africa Autonomous Underwater Vehicles Market Revenue Share (%), by Import Market Analysis (Value & Volume) 2024 & 2032
- Figure 52: Middle East & Africa Autonomous Underwater Vehicles Market Revenue (Million), by Export Market Analysis (Value & Volume) 2024 & 2032
- Figure 53: Middle East & Africa Autonomous Underwater Vehicles Market Revenue Share (%), by Export Market Analysis (Value & Volume) 2024 & 2032
- Figure 54: Middle East & Africa Autonomous Underwater Vehicles Market Revenue (Million), by Price Trend Analysis 2024 & 2032
- Figure 55: Middle East & Africa Autonomous Underwater Vehicles Market Revenue Share (%), by Price Trend Analysis 2024 & 2032
- Figure 56: Middle East & Africa Autonomous Underwater Vehicles Market Revenue (Million), by Country 2024 & 2032
- Figure 57: Middle East & Africa Autonomous Underwater Vehicles Market Revenue Share (%), by Country 2024 & 2032
- Figure 58: Asia Pacific Autonomous Underwater Vehicles Market Revenue (Million), by Production Analysis 2024 & 2032
- Figure 59: Asia Pacific Autonomous Underwater Vehicles Market Revenue Share (%), by Production Analysis 2024 & 2032
- Figure 60: Asia Pacific Autonomous Underwater Vehicles Market Revenue (Million), by Consumption Analysis 2024 & 2032
- Figure 61: Asia Pacific Autonomous Underwater Vehicles Market Revenue Share (%), by Consumption Analysis 2024 & 2032
- Figure 62: Asia Pacific Autonomous Underwater Vehicles Market Revenue (Million), by Import Market Analysis (Value & Volume) 2024 & 2032
- Figure 63: Asia Pacific Autonomous Underwater Vehicles Market Revenue Share (%), by Import Market Analysis (Value & Volume) 2024 & 2032
- Figure 64: Asia Pacific Autonomous Underwater Vehicles Market Revenue (Million), by Export Market Analysis (Value & Volume) 2024 & 2032
- Figure 65: Asia Pacific Autonomous Underwater Vehicles Market Revenue Share (%), by Export Market Analysis (Value & Volume) 2024 & 2032
- Figure 66: Asia Pacific Autonomous Underwater Vehicles Market Revenue (Million), by Price Trend Analysis 2024 & 2032
- Figure 67: Asia Pacific Autonomous Underwater Vehicles Market Revenue Share (%), by Price Trend Analysis 2024 & 2032
- Figure 68: Asia Pacific Autonomous Underwater Vehicles Market Revenue (Million), by Country 2024 & 2032
- Figure 69: Asia Pacific Autonomous Underwater Vehicles Market Revenue Share (%), by Country 2024 & 2032
List of Tables
- Table 1: Global Autonomous Underwater Vehicles Market Revenue Million Forecast, by Region 2019 & 2032
- Table 2: Global Autonomous Underwater Vehicles Market Revenue Million Forecast, by Production Analysis 2019 & 2032
- Table 3: Global Autonomous Underwater Vehicles Market Revenue Million Forecast, by Consumption Analysis 2019 & 2032
- Table 4: Global Autonomous Underwater Vehicles Market Revenue Million Forecast, by Import Market Analysis (Value & Volume) 2019 & 2032
- Table 5: Global Autonomous Underwater Vehicles Market Revenue Million Forecast, by Export Market Analysis (Value & Volume) 2019 & 2032
- Table 6: Global Autonomous Underwater Vehicles Market Revenue Million Forecast, by Price Trend Analysis 2019 & 2032
- Table 7: Global Autonomous Underwater Vehicles Market Revenue Million Forecast, by Region 2019 & 2032
- Table 8: Global Autonomous Underwater Vehicles Market Revenue Million Forecast, by Country 2019 & 2032
- Table 9: United States Autonomous Underwater Vehicles Market Revenue (Million) Forecast, by Application 2019 & 2032
- Table 10: Canada Autonomous Underwater Vehicles Market Revenue (Million) Forecast, by Application 2019 & 2032
- Table 11: Global Autonomous Underwater Vehicles Market Revenue Million Forecast, by Country 2019 & 2032
- Table 12: United Kingdom Autonomous Underwater Vehicles Market Revenue (Million) Forecast, by Application 2019 & 2032
- Table 13: Germany Autonomous Underwater Vehicles Market Revenue (Million) Forecast, by Application 2019 & 2032
- Table 14: France Autonomous Underwater Vehicles Market Revenue (Million) Forecast, by Application 2019 & 2032
- Table 15: Rest of Europe Autonomous Underwater Vehicles Market Revenue (Million) Forecast, by Application 2019 & 2032
- Table 16: Global Autonomous Underwater Vehicles Market Revenue Million Forecast, by Country 2019 & 2032
- Table 17: China Autonomous Underwater Vehicles Market Revenue (Million) Forecast, by Application 2019 & 2032
- Table 18: India Autonomous Underwater Vehicles Market Revenue (Million) Forecast, by Application 2019 & 2032
- Table 19: Japan Autonomous Underwater Vehicles Market Revenue (Million) Forecast, by Application 2019 & 2032
- Table 20: South Korea Autonomous Underwater Vehicles Market Revenue (Million) Forecast, by Application 2019 & 2032
- Table 21: Rest of Asia Pacific Autonomous Underwater Vehicles Market Revenue (Million) Forecast, by Application 2019 & 2032
- Table 22: Global Autonomous Underwater Vehicles Market Revenue Million Forecast, by Country 2019 & 2032
- Table 23: Autonomous Underwater Vehicles Market Revenue (Million) Forecast, by Application 2019 & 2032
- Table 24: Global Autonomous Underwater Vehicles Market Revenue Million Forecast, by Production Analysis 2019 & 2032
- Table 25: Global Autonomous Underwater Vehicles Market Revenue Million Forecast, by Consumption Analysis 2019 & 2032
- Table 26: Global Autonomous Underwater Vehicles Market Revenue Million Forecast, by Import Market Analysis (Value & Volume) 2019 & 2032
- Table 27: Global Autonomous Underwater Vehicles Market Revenue Million Forecast, by Export Market Analysis (Value & Volume) 2019 & 2032
- Table 28: Global Autonomous Underwater Vehicles Market Revenue Million Forecast, by Price Trend Analysis 2019 & 2032
- Table 29: Global Autonomous Underwater Vehicles Market Revenue Million Forecast, by Country 2019 & 2032
- Table 30: United States Autonomous Underwater Vehicles Market Revenue (Million) Forecast, by Application 2019 & 2032
- Table 31: Canada Autonomous Underwater Vehicles Market Revenue (Million) Forecast, by Application 2019 & 2032
- Table 32: Mexico Autonomous Underwater Vehicles Market Revenue (Million) Forecast, by Application 2019 & 2032
- Table 33: Global Autonomous Underwater Vehicles Market Revenue Million Forecast, by Production Analysis 2019 & 2032
- Table 34: Global Autonomous Underwater Vehicles Market Revenue Million Forecast, by Consumption Analysis 2019 & 2032
- Table 35: Global Autonomous Underwater Vehicles Market Revenue Million Forecast, by Import Market Analysis (Value & Volume) 2019 & 2032
- Table 36: Global Autonomous Underwater Vehicles Market Revenue Million Forecast, by Export Market Analysis (Value & Volume) 2019 & 2032
- Table 37: Global Autonomous Underwater Vehicles Market Revenue Million Forecast, by Price Trend Analysis 2019 & 2032
- Table 38: Global Autonomous Underwater Vehicles Market Revenue Million Forecast, by Country 2019 & 2032
- Table 39: Brazil Autonomous Underwater Vehicles Market Revenue (Million) Forecast, by Application 2019 & 2032
- Table 40: Argentina Autonomous Underwater Vehicles Market Revenue (Million) Forecast, by Application 2019 & 2032
- Table 41: Rest of South America Autonomous Underwater Vehicles Market Revenue (Million) Forecast, by Application 2019 & 2032
- Table 42: Global Autonomous Underwater Vehicles Market Revenue Million Forecast, by Production Analysis 2019 & 2032
- Table 43: Global Autonomous Underwater Vehicles Market Revenue Million Forecast, by Consumption Analysis 2019 & 2032
- Table 44: Global Autonomous Underwater Vehicles Market Revenue Million Forecast, by Import Market Analysis (Value & Volume) 2019 & 2032
- Table 45: Global Autonomous Underwater Vehicles Market Revenue Million Forecast, by Export Market Analysis (Value & Volume) 2019 & 2032
- Table 46: Global Autonomous Underwater Vehicles Market Revenue Million Forecast, by Price Trend Analysis 2019 & 2032
- Table 47: Global Autonomous Underwater Vehicles Market Revenue Million Forecast, by Country 2019 & 2032
- Table 48: United Kingdom Autonomous Underwater Vehicles Market Revenue (Million) Forecast, by Application 2019 & 2032
- Table 49: Germany Autonomous Underwater Vehicles Market Revenue (Million) Forecast, by Application 2019 & 2032
- Table 50: France Autonomous Underwater Vehicles Market Revenue (Million) Forecast, by Application 2019 & 2032
- Table 51: Italy Autonomous Underwater Vehicles Market Revenue (Million) Forecast, by Application 2019 & 2032
- Table 52: Spain Autonomous Underwater Vehicles Market Revenue (Million) Forecast, by Application 2019 & 2032
- Table 53: Russia Autonomous Underwater Vehicles Market Revenue (Million) Forecast, by Application 2019 & 2032
- Table 54: Benelux Autonomous Underwater Vehicles Market Revenue (Million) Forecast, by Application 2019 & 2032
- Table 55: Nordics Autonomous Underwater Vehicles Market Revenue (Million) Forecast, by Application 2019 & 2032
- Table 56: Rest of Europe Autonomous Underwater Vehicles Market Revenue (Million) Forecast, by Application 2019 & 2032
- Table 57: Global Autonomous Underwater Vehicles Market Revenue Million Forecast, by Production Analysis 2019 & 2032
- Table 58: Global Autonomous Underwater Vehicles Market Revenue Million Forecast, by Consumption Analysis 2019 & 2032
- Table 59: Global Autonomous Underwater Vehicles Market Revenue Million Forecast, by Import Market Analysis (Value & Volume) 2019 & 2032
- Table 60: Global Autonomous Underwater Vehicles Market Revenue Million Forecast, by Export Market Analysis (Value & Volume) 2019 & 2032
- Table 61: Global Autonomous Underwater Vehicles Market Revenue Million Forecast, by Price Trend Analysis 2019 & 2032
- Table 62: Global Autonomous Underwater Vehicles Market Revenue Million Forecast, by Country 2019 & 2032
- Table 63: Turkey Autonomous Underwater Vehicles Market Revenue (Million) Forecast, by Application 2019 & 2032
- Table 64: Israel Autonomous Underwater Vehicles Market Revenue (Million) Forecast, by Application 2019 & 2032
- Table 65: GCC Autonomous Underwater Vehicles Market Revenue (Million) Forecast, by Application 2019 & 2032
- Table 66: North Africa Autonomous Underwater Vehicles Market Revenue (Million) Forecast, by Application 2019 & 2032
- Table 67: South Africa Autonomous Underwater Vehicles Market Revenue (Million) Forecast, by Application 2019 & 2032
- Table 68: Rest of Middle East & Africa Autonomous Underwater Vehicles Market Revenue (Million) Forecast, by Application 2019 & 2032
- Table 69: Global Autonomous Underwater Vehicles Market Revenue Million Forecast, by Production Analysis 2019 & 2032
- Table 70: Global Autonomous Underwater Vehicles Market Revenue Million Forecast, by Consumption Analysis 2019 & 2032
- Table 71: Global Autonomous Underwater Vehicles Market Revenue Million Forecast, by Import Market Analysis (Value & Volume) 2019 & 2032
- Table 72: Global Autonomous Underwater Vehicles Market Revenue Million Forecast, by Export Market Analysis (Value & Volume) 2019 & 2032
- Table 73: Global Autonomous Underwater Vehicles Market Revenue Million Forecast, by Price Trend Analysis 2019 & 2032
- Table 74: Global Autonomous Underwater Vehicles Market Revenue Million Forecast, by Country 2019 & 2032
- Table 75: China Autonomous Underwater Vehicles Market Revenue (Million) Forecast, by Application 2019 & 2032
- Table 76: India Autonomous Underwater Vehicles Market Revenue (Million) Forecast, by Application 2019 & 2032
- Table 77: Japan Autonomous Underwater Vehicles Market Revenue (Million) Forecast, by Application 2019 & 2032
- Table 78: South Korea Autonomous Underwater Vehicles Market Revenue (Million) Forecast, by Application 2019 & 2032
- Table 79: ASEAN Autonomous Underwater Vehicles Market Revenue (Million) Forecast, by Application 2019 & 2032
- Table 80: Oceania Autonomous Underwater Vehicles Market Revenue (Million) Forecast, by Application 2019 & 2032
- Table 81: Rest of Asia Pacific Autonomous Underwater Vehicles Market Revenue (Million) Forecast, by Application 2019 & 2032
Frequently Asked Questions
1. What is the projected Compound Annual Growth Rate (CAGR) of the Autonomous Underwater Vehicles Market?
The projected CAGR is approximately 13.05%.
2. Which companies are prominent players in the Autonomous Underwater Vehicles Market?
Key companies in the market include Teledyne Marine (Teledyne Technologies Inc ), General Dynamics Corporation, Anduril Industries Inc, Mazagaon Dockyard Limite, Kongsberg Gruppen ASA, Lockheed Martin Corporation, Exail Technologies, Huntington Ingalls Industries Inc, The Boeing Company.
3. What are the main segments of the Autonomous Underwater Vehicles Market?
The market segments include Production Analysis, Consumption Analysis, Import Market Analysis (Value & Volume), Export Market Analysis (Value & Volume), Price Trend Analysis.
4. Can you provide details about the market size?
The market size is estimated to be USD XX Million as of 2022.
5. What are some drivers contributing to market growth?
Increase in Internet of Things (IoT) and Autonomous Systems; Rise in Demand for Military and Defense Satellite Communication Solutions.
6. What are the notable trends driving market growth?
Civil Segment is Expected to Experience Substantial Growth During the Forecast Period.
7. Are there any restraints impacting market growth?
Cybersecurity Threats to Satellite Communication; Interference in Transmission of Data.
8. Can you provide examples of recent developments in the market?
July 2023: An AUV named Neerakshi, built by India-based Defence PSU Garden Reach Shipbuilders and Engineers (GRSE) Ltd in collaboration with MSME entity Aerospace Engineering Private Ltd (AEPL), was launched. It is a lightweight and man-portable AUV with a length of 2.15 m and an endurance of nearly 4 hours. It is designed to operate completely autonomously, and its modular design enables it to carry out a variety of roles depending on the payload. The development of this AUV is regarded as a major step towards indigenous capability development in keeping with India's Atmanirbharta policy.
9. What pricing options are available for accessing the report?
Pricing options include single-user, multi-user, and enterprise licenses priced at USD 4750, USD 5250, and USD 8750 respectively.
10. Is the market size provided in terms of value or volume?
The market size is provided in terms of value, measured in Million.
11. Are there any specific market keywords associated with the report?
Yes, the market keyword associated with the report is "Autonomous Underwater Vehicles Market," which aids in identifying and referencing the specific market segment covered.
12. How do I determine which pricing option suits my needs best?
The pricing options vary based on user requirements and access needs. Individual users may opt for single-user licenses, while businesses requiring broader access may choose multi-user or enterprise licenses for cost-effective access to the report.
13. Are there any additional resources or data provided in the Autonomous Underwater Vehicles Market report?
While the report offers comprehensive insights, it's advisable to review the specific contents or supplementary materials provided to ascertain if additional resources or data are available.
14. How can I stay updated on further developments or reports in the Autonomous Underwater Vehicles Market?
To stay informed about further developments, trends, and reports in the Autonomous Underwater Vehicles Market, consider subscribing to industry newsletters, following relevant companies and organizations, or regularly checking reputable industry news sources and publications.
Methodology
Step 1 - Identification of Relevant Samples Size from Population Database


Step 2 - Approaches for Defining Global Market Size (Value, Volume* & Price*)

Note*: In applicable scenarios
Step 3 - Data Sources
Primary Research
- Web Analytics
- Survey Reports
- Research Institute
- Latest Research Reports
- Opinion Leaders
Secondary Research
- Annual Reports
- White Paper
- Latest Press Release
- Industry Association
- Paid Database
- Investor Presentations

Step 4 - Data Triangulation
Involves using different sources of information in order to increase the validity of a study
These sources are likely to be stakeholders in a program - participants, other researchers, program staff, other community members, and so on.
Then we put all data in single framework & apply various statistical tools to find out the dynamic on the market.
During the analysis stage, feedback from the stakeholder groups would be compared to determine areas of agreement as well as areas of divergence
