

Key Insights
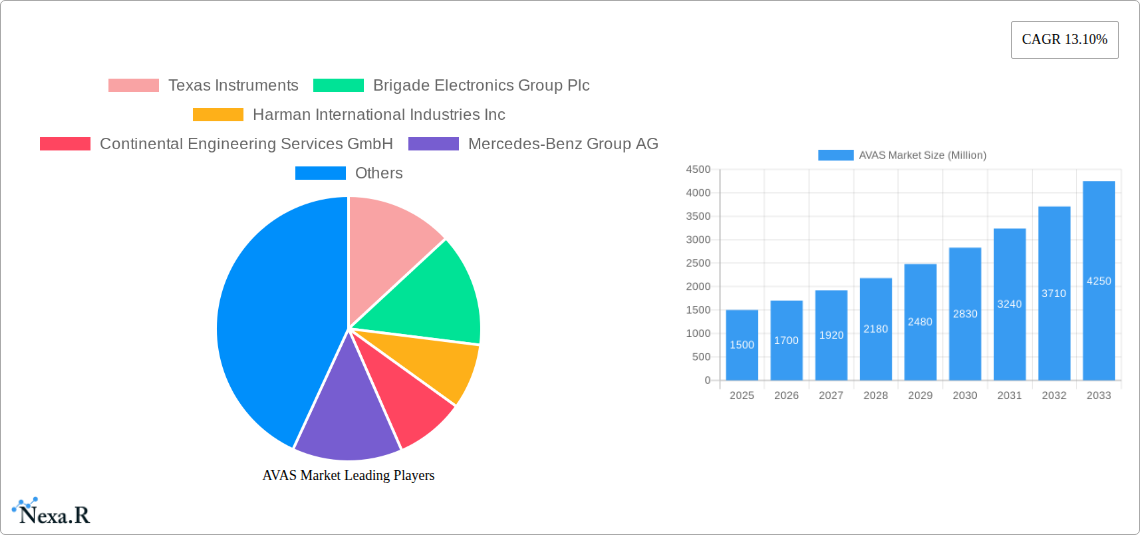
The Acoustic Vehicle Alerting Systems (AVAS) market is experiencing robust growth, driven by stringent regulations mandating AVAS in electric and hybrid vehicles globally. The market, valued at approximately $1.5 billion in 2025 (estimated based on provided CAGR and market size), is projected to expand at a compound annual growth rate (CAGR) of 13.10% from 2025 to 2033. This surge is fueled by the increasing adoption of electric vehicles (EVs) and hybrid electric vehicles (HEVs), which inherently produce less noise than conventional internal combustion engine (ICE) vehicles. The demand for enhanced pedestrian safety is another key driver, as AVAS technology mitigates the risk of accidents involving quieter EVs and HEVs. Market segmentation reveals passenger cars as the largest consumer of AVAS, followed by two-wheelers and commercial vehicles. The OEM (original equipment manufacturer) sales channel currently dominates, but the aftermarket segment presents a significant growth opportunity as the installed base of EVs and HEVs expands. Technological advancements, such as the development of more sophisticated and customizable AVAS systems, contribute to market growth. While the market faces restraints such as the relatively high initial cost of AVAS implementation and potential variations in regulatory landscapes across different regions, the long-term growth trajectory remains positive.
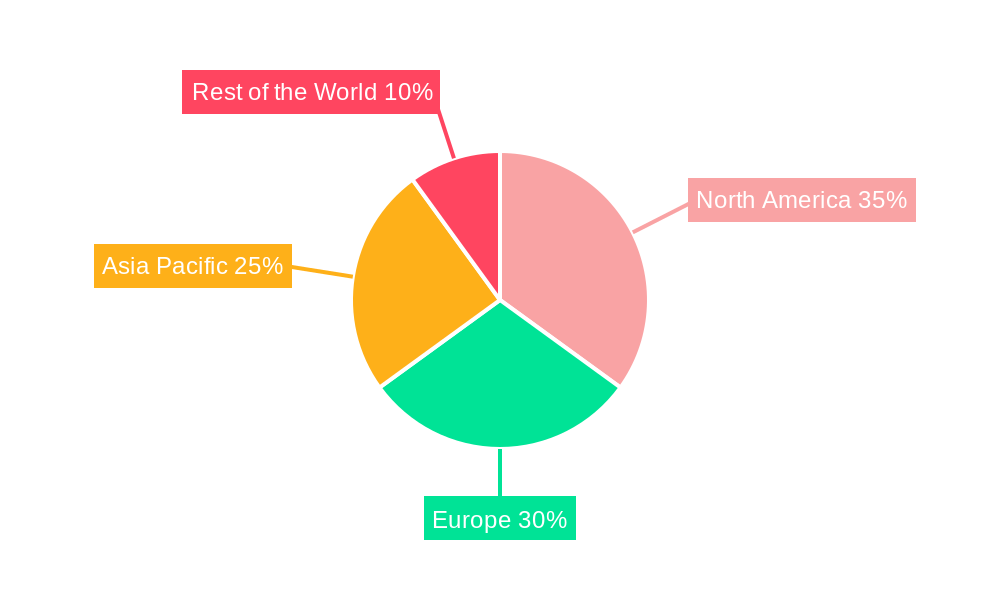
The major players in the AVAS market, including Texas Instruments, Brigade Electronics Group Plc, and Harman International, are investing heavily in research and development to enhance AVAS technology, improve sound quality, and expand functionality. Geographic analysis indicates that North America and Europe are currently the leading markets, driven by early adoption of EVs and stringent safety regulations. However, the Asia-Pacific region, particularly China and India, is expected to witness significant growth in the coming years due to rapid EV adoption and expanding infrastructure. The competitive landscape is characterized by both established automotive component suppliers and specialized AVAS manufacturers. Strategic partnerships, mergers, and acquisitions are expected to shape market dynamics in the coming years as companies seek to expand their market share and technological capabilities. Overall, the AVAS market presents a lucrative opportunity for companies operating in this space, offering substantial growth potential fueled by global trends towards electrification and enhanced road safety.
AVAS Market Report: A Comprehensive Analysis (2019-2033)
This comprehensive report provides an in-depth analysis of the Acoustic Vehicle Alerting System (AVAS) market, encompassing market dynamics, growth trends, regional segmentation, and key player strategies. It covers the historical period (2019-2024), base year (2025), and forecast period (2025-2033), offering valuable insights for industry professionals, investors, and stakeholders. The report segments the AVAS market by vehicle type (Passenger Cars, Two-Wheelers, Commercial Vehicles), propulsion type (Battery Electric Vehicles, Plug-in Hybrid Electric Vehicles, Hybrid Electric Vehicles), and sales channel (OEM, Aftermarket). The total market size is projected to reach xx Million units by 2033.
AVAS Market Dynamics & Structure
The AVAS market is characterized by moderate concentration, with key players like Texas Instruments, Brigade Electronics Group Plc, and Harman International Industries Inc. holding significant market share. Technological innovation, driven by advancements in speaker technology and sound processing algorithms, is a primary growth driver. Stringent regulatory frameworks mandating AVAS in electric and hybrid vehicles across various regions are further fueling market expansion. While traditional warning systems pose a competitive threat, the rising adoption of EVs and stricter safety regulations are overcoming this challenge. The market has witnessed several M&A activities, with xx deals recorded between 2019 and 2024, mainly focused on strengthening technological capabilities and expanding market reach. End-user demographics are shifting towards environmentally conscious consumers who prioritize safety and convenience, favoring the adoption of electric vehicles and subsequently increasing demand for AVAS.
- Market Concentration: Moderately concentrated, with top 5 players holding approximately xx% market share in 2024.
- Technological Innovation: Focus on miniaturization, improved sound quality, and energy efficiency.
- Regulatory Landscape: Stringent regulations mandating AVAS in EVs and HEVs across major markets.
- Competitive Landscape: Competition from traditional warning systems, but overall a positive outlook.
- M&A Activity: xx deals between 2019-2024, primarily for technology acquisition and market expansion.
- End-User Demographics: Growing preference for electric vehicles is driving AVAS adoption.
AVAS Market Growth Trends & Insights
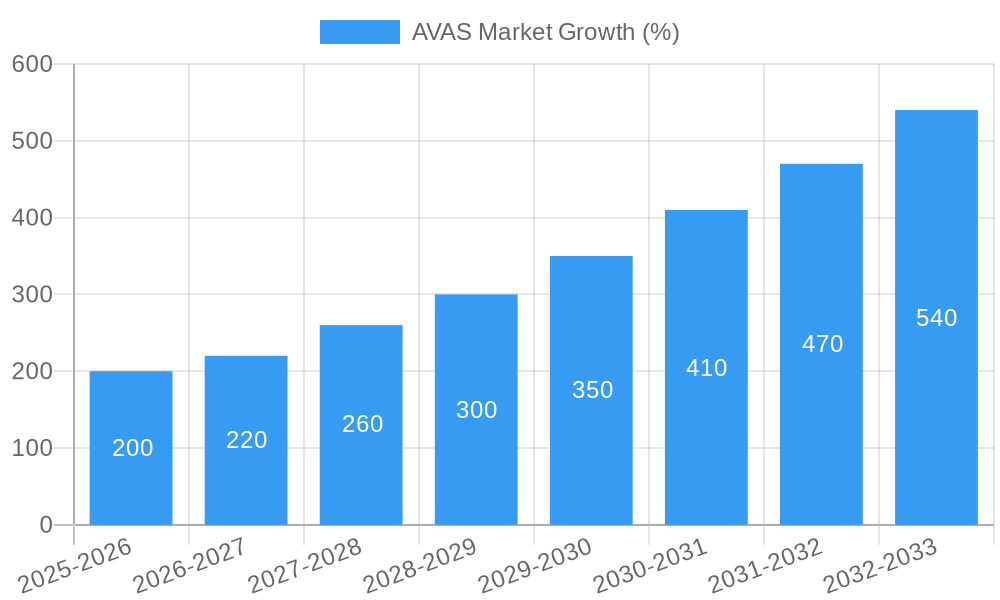
The AVAS market exhibited a CAGR of xx% during the historical period (2019-2024), driven by the increasing adoption of electric and hybrid vehicles globally. This trend is expected to continue during the forecast period (2025-2033), with a projected CAGR of xx%. Market penetration is expected to increase from xx% in 2024 to xx% by 2033, primarily driven by government regulations and increased consumer awareness of pedestrian safety. Technological advancements, such as the development of more sophisticated and energy-efficient AVAS systems, are also contributing to the market's growth. Consumer behavior is shifting towards environmentally friendly vehicles, leading to higher demand for EVs and HEVs, consequently driving the AVAS market. The rise of connected car technologies is further creating opportunities for integrating AVAS with other vehicle safety systems.
Dominant Regions, Countries, or Segments in AVAS Market
The North American and European regions are currently leading the AVAS market due to stringent regulations, high EV adoption rates, and established automotive industries. Within these regions, countries like the US, Germany, and the UK exhibit the highest market share due to supportive government policies and well-developed infrastructure for electric vehicles. Among the segments, the passenger car segment dominates the market, followed by commercial vehicles, due to higher sales volumes and regulatory mandates. The Battery Electric Vehicle (BEV) propulsion type is experiencing the fastest growth due to increased environmental concerns and government incentives. The OEM sales channel holds the largest market share, although the aftermarket segment shows significant growth potential.
- Key Growth Drivers: Stringent regulations, high EV adoption, supportive government policies, and established automotive infrastructure.
- Market Share: North America and Europe hold the largest market share, with the US, Germany, and the UK showing high growth.
- Segment Dominance: Passenger Cars segment leads, followed by Commercial Vehicles and Two-Wheelers with BEVs exhibiting the fastest growth.
- Sales Channel: OEM dominates, but aftermarket is showing considerable growth potential.
AVAS Market Product Landscape
AVAS systems are evolving from simple warning devices to sophisticated systems integrated with advanced driver-assistance systems (ADAS). Product innovations focus on improving sound quality, optimizing energy consumption, and enhancing pedestrian safety. Manufacturers are developing AVAS systems with customizable soundscapes, improving their effectiveness in various environments and vehicle types. Key performance indicators include sound pressure levels (SPL), frequency range, energy efficiency, and system integration capabilities. The focus is on creating unique selling propositions through improved sound quality, advanced sound personalization, and seamless integration into the vehicle's overall safety system.
Key Drivers, Barriers & Challenges in AVAS Market
Key Drivers:
- Increasing adoption of electric and hybrid vehicles.
- Stringent government regulations mandating AVAS.
- Growing consumer awareness of pedestrian safety.
- Technological advancements leading to improved sound quality and energy efficiency.
Key Challenges and Restraints:
- High initial investment costs for manufacturers.
- Complexity in integrating AVAS with existing vehicle systems.
- Concerns about the impact of AVAS sound on driver and passenger comfort.
- Potential supply chain disruptions affecting component availability. The semiconductor shortage has impacted production volumes by approximately xx% in 2024.
Emerging Opportunities in AVAS Market
- Expansion into developing markets with growing EV adoption.
- Integration of AVAS with other ADAS functionalities (e.g., pedestrian detection).
- Development of more personalized and customized AVAS sound profiles.
- Exploring new technologies for improved sound projection and energy efficiency.
Growth Accelerators in the AVAS Market Industry
Technological breakthroughs in speaker design and sound processing algorithms are driving innovation, enhancing AVAS effectiveness and reducing energy consumption. Strategic partnerships between automotive manufacturers and AVAS technology providers are fostering product development and market penetration. Market expansion into new geographic regions, particularly developing economies with growing electric vehicle adoption, is creating significant opportunities for growth.
Key Players Shaping the AVAS Market Market
- Texas Instruments
- Brigade Electronics Group Plc
- Harman International Industries Inc
- Continental Engineering Services GmbH
- Mercedes-Benz Group AG
- Soundracer AB
- Honda Motor Co., Ltd.
- Kufatec GmbH & Co KG
- Hella Gmbh & Co KGaA
- Kendrion NV
Notable Milestones in AVAS Market Sector
- April 2022: Honda Motors introduced a new e-HEV hybrid vehicle in India equipped with AVAS at low-speed EV Mode. This highlights growing adoption in developing markets.
- January 2021: STMicroelectronics introduced an Acoustic Vehicle Alerting System with AutoDevKit, accelerating development and integration.
In-Depth AVAS Market Market Outlook
The AVAS market is poised for significant growth in the coming years, driven by the continued expansion of the electric vehicle market, increasing regulatory pressure, and ongoing technological advancements. Strategic opportunities exist for companies that can develop innovative and cost-effective AVAS solutions that meet evolving consumer demands and regulatory requirements. The market’s long-term prospects are positive, with substantial growth predicted due to the global shift towards electric mobility.
AVAS Market Segmentation
-
1. Vehicle Type
- 1.1. Passenger Cars
- 1.2. Two-Wheelers
- 1.3. Commercial Vehicles
-
2. Propulsion
- 2.1. Battery Electric Vehicles
- 2.2. Plug-in Hybrid Electric Vehicles
-
3. Sales Channel
- 3.1. OEM
- 3.2. Aftermarket
AVAS Market Segmentation By Geography
-
1. North America
- 1.1. United States
- 1.2. Canada
- 1.3. Rest of North America
-
2. Europe
- 2.1. Germany
- 2.2. United Kingdom
- 2.3. France
- 2.4. Italy
- 2.5. Spain
- 2.6. Rest of Europe
-
3. Asia Pacific
- 3.1. India
- 3.2. China
- 3.3. Japan
- 3.4. South Korea
- 3.5. Rest of Asia Pacific
-
4. Rest of the World
- 4.1. Middle East and Africa
- 4.2. South America
AVAS Market REPORT HIGHLIGHTS
| Aspects | Details |
|---|---|
| Study Period | 2019-2033 |
| Base Year | 2024 |
| Estimated Year | 2025 |
| Forecast Period | 2025-2033 |
| Historical Period | 2019-2024 |
| Growth Rate | CAGR of 13.10% from 2019-2033 |
| Segmentation |
|
Table of Contents
- 1. Introduction
- 1.1. Research Scope
- 1.2. Market Segmentation
- 1.3. Research Methodology
- 1.4. Definitions and Assumptions
- 2. Executive Summary
- 2.1. Introduction
- 3. Market Dynamics
- 3.1. Introduction
- 3.2. Market Drivers
- 3.2.1. Rise in demand for Advanced Comfort Systems In Vehicles
- 3.3. Market Restrains
- 3.3.1. High Cost Assoicated with Advanced Features
- 3.4. Market Trends
- 3.4.1. Hybrid Electric Vehicle is dominating the market growth
- 4. Market Factor Analysis
- 4.1. Porters Five Forces
- 4.2. Supply/Value Chain
- 4.3. PESTEL analysis
- 4.4. Market Entropy
- 4.5. Patent/Trademark Analysis
- 5. Global AVAS Market Analysis, Insights and Forecast, 2019-2031
- 5.1. Market Analysis, Insights and Forecast - by Vehicle Type
- 5.1.1. Passenger Cars
- 5.1.2. Two-Wheelers
- 5.1.3. Commercial Vehicles
- 5.2. Market Analysis, Insights and Forecast - by Propulsion
- 5.2.1. Battery Electric Vehicles
- 5.2.2. Plug-in Hybrid Electric Vehicles
- 5.3. Market Analysis, Insights and Forecast - by Sales Channel
- 5.3.1. OEM
- 5.3.2. Aftermarket
- 5.4. Market Analysis, Insights and Forecast - by Region
- 5.4.1. North America
- 5.4.2. Europe
- 5.4.3. Asia Pacific
- 5.4.4. Rest of the World
- 5.1. Market Analysis, Insights and Forecast - by Vehicle Type
- 6. North America AVAS Market Analysis, Insights and Forecast, 2019-2031
- 6.1. Market Analysis, Insights and Forecast - by Vehicle Type
- 6.1.1. Passenger Cars
- 6.1.2. Two-Wheelers
- 6.1.3. Commercial Vehicles
- 6.2. Market Analysis, Insights and Forecast - by Propulsion
- 6.2.1. Battery Electric Vehicles
- 6.2.2. Plug-in Hybrid Electric Vehicles
- 6.3. Market Analysis, Insights and Forecast - by Sales Channel
- 6.3.1. OEM
- 6.3.2. Aftermarket
- 6.1. Market Analysis, Insights and Forecast - by Vehicle Type
- 7. Europe AVAS Market Analysis, Insights and Forecast, 2019-2031
- 7.1. Market Analysis, Insights and Forecast - by Vehicle Type
- 7.1.1. Passenger Cars
- 7.1.2. Two-Wheelers
- 7.1.3. Commercial Vehicles
- 7.2. Market Analysis, Insights and Forecast - by Propulsion
- 7.2.1. Battery Electric Vehicles
- 7.2.2. Plug-in Hybrid Electric Vehicles
- 7.3. Market Analysis, Insights and Forecast - by Sales Channel
- 7.3.1. OEM
- 7.3.2. Aftermarket
- 7.1. Market Analysis, Insights and Forecast - by Vehicle Type
- 8. Asia Pacific AVAS Market Analysis, Insights and Forecast, 2019-2031
- 8.1. Market Analysis, Insights and Forecast - by Vehicle Type
- 8.1.1. Passenger Cars
- 8.1.2. Two-Wheelers
- 8.1.3. Commercial Vehicles
- 8.2. Market Analysis, Insights and Forecast - by Propulsion
- 8.2.1. Battery Electric Vehicles
- 8.2.2. Plug-in Hybrid Electric Vehicles
- 8.3. Market Analysis, Insights and Forecast - by Sales Channel
- 8.3.1. OEM
- 8.3.2. Aftermarket
- 8.1. Market Analysis, Insights and Forecast - by Vehicle Type
- 9. Rest of the World AVAS Market Analysis, Insights and Forecast, 2019-2031
- 9.1. Market Analysis, Insights and Forecast - by Vehicle Type
- 9.1.1. Passenger Cars
- 9.1.2. Two-Wheelers
- 9.1.3. Commercial Vehicles
- 9.2. Market Analysis, Insights and Forecast - by Propulsion
- 9.2.1. Battery Electric Vehicles
- 9.2.2. Plug-in Hybrid Electric Vehicles
- 9.3. Market Analysis, Insights and Forecast - by Sales Channel
- 9.3.1. OEM
- 9.3.2. Aftermarket
- 9.1. Market Analysis, Insights and Forecast - by Vehicle Type
- 10. North America AVAS Market Analysis, Insights and Forecast, 2019-2031
- 10.1. Market Analysis, Insights and Forecast - By Country/Sub-region
- 10.1.1 United States
- 10.1.2 Canada
- 10.1.3 Rest of North America
- 11. Europe AVAS Market Analysis, Insights and Forecast, 2019-2031
- 11.1. Market Analysis, Insights and Forecast - By Country/Sub-region
- 11.1.1 Germany
- 11.1.2 United Kingdom
- 11.1.3 France
- 11.1.4 Italy
- 11.1.5 Spain
- 11.1.6 Rest of Europe
- 12. Asia Pacific AVAS Market Analysis, Insights and Forecast, 2019-2031
- 12.1. Market Analysis, Insights and Forecast - By Country/Sub-region
- 12.1.1 India
- 12.1.2 China
- 12.1.3 Japan
- 12.1.4 South Korea
- 12.1.5 Rest of Asia Pacific
- 13. Rest of the World AVAS Market Analysis, Insights and Forecast, 2019-2031
- 13.1. Market Analysis, Insights and Forecast - By Country/Sub-region
- 13.1.1 Middle East and Africa
- 13.1.2 South America
- 14. Competitive Analysis
- 14.1. Global Market Share Analysis 2024
- 14.2. Company Profiles
- 14.2.1 Texas Instruments
- 14.2.1.1. Overview
- 14.2.1.2. Products
- 14.2.1.3. SWOT Analysis
- 14.2.1.4. Recent Developments
- 14.2.1.5. Financials (Based on Availability)
- 14.2.2 Brigade Electronics Group Plc
- 14.2.2.1. Overview
- 14.2.2.2. Products
- 14.2.2.3. SWOT Analysis
- 14.2.2.4. Recent Developments
- 14.2.2.5. Financials (Based on Availability)
- 14.2.3 Harman International Industries Inc
- 14.2.3.1. Overview
- 14.2.3.2. Products
- 14.2.3.3. SWOT Analysis
- 14.2.3.4. Recent Developments
- 14.2.3.5. Financials (Based on Availability)
- 14.2.4 Continental Engineering Services GmbH
- 14.2.4.1. Overview
- 14.2.4.2. Products
- 14.2.4.3. SWOT Analysis
- 14.2.4.4. Recent Developments
- 14.2.4.5. Financials (Based on Availability)
- 14.2.5 Mercedes-Benz Group AG
- 14.2.5.1. Overview
- 14.2.5.2. Products
- 14.2.5.3. SWOT Analysis
- 14.2.5.4. Recent Developments
- 14.2.5.5. Financials (Based on Availability)
- 14.2.6 Soundracer AB
- 14.2.6.1. Overview
- 14.2.6.2. Products
- 14.2.6.3. SWOT Analysis
- 14.2.6.4. Recent Developments
- 14.2.6.5. Financials (Based on Availability)
- 14.2.7 Honda Motor Compan
- 14.2.7.1. Overview
- 14.2.7.2. Products
- 14.2.7.3. SWOT Analysis
- 14.2.7.4. Recent Developments
- 14.2.7.5. Financials (Based on Availability)
- 14.2.8 Kufatec GmbH & Co Kg
- 14.2.8.1. Overview
- 14.2.8.2. Products
- 14.2.8.3. SWOT Analysis
- 14.2.8.4. Recent Developments
- 14.2.8.5. Financials (Based on Availability)
- 14.2.9 Hella Gmbh & Co KGaA
- 14.2.9.1. Overview
- 14.2.9.2. Products
- 14.2.9.3. SWOT Analysis
- 14.2.9.4. Recent Developments
- 14.2.9.5. Financials (Based on Availability)
- 14.2.10 Kendrion NV
- 14.2.10.1. Overview
- 14.2.10.2. Products
- 14.2.10.3. SWOT Analysis
- 14.2.10.4. Recent Developments
- 14.2.10.5. Financials (Based on Availability)
- 14.2.1 Texas Instruments
List of Figures
- Figure 1: Global AVAS Market Revenue Breakdown (Million, %) by Region 2024 & 2032
- Figure 2: North America AVAS Market Revenue (Million), by Country 2024 & 2032
- Figure 3: North America AVAS Market Revenue Share (%), by Country 2024 & 2032
- Figure 4: Europe AVAS Market Revenue (Million), by Country 2024 & 2032
- Figure 5: Europe AVAS Market Revenue Share (%), by Country 2024 & 2032
- Figure 6: Asia Pacific AVAS Market Revenue (Million), by Country 2024 & 2032
- Figure 7: Asia Pacific AVAS Market Revenue Share (%), by Country 2024 & 2032
- Figure 8: Rest of the World AVAS Market Revenue (Million), by Country 2024 & 2032
- Figure 9: Rest of the World AVAS Market Revenue Share (%), by Country 2024 & 2032
- Figure 10: North America AVAS Market Revenue (Million), by Vehicle Type 2024 & 2032
- Figure 11: North America AVAS Market Revenue Share (%), by Vehicle Type 2024 & 2032
- Figure 12: North America AVAS Market Revenue (Million), by Propulsion 2024 & 2032
- Figure 13: North America AVAS Market Revenue Share (%), by Propulsion 2024 & 2032
- Figure 14: North America AVAS Market Revenue (Million), by Sales Channel 2024 & 2032
- Figure 15: North America AVAS Market Revenue Share (%), by Sales Channel 2024 & 2032
- Figure 16: North America AVAS Market Revenue (Million), by Country 2024 & 2032
- Figure 17: North America AVAS Market Revenue Share (%), by Country 2024 & 2032
- Figure 18: Europe AVAS Market Revenue (Million), by Vehicle Type 2024 & 2032
- Figure 19: Europe AVAS Market Revenue Share (%), by Vehicle Type 2024 & 2032
- Figure 20: Europe AVAS Market Revenue (Million), by Propulsion 2024 & 2032
- Figure 21: Europe AVAS Market Revenue Share (%), by Propulsion 2024 & 2032
- Figure 22: Europe AVAS Market Revenue (Million), by Sales Channel 2024 & 2032
- Figure 23: Europe AVAS Market Revenue Share (%), by Sales Channel 2024 & 2032
- Figure 24: Europe AVAS Market Revenue (Million), by Country 2024 & 2032
- Figure 25: Europe AVAS Market Revenue Share (%), by Country 2024 & 2032
- Figure 26: Asia Pacific AVAS Market Revenue (Million), by Vehicle Type 2024 & 2032
- Figure 27: Asia Pacific AVAS Market Revenue Share (%), by Vehicle Type 2024 & 2032
- Figure 28: Asia Pacific AVAS Market Revenue (Million), by Propulsion 2024 & 2032
- Figure 29: Asia Pacific AVAS Market Revenue Share (%), by Propulsion 2024 & 2032
- Figure 30: Asia Pacific AVAS Market Revenue (Million), by Sales Channel 2024 & 2032
- Figure 31: Asia Pacific AVAS Market Revenue Share (%), by Sales Channel 2024 & 2032
- Figure 32: Asia Pacific AVAS Market Revenue (Million), by Country 2024 & 2032
- Figure 33: Asia Pacific AVAS Market Revenue Share (%), by Country 2024 & 2032
- Figure 34: Rest of the World AVAS Market Revenue (Million), by Vehicle Type 2024 & 2032
- Figure 35: Rest of the World AVAS Market Revenue Share (%), by Vehicle Type 2024 & 2032
- Figure 36: Rest of the World AVAS Market Revenue (Million), by Propulsion 2024 & 2032
- Figure 37: Rest of the World AVAS Market Revenue Share (%), by Propulsion 2024 & 2032
- Figure 38: Rest of the World AVAS Market Revenue (Million), by Sales Channel 2024 & 2032
- Figure 39: Rest of the World AVAS Market Revenue Share (%), by Sales Channel 2024 & 2032
- Figure 40: Rest of the World AVAS Market Revenue (Million), by Country 2024 & 2032
- Figure 41: Rest of the World AVAS Market Revenue Share (%), by Country 2024 & 2032
List of Tables
- Table 1: Global AVAS Market Revenue Million Forecast, by Region 2019 & 2032
- Table 2: Global AVAS Market Revenue Million Forecast, by Vehicle Type 2019 & 2032
- Table 3: Global AVAS Market Revenue Million Forecast, by Propulsion 2019 & 2032
- Table 4: Global AVAS Market Revenue Million Forecast, by Sales Channel 2019 & 2032
- Table 5: Global AVAS Market Revenue Million Forecast, by Region 2019 & 2032
- Table 6: Global AVAS Market Revenue Million Forecast, by Country 2019 & 2032
- Table 7: United States AVAS Market Revenue (Million) Forecast, by Application 2019 & 2032
- Table 8: Canada AVAS Market Revenue (Million) Forecast, by Application 2019 & 2032
- Table 9: Rest of North America AVAS Market Revenue (Million) Forecast, by Application 2019 & 2032
- Table 10: Global AVAS Market Revenue Million Forecast, by Country 2019 & 2032
- Table 11: Germany AVAS Market Revenue (Million) Forecast, by Application 2019 & 2032
- Table 12: United Kingdom AVAS Market Revenue (Million) Forecast, by Application 2019 & 2032
- Table 13: France AVAS Market Revenue (Million) Forecast, by Application 2019 & 2032
- Table 14: Italy AVAS Market Revenue (Million) Forecast, by Application 2019 & 2032
- Table 15: Spain AVAS Market Revenue (Million) Forecast, by Application 2019 & 2032
- Table 16: Rest of Europe AVAS Market Revenue (Million) Forecast, by Application 2019 & 2032
- Table 17: Global AVAS Market Revenue Million Forecast, by Country 2019 & 2032
- Table 18: India AVAS Market Revenue (Million) Forecast, by Application 2019 & 2032
- Table 19: China AVAS Market Revenue (Million) Forecast, by Application 2019 & 2032
- Table 20: Japan AVAS Market Revenue (Million) Forecast, by Application 2019 & 2032
- Table 21: South Korea AVAS Market Revenue (Million) Forecast, by Application 2019 & 2032
- Table 22: Rest of Asia Pacific AVAS Market Revenue (Million) Forecast, by Application 2019 & 2032
- Table 23: Global AVAS Market Revenue Million Forecast, by Country 2019 & 2032
- Table 24: Middle East and Africa AVAS Market Revenue (Million) Forecast, by Application 2019 & 2032
- Table 25: South America AVAS Market Revenue (Million) Forecast, by Application 2019 & 2032
- Table 26: Global AVAS Market Revenue Million Forecast, by Vehicle Type 2019 & 2032
- Table 27: Global AVAS Market Revenue Million Forecast, by Propulsion 2019 & 2032
- Table 28: Global AVAS Market Revenue Million Forecast, by Sales Channel 2019 & 2032
- Table 29: Global AVAS Market Revenue Million Forecast, by Country 2019 & 2032
- Table 30: United States AVAS Market Revenue (Million) Forecast, by Application 2019 & 2032
- Table 31: Canada AVAS Market Revenue (Million) Forecast, by Application 2019 & 2032
- Table 32: Rest of North America AVAS Market Revenue (Million) Forecast, by Application 2019 & 2032
- Table 33: Global AVAS Market Revenue Million Forecast, by Vehicle Type 2019 & 2032
- Table 34: Global AVAS Market Revenue Million Forecast, by Propulsion 2019 & 2032
- Table 35: Global AVAS Market Revenue Million Forecast, by Sales Channel 2019 & 2032
- Table 36: Global AVAS Market Revenue Million Forecast, by Country 2019 & 2032
- Table 37: Germany AVAS Market Revenue (Million) Forecast, by Application 2019 & 2032
- Table 38: United Kingdom AVAS Market Revenue (Million) Forecast, by Application 2019 & 2032
- Table 39: France AVAS Market Revenue (Million) Forecast, by Application 2019 & 2032
- Table 40: Italy AVAS Market Revenue (Million) Forecast, by Application 2019 & 2032
- Table 41: Spain AVAS Market Revenue (Million) Forecast, by Application 2019 & 2032
- Table 42: Rest of Europe AVAS Market Revenue (Million) Forecast, by Application 2019 & 2032
- Table 43: Global AVAS Market Revenue Million Forecast, by Vehicle Type 2019 & 2032
- Table 44: Global AVAS Market Revenue Million Forecast, by Propulsion 2019 & 2032
- Table 45: Global AVAS Market Revenue Million Forecast, by Sales Channel 2019 & 2032
- Table 46: Global AVAS Market Revenue Million Forecast, by Country 2019 & 2032
- Table 47: India AVAS Market Revenue (Million) Forecast, by Application 2019 & 2032
- Table 48: China AVAS Market Revenue (Million) Forecast, by Application 2019 & 2032
- Table 49: Japan AVAS Market Revenue (Million) Forecast, by Application 2019 & 2032
- Table 50: South Korea AVAS Market Revenue (Million) Forecast, by Application 2019 & 2032
- Table 51: Rest of Asia Pacific AVAS Market Revenue (Million) Forecast, by Application 2019 & 2032
- Table 52: Global AVAS Market Revenue Million Forecast, by Vehicle Type 2019 & 2032
- Table 53: Global AVAS Market Revenue Million Forecast, by Propulsion 2019 & 2032
- Table 54: Global AVAS Market Revenue Million Forecast, by Sales Channel 2019 & 2032
- Table 55: Global AVAS Market Revenue Million Forecast, by Country 2019 & 2032
- Table 56: Middle East and Africa AVAS Market Revenue (Million) Forecast, by Application 2019 & 2032
- Table 57: South America AVAS Market Revenue (Million) Forecast, by Application 2019 & 2032
Frequently Asked Questions
1. What is the projected Compound Annual Growth Rate (CAGR) of the AVAS Market?
The projected CAGR is approximately 13.10%.
2. Which companies are prominent players in the AVAS Market?
Key companies in the market include Texas Instruments, Brigade Electronics Group Plc, Harman International Industries Inc, Continental Engineering Services GmbH, Mercedes-Benz Group AG, Soundracer AB, Honda Motor Compan, Kufatec GmbH & Co Kg, Hella Gmbh & Co KGaA, Kendrion NV.
3. What are the main segments of the AVAS Market?
The market segments include Vehicle Type, Propulsion, Sales Channel.
4. Can you provide details about the market size?
The market size is estimated to be USD XX Million as of 2022.
5. What are some drivers contributing to market growth?
Rise in demand for Advanced Comfort Systems In Vehicles.
6. What are the notable trends driving market growth?
Hybrid Electric Vehicle is dominating the market growth.
7. Are there any restraints impacting market growth?
High Cost Assoicated with Advanced Features.
8. Can you provide examples of recent developments in the market?
In April 2022, Honda Motors introduced a new e-HEV hybrid vehicle in India. The new hybrid vehicle is equipped with AVAS (Acoustic Vehicle Alerting System) at low-speed EV Mode.
9. What pricing options are available for accessing the report?
Pricing options include single-user, multi-user, and enterprise licenses priced at USD 4750, USD 5250, and USD 8750 respectively.
10. Is the market size provided in terms of value or volume?
The market size is provided in terms of value, measured in Million.
11. Are there any specific market keywords associated with the report?
Yes, the market keyword associated with the report is "AVAS Market," which aids in identifying and referencing the specific market segment covered.
12. How do I determine which pricing option suits my needs best?
The pricing options vary based on user requirements and access needs. Individual users may opt for single-user licenses, while businesses requiring broader access may choose multi-user or enterprise licenses for cost-effective access to the report.
13. Are there any additional resources or data provided in the AVAS Market report?
While the report offers comprehensive insights, it's advisable to review the specific contents or supplementary materials provided to ascertain if additional resources or data are available.
14. How can I stay updated on further developments or reports in the AVAS Market?
To stay informed about further developments, trends, and reports in the AVAS Market, consider subscribing to industry newsletters, following relevant companies and organizations, or regularly checking reputable industry news sources and publications.
Methodology
Step 1 - Identification of Relevant Samples Size from Population Database


Step 2 - Approaches for Defining Global Market Size (Value, Volume* & Price*)

Note*: In applicable scenarios
Step 3 - Data Sources
Primary Research
- Web Analytics
- Survey Reports
- Research Institute
- Latest Research Reports
- Opinion Leaders
Secondary Research
- Annual Reports
- White Paper
- Latest Press Release
- Industry Association
- Paid Database
- Investor Presentations

Step 4 - Data Triangulation
Involves using different sources of information in order to increase the validity of a study
These sources are likely to be stakeholders in a program - participants, other researchers, program staff, other community members, and so on.
Then we put all data in single framework & apply various statistical tools to find out the dynamic on the market.
During the analysis stage, feedback from the stakeholder groups would be compared to determine areas of agreement as well as areas of divergence
