

Key Insights
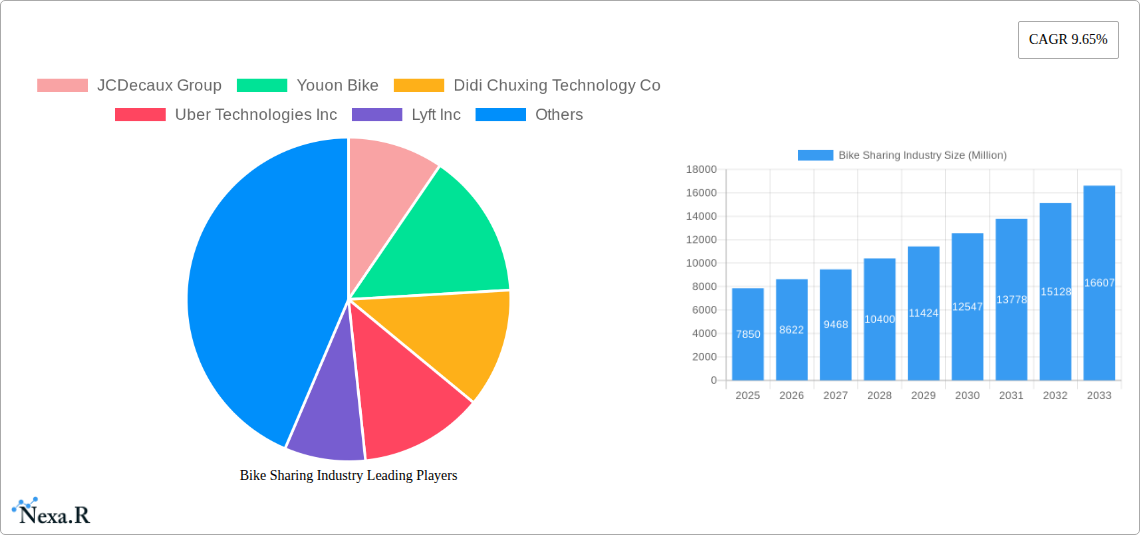
The global bike-sharing market, valued at $7.85 billion in 2025, is projected to experience robust growth, driven by increasing urbanization, rising environmental concerns, and the growing popularity of micromobility solutions. The market's Compound Annual Growth Rate (CAGR) of 9.65% from 2025 to 2033 indicates significant expansion opportunities. Key market drivers include government initiatives promoting sustainable transportation, technological advancements in e-bikes and dockless systems, and the increasing adoption of bike-sharing apps for convenient and cost-effective commuting. Furthermore, the integration of bike-sharing with public transportation networks enhances accessibility and boosts ridership. The market segmentation reveals a dynamic landscape, with e-bikes gaining traction due to their extended range and assistance features, while dockless systems are favored for their convenience and flexibility compared to docked systems. Competition among major players like JCDecaux Group, Didi Chuxing, and Uber further fuels innovation and market expansion.
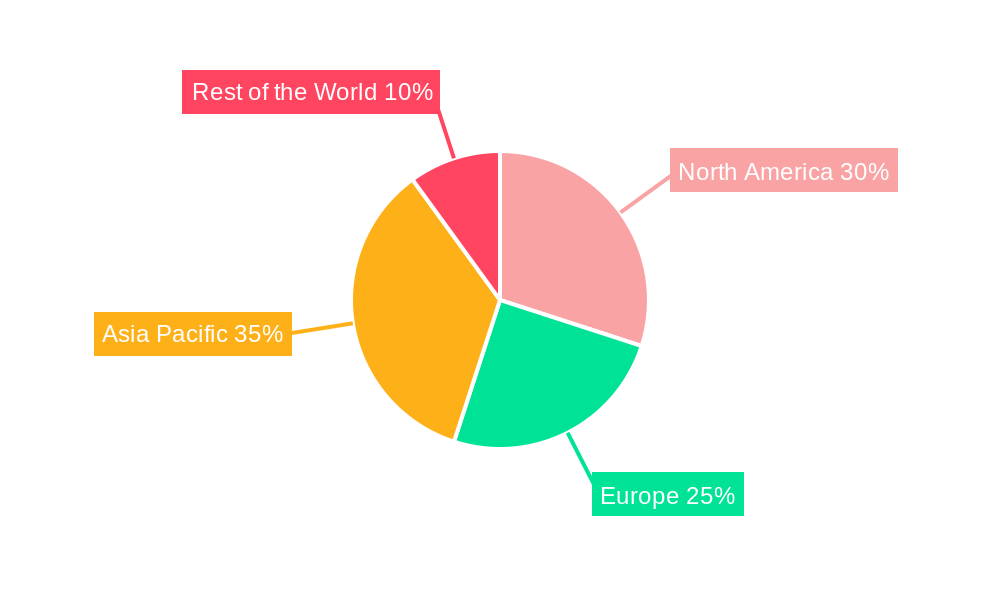
The regional distribution of the bike-sharing market shows variations based on infrastructure development, technological adoption, and government policies. While North America and Europe are established markets, the Asia-Pacific region presents substantial growth potential due to its rapidly expanding urban centers and increasing disposable incomes. Challenges like vandalism, operational costs, and the need for robust regulatory frameworks need to be addressed to ensure the sustainable growth of the bike-sharing industry. However, technological advancements in areas such as smart locking systems, predictive maintenance, and improved data analytics will help overcome these challenges and contribute to a more efficient and sustainable bike-sharing ecosystem. The continuous evolution of the market will likely see further integration with other transportation modes, expansion into smaller cities, and the emergence of innovative business models focusing on subscription services and integrated mobility platforms.
Bike Sharing Industry Market Report: 2019-2033
This comprehensive report provides a detailed analysis of the global bike-sharing market, encompassing historical data (2019-2024), the base year (2025), and a forecast period (2025-2033). It delves into market dynamics, growth trends, key players, and emerging opportunities within the parent market of micro-mobility and its child market of bike sharing. The report utilizes data measured in million units, offering invaluable insights for industry professionals, investors, and strategic decision-makers.
Bike Sharing Industry Market Dynamics & Structure
The bike-sharing market, a significant segment within the broader micro-mobility sector, is characterized by intense competition, rapid technological advancements, and evolving regulatory landscapes. Market concentration is moderate, with several major players vying for market share alongside numerous smaller regional operators. Technological innovation, particularly in e-bike technology and smart-locking systems, is a key driver of growth. Regulatory frameworks vary significantly across geographies, impacting operational costs and expansion strategies. Competitive substitutes include ride-hailing services and public transportation. End-user demographics are shifting towards younger, urban populations, with increasing adoption among environmentally conscious consumers. M&A activity has been notable, with larger players consolidating market share through acquisitions of smaller companies.
- Market Concentration: Moderate, with a few dominant players and many smaller regional operators. The top 5 players account for approximately xx% of the global market (2025).
- Technological Innovation: Key drivers include advancements in e-bike technology, battery life, and smart locking systems. Barriers include high R&D costs and the need for robust infrastructure.
- Regulatory Frameworks: Vary significantly across countries, impacting operational permits, safety standards, and pricing regulations.
- Competitive Substitutes: Ride-hailing services, public transportation, and personal vehicles pose a competitive threat.
- End-User Demographics: Primarily young, urban adults with a strong environmental awareness.
- M&A Trends: Consolidation is evident, with xx major M&A deals recorded between 2019 and 2024 (value: xx Million USD).
Bike Sharing Industry Growth Trends & Insights
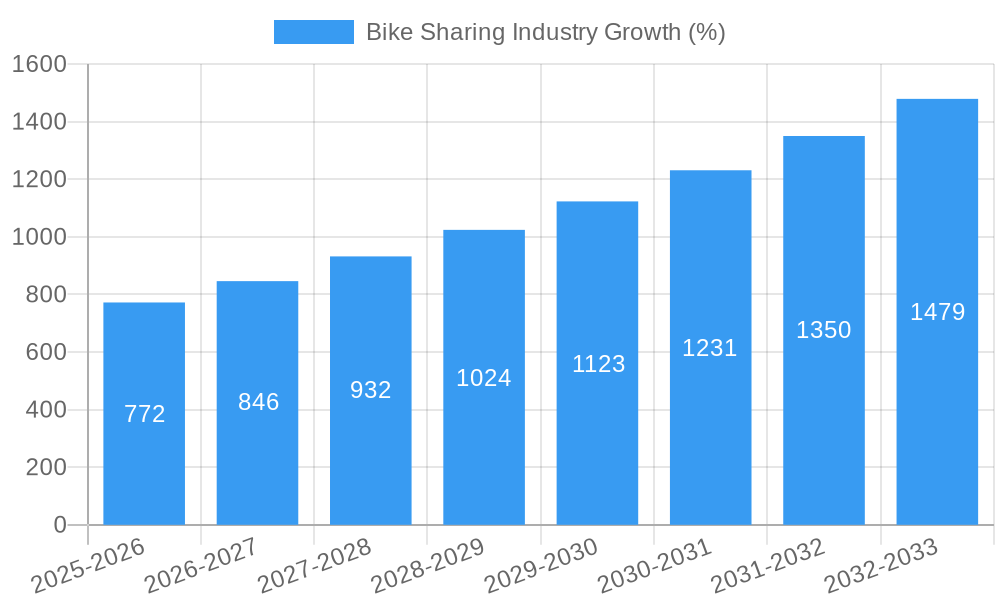
The bike-sharing market experienced significant growth between 2019 and 2024, driven by urbanization, increasing environmental concerns, and the convenience offered by mobile app-based systems. The market size reached xx million units in 2024 and is projected to reach xx million units by 2033, representing a CAGR of xx% during the forecast period. This growth is being fueled by technological disruptions, such as the rise of e-bikes and dockless systems, as well as shifting consumer behavior towards shared mobility solutions. Market penetration is highest in major urban centers, with ongoing expansion into suburban and smaller cities.
- Market Size (million units): 2019 (xx), 2024 (xx), 2025 (xx), 2033 (xx).
- CAGR (2025-2033): xx%
- Market Penetration: Highest in major urban areas, with continued expansion into secondary cities.
- Technological Disruptions: E-bike adoption and dockless systems are key drivers.
- Consumer Behavior Shifts: Increased preference for sustainable and convenient transportation options.
Dominant Regions, Countries, or Segments in Bike Sharing Industry
The Asia-Pacific region currently holds the largest market share in the bike-sharing industry, driven by high population density in urban areas, supportive government policies, and the rapid adoption of e-bikes. Within this region, China and India are key growth markets. The e-bike segment exhibits faster growth than traditional bikes, due to increased range and convenience. Dockless systems dominate in many areas due to their flexibility and reduced infrastructure costs.
- Leading Region: Asia-Pacific (market share: xx% in 2025)
- Key Countries: China, India, United States
- Fastest-Growing Segment: E-bikes
- Dominant Sharing System: Dockless (market share: xx% in 2025)
- Key Drivers: Government initiatives promoting sustainable transportation, increasing urbanization, and improving infrastructure.
Bike Sharing Industry Product Landscape
The bike-sharing industry offers a diverse range of products, including traditional bicycles and e-bikes, with varying features such as integrated GPS tracking, smart locks, and mobile app integration. E-bikes are increasingly popular due to their extended range and ability to tackle hills, catering to diverse demographics and usage patterns. Innovations focus on enhanced safety features, durable materials, and improved battery technology. Performance metrics such as battery range, speed, and durability are key differentiators. Unique selling propositions often emphasize convenience, affordability, and environmental friendliness.
Key Drivers, Barriers & Challenges in Bike Sharing Industry
Key Drivers:
- Growing urbanization and traffic congestion.
- Increasing environmental awareness and the need for sustainable transportation solutions.
- Government incentives and subsidies for bike-sharing programs.
- Technological advancements (e.g., e-bikes, GPS tracking).
Key Challenges and Restraints:
- High initial investment costs for infrastructure and fleet acquisition.
- Vandalism and theft of bikes, impacting operational costs and profitability.
- Competition from other transportation modes (ride-sharing, public transit).
- Regulatory hurdles and variations across different jurisdictions. Supply chain disruptions have led to xx% increase in operating costs in the last year (2024).
Emerging Opportunities in Bike Sharing Industry
- Expansion into untapped markets: Smaller cities and suburban areas offer significant growth potential.
- Integration with other mobility services: Creating seamless connections with public transport and ride-sharing apps.
- Development of specialized bike-sharing models: Cargo bikes for delivery services and adaptive bikes for people with disabilities.
- Leveraging data analytics: Optimizing fleet management, pricing strategies, and user experience.
Growth Accelerators in the Bike Sharing Industry
Technological advancements, such as improved battery technology for e-bikes and advanced smart locking systems, are significant growth accelerators. Strategic partnerships with cities and businesses to integrate bike-sharing into wider urban transportation planning are crucial. Expansion into new geographic markets and the development of innovative services (e.g., subscription models, corporate programs) will further fuel market growth.
Key Players Shaping the Bike Sharing Industry Market
- JCDecaux Group
- Youon Bike
- Didi Chuxing Technology Co
- Uber Technologies Inc
- Lyft Inc
- Bluegogo
- Hellobike
- Meituan Bik
- Bird Rides Inc
- Neutron Holdings Inc
Notable Milestones in Bike Sharing Industry Sector
- March 2023: MYBYK launched two electric bicycle variants, impacting the e-bike segment.
- March 2023: Brighton and Hove announced a new bike-sharing scheme with Beryl, expanding market reach in the UK.
- December 2023: USD 23 million investment in Tembici to expand bike-sharing services in Latin America.
In-Depth Bike Sharing Industry Market Outlook
The bike-sharing market is poised for continued growth, driven by technological innovation, supportive government policies, and evolving consumer preferences. Strategic partnerships, expansion into untapped markets, and the development of innovative business models will be key to unlocking future market potential. The increasing adoption of e-bikes and the integration of bike-sharing into broader mobility ecosystems will further shape the industry landscape in the coming years. Opportunities exist for companies to differentiate themselves through enhanced user experience, sustainable practices, and data-driven optimization.
Bike Sharing Industry Segmentation
-
1. Bike
- 1.1. Traditional/Regular Bike
- 1.2. E-bike
-
2. Sharing System
- 2.1. Docked
- 2.2. Dockless
Bike Sharing Industry Segmentation By Geography
- 1. North America
- 2. Europe
- 3. Asia Pacific
- 4. Rest of the World
Bike Sharing Industry REPORT HIGHLIGHTS
| Aspects | Details |
|---|---|
| Study Period | 2019-2033 |
| Base Year | 2024 |
| Estimated Year | 2025 |
| Forecast Period | 2025-2033 |
| Historical Period | 2019-2024 |
| Growth Rate | CAGR of 9.65% from 2019-2033 |
| Segmentation |
|
Table of Contents
- 1. Introduction
- 1.1. Research Scope
- 1.2. Market Segmentation
- 1.3. Research Methodology
- 1.4. Definitions and Assumptions
- 2. Executive Summary
- 2.1. Introduction
- 3. Market Dynamics
- 3.1. Introduction
- 3.2. Market Drivers
- 3.2.1. Increasing Inclusion of E-bikes in the Sharing Fleet
- 3.3. Market Restrains
- 3.3.1. Limited Infrastructure May Hinder Market Growth
- 3.4. Market Trends
- 3.4.1. E-bike Segment Expected to be the Fastest-growing Segment Over the Forecast Period
- 4. Market Factor Analysis
- 4.1. Porters Five Forces
- 4.2. Supply/Value Chain
- 4.3. PESTEL analysis
- 4.4. Market Entropy
- 4.5. Patent/Trademark Analysis
- 5. Global Bike Sharing Industry Analysis, Insights and Forecast, 2019-2031
- 5.1. Market Analysis, Insights and Forecast - by Bike
- 5.1.1. Traditional/Regular Bike
- 5.1.2. E-bike
- 5.2. Market Analysis, Insights and Forecast - by Sharing System
- 5.2.1. Docked
- 5.2.2. Dockless
- 5.3. Market Analysis, Insights and Forecast - by Region
- 5.3.1. North America
- 5.3.2. Europe
- 5.3.3. Asia Pacific
- 5.3.4. Rest of the World
- 5.1. Market Analysis, Insights and Forecast - by Bike
- 6. North America Bike Sharing Industry Analysis, Insights and Forecast, 2019-2031
- 6.1. Market Analysis, Insights and Forecast - by Bike
- 6.1.1. Traditional/Regular Bike
- 6.1.2. E-bike
- 6.2. Market Analysis, Insights and Forecast - by Sharing System
- 6.2.1. Docked
- 6.2.2. Dockless
- 6.1. Market Analysis, Insights and Forecast - by Bike
- 7. Europe Bike Sharing Industry Analysis, Insights and Forecast, 2019-2031
- 7.1. Market Analysis, Insights and Forecast - by Bike
- 7.1.1. Traditional/Regular Bike
- 7.1.2. E-bike
- 7.2. Market Analysis, Insights and Forecast - by Sharing System
- 7.2.1. Docked
- 7.2.2. Dockless
- 7.1. Market Analysis, Insights and Forecast - by Bike
- 8. Asia Pacific Bike Sharing Industry Analysis, Insights and Forecast, 2019-2031
- 8.1. Market Analysis, Insights and Forecast - by Bike
- 8.1.1. Traditional/Regular Bike
- 8.1.2. E-bike
- 8.2. Market Analysis, Insights and Forecast - by Sharing System
- 8.2.1. Docked
- 8.2.2. Dockless
- 8.1. Market Analysis, Insights and Forecast - by Bike
- 9. Rest of the World Bike Sharing Industry Analysis, Insights and Forecast, 2019-2031
- 9.1. Market Analysis, Insights and Forecast - by Bike
- 9.1.1. Traditional/Regular Bike
- 9.1.2. E-bike
- 9.2. Market Analysis, Insights and Forecast - by Sharing System
- 9.2.1. Docked
- 9.2.2. Dockless
- 9.1. Market Analysis, Insights and Forecast - by Bike
- 10. North America Bike Sharing Industry Analysis, Insights and Forecast, 2019-2031
- 10.1. Market Analysis, Insights and Forecast - By Country/Sub-region
- 10.1.1.
- 11. Europe Bike Sharing Industry Analysis, Insights and Forecast, 2019-2031
- 11.1. Market Analysis, Insights and Forecast - By Country/Sub-region
- 11.1.1.
- 12. Asia Pacific Bike Sharing Industry Analysis, Insights and Forecast, 2019-2031
- 12.1. Market Analysis, Insights and Forecast - By Country/Sub-region
- 12.1.1.
- 13. Rest of the World Bike Sharing Industry Analysis, Insights and Forecast, 2019-2031
- 13.1. Market Analysis, Insights and Forecast - By Country/Sub-region
- 13.1.1.
- 14. Competitive Analysis
- 14.1. Global Market Share Analysis 2024
- 14.2. Company Profiles
- 14.2.1 JCDecaux Group
- 14.2.1.1. Overview
- 14.2.1.2. Products
- 14.2.1.3. SWOT Analysis
- 14.2.1.4. Recent Developments
- 14.2.1.5. Financials (Based on Availability)
- 14.2.2 Youon Bike
- 14.2.2.1. Overview
- 14.2.2.2. Products
- 14.2.2.3. SWOT Analysis
- 14.2.2.4. Recent Developments
- 14.2.2.5. Financials (Based on Availability)
- 14.2.3 Didi Chuxing Technology Co
- 14.2.3.1. Overview
- 14.2.3.2. Products
- 14.2.3.3. SWOT Analysis
- 14.2.3.4. Recent Developments
- 14.2.3.5. Financials (Based on Availability)
- 14.2.4 Uber Technologies Inc
- 14.2.4.1. Overview
- 14.2.4.2. Products
- 14.2.4.3. SWOT Analysis
- 14.2.4.4. Recent Developments
- 14.2.4.5. Financials (Based on Availability)
- 14.2.5 Lyft Inc
- 14.2.5.1. Overview
- 14.2.5.2. Products
- 14.2.5.3. SWOT Analysis
- 14.2.5.4. Recent Developments
- 14.2.5.5. Financials (Based on Availability)
- 14.2.6 Bluegogo
- 14.2.6.1. Overview
- 14.2.6.2. Products
- 14.2.6.3. SWOT Analysis
- 14.2.6.4. Recent Developments
- 14.2.6.5. Financials (Based on Availability)
- 14.2.7 Hellobike
- 14.2.7.1. Overview
- 14.2.7.2. Products
- 14.2.7.3. SWOT Analysis
- 14.2.7.4. Recent Developments
- 14.2.7.5. Financials (Based on Availability)
- 14.2.8 Meituan Bik
- 14.2.8.1. Overview
- 14.2.8.2. Products
- 14.2.8.3. SWOT Analysis
- 14.2.8.4. Recent Developments
- 14.2.8.5. Financials (Based on Availability)
- 14.2.9 Bird Rides Inc
- 14.2.9.1. Overview
- 14.2.9.2. Products
- 14.2.9.3. SWOT Analysis
- 14.2.9.4. Recent Developments
- 14.2.9.5. Financials (Based on Availability)
- 14.2.10 Neutron Holdings Inc
- 14.2.10.1. Overview
- 14.2.10.2. Products
- 14.2.10.3. SWOT Analysis
- 14.2.10.4. Recent Developments
- 14.2.10.5. Financials (Based on Availability)
- 14.2.1 JCDecaux Group
List of Figures
- Figure 1: Global Bike Sharing Industry Revenue Breakdown (Million, %) by Region 2024 & 2032
- Figure 2: North America Bike Sharing Industry Revenue (Million), by Country 2024 & 2032
- Figure 3: North America Bike Sharing Industry Revenue Share (%), by Country 2024 & 2032
- Figure 4: Europe Bike Sharing Industry Revenue (Million), by Country 2024 & 2032
- Figure 5: Europe Bike Sharing Industry Revenue Share (%), by Country 2024 & 2032
- Figure 6: Asia Pacific Bike Sharing Industry Revenue (Million), by Country 2024 & 2032
- Figure 7: Asia Pacific Bike Sharing Industry Revenue Share (%), by Country 2024 & 2032
- Figure 8: Rest of the World Bike Sharing Industry Revenue (Million), by Country 2024 & 2032
- Figure 9: Rest of the World Bike Sharing Industry Revenue Share (%), by Country 2024 & 2032
- Figure 10: North America Bike Sharing Industry Revenue (Million), by Bike 2024 & 2032
- Figure 11: North America Bike Sharing Industry Revenue Share (%), by Bike 2024 & 2032
- Figure 12: North America Bike Sharing Industry Revenue (Million), by Sharing System 2024 & 2032
- Figure 13: North America Bike Sharing Industry Revenue Share (%), by Sharing System 2024 & 2032
- Figure 14: North America Bike Sharing Industry Revenue (Million), by Country 2024 & 2032
- Figure 15: North America Bike Sharing Industry Revenue Share (%), by Country 2024 & 2032
- Figure 16: Europe Bike Sharing Industry Revenue (Million), by Bike 2024 & 2032
- Figure 17: Europe Bike Sharing Industry Revenue Share (%), by Bike 2024 & 2032
- Figure 18: Europe Bike Sharing Industry Revenue (Million), by Sharing System 2024 & 2032
- Figure 19: Europe Bike Sharing Industry Revenue Share (%), by Sharing System 2024 & 2032
- Figure 20: Europe Bike Sharing Industry Revenue (Million), by Country 2024 & 2032
- Figure 21: Europe Bike Sharing Industry Revenue Share (%), by Country 2024 & 2032
- Figure 22: Asia Pacific Bike Sharing Industry Revenue (Million), by Bike 2024 & 2032
- Figure 23: Asia Pacific Bike Sharing Industry Revenue Share (%), by Bike 2024 & 2032
- Figure 24: Asia Pacific Bike Sharing Industry Revenue (Million), by Sharing System 2024 & 2032
- Figure 25: Asia Pacific Bike Sharing Industry Revenue Share (%), by Sharing System 2024 & 2032
- Figure 26: Asia Pacific Bike Sharing Industry Revenue (Million), by Country 2024 & 2032
- Figure 27: Asia Pacific Bike Sharing Industry Revenue Share (%), by Country 2024 & 2032
- Figure 28: Rest of the World Bike Sharing Industry Revenue (Million), by Bike 2024 & 2032
- Figure 29: Rest of the World Bike Sharing Industry Revenue Share (%), by Bike 2024 & 2032
- Figure 30: Rest of the World Bike Sharing Industry Revenue (Million), by Sharing System 2024 & 2032
- Figure 31: Rest of the World Bike Sharing Industry Revenue Share (%), by Sharing System 2024 & 2032
- Figure 32: Rest of the World Bike Sharing Industry Revenue (Million), by Country 2024 & 2032
- Figure 33: Rest of the World Bike Sharing Industry Revenue Share (%), by Country 2024 & 2032
List of Tables
- Table 1: Global Bike Sharing Industry Revenue Million Forecast, by Region 2019 & 2032
- Table 2: Global Bike Sharing Industry Revenue Million Forecast, by Bike 2019 & 2032
- Table 3: Global Bike Sharing Industry Revenue Million Forecast, by Sharing System 2019 & 2032
- Table 4: Global Bike Sharing Industry Revenue Million Forecast, by Region 2019 & 2032
- Table 5: Global Bike Sharing Industry Revenue Million Forecast, by Country 2019 & 2032
- Table 6: Bike Sharing Industry Revenue (Million) Forecast, by Application 2019 & 2032
- Table 7: Global Bike Sharing Industry Revenue Million Forecast, by Country 2019 & 2032
- Table 8: Bike Sharing Industry Revenue (Million) Forecast, by Application 2019 & 2032
- Table 9: Global Bike Sharing Industry Revenue Million Forecast, by Country 2019 & 2032
- Table 10: Bike Sharing Industry Revenue (Million) Forecast, by Application 2019 & 2032
- Table 11: Global Bike Sharing Industry Revenue Million Forecast, by Country 2019 & 2032
- Table 12: Bike Sharing Industry Revenue (Million) Forecast, by Application 2019 & 2032
- Table 13: Global Bike Sharing Industry Revenue Million Forecast, by Bike 2019 & 2032
- Table 14: Global Bike Sharing Industry Revenue Million Forecast, by Sharing System 2019 & 2032
- Table 15: Global Bike Sharing Industry Revenue Million Forecast, by Country 2019 & 2032
- Table 16: Global Bike Sharing Industry Revenue Million Forecast, by Bike 2019 & 2032
- Table 17: Global Bike Sharing Industry Revenue Million Forecast, by Sharing System 2019 & 2032
- Table 18: Global Bike Sharing Industry Revenue Million Forecast, by Country 2019 & 2032
- Table 19: Global Bike Sharing Industry Revenue Million Forecast, by Bike 2019 & 2032
- Table 20: Global Bike Sharing Industry Revenue Million Forecast, by Sharing System 2019 & 2032
- Table 21: Global Bike Sharing Industry Revenue Million Forecast, by Country 2019 & 2032
- Table 22: Global Bike Sharing Industry Revenue Million Forecast, by Bike 2019 & 2032
- Table 23: Global Bike Sharing Industry Revenue Million Forecast, by Sharing System 2019 & 2032
- Table 24: Global Bike Sharing Industry Revenue Million Forecast, by Country 2019 & 2032
Frequently Asked Questions
1. What is the projected Compound Annual Growth Rate (CAGR) of the Bike Sharing Industry?
The projected CAGR is approximately 9.65%.
2. Which companies are prominent players in the Bike Sharing Industry?
Key companies in the market include JCDecaux Group, Youon Bike, Didi Chuxing Technology Co, Uber Technologies Inc, Lyft Inc, Bluegogo, Hellobike, Meituan Bik, Bird Rides Inc, Neutron Holdings Inc.
3. What are the main segments of the Bike Sharing Industry?
The market segments include Bike, Sharing System.
4. Can you provide details about the market size?
The market size is estimated to be USD 7.85 Million as of 2022.
5. What are some drivers contributing to market growth?
Increasing Inclusion of E-bikes in the Sharing Fleet.
6. What are the notable trends driving market growth?
E-bike Segment Expected to be the Fastest-growing Segment Over the Forecast Period.
7. Are there any restraints impacting market growth?
Limited Infrastructure May Hinder Market Growth.
8. Can you provide examples of recent developments in the market?
December 2023: The US International Development Finance Corporation (DFC) and IDB Invest announced that they were co-investing a combined USD 23 million in equity in micro-mobility platform Tembici to support the expansion of bicycle-sharing services in Latin America.
9. What pricing options are available for accessing the report?
Pricing options include single-user, multi-user, and enterprise licenses priced at USD 4750, USD 5250, and USD 8750 respectively.
10. Is the market size provided in terms of value or volume?
The market size is provided in terms of value, measured in Million.
11. Are there any specific market keywords associated with the report?
Yes, the market keyword associated with the report is "Bike Sharing Industry," which aids in identifying and referencing the specific market segment covered.
12. How do I determine which pricing option suits my needs best?
The pricing options vary based on user requirements and access needs. Individual users may opt for single-user licenses, while businesses requiring broader access may choose multi-user or enterprise licenses for cost-effective access to the report.
13. Are there any additional resources or data provided in the Bike Sharing Industry report?
While the report offers comprehensive insights, it's advisable to review the specific contents or supplementary materials provided to ascertain if additional resources or data are available.
14. How can I stay updated on further developments or reports in the Bike Sharing Industry?
To stay informed about further developments, trends, and reports in the Bike Sharing Industry, consider subscribing to industry newsletters, following relevant companies and organizations, or regularly checking reputable industry news sources and publications.
Methodology
Step 1 - Identification of Relevant Samples Size from Population Database


Step 2 - Approaches for Defining Global Market Size (Value, Volume* & Price*)

Note*: In applicable scenarios
Step 3 - Data Sources
Primary Research
- Web Analytics
- Survey Reports
- Research Institute
- Latest Research Reports
- Opinion Leaders
Secondary Research
- Annual Reports
- White Paper
- Latest Press Release
- Industry Association
- Paid Database
- Investor Presentations

Step 4 - Data Triangulation
Involves using different sources of information in order to increase the validity of a study
These sources are likely to be stakeholders in a program - participants, other researchers, program staff, other community members, and so on.
Then we put all data in single framework & apply various statistical tools to find out the dynamic on the market.
During the analysis stage, feedback from the stakeholder groups would be compared to determine areas of agreement as well as areas of divergence
