

Key Insights
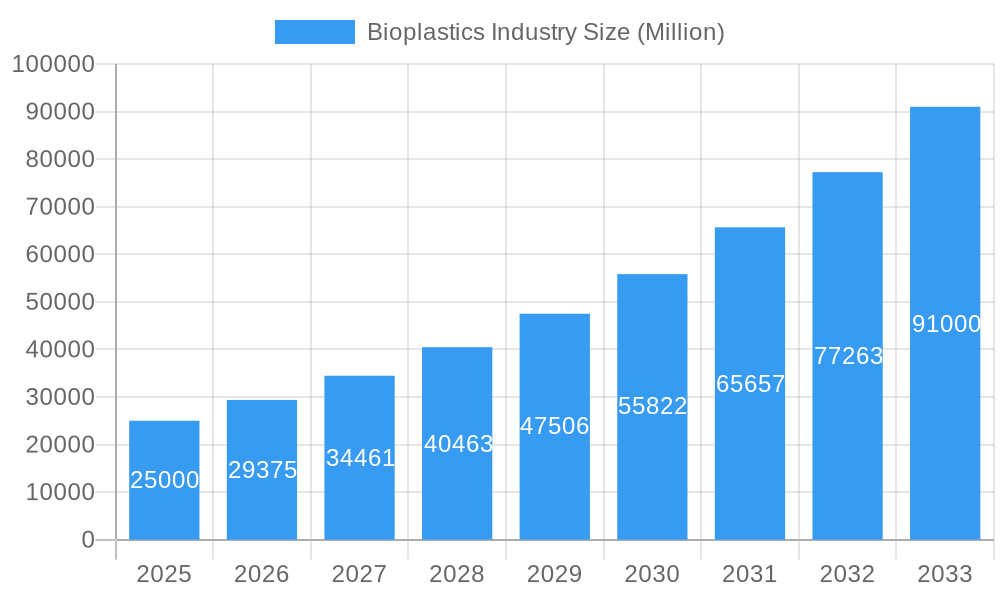
The bioplastics market is experiencing robust growth, driven by increasing environmental concerns and stringent regulations regarding plastic waste. A compound annual growth rate (CAGR) of 17.25% from 2019 to 2024 suggests a significant market expansion. This growth is fueled by rising demand for sustainable packaging solutions across various sectors, including flexible and rigid packaging, automotive, agriculture, and construction. The bio-based biodegradable segment is the primary growth driver, propelled by consumer preference for eco-friendly alternatives and governmental initiatives promoting biodegradable materials. However, higher production costs compared to traditional plastics and the limited availability of cost-effective bio-based feedstock remain significant challenges. The market is segmented by type (bio-based biodegradable and bio-based non-biodegradable) and application, with flexible packaging currently holding a dominant position. Geographically, the Asia-Pacific region, particularly China and India, is expected to witness substantial growth due to rapid industrialization and a growing population. North America and Europe also represent significant markets, driven by strong environmental regulations and consumer awareness. Key players like Trinseo, Novamont SpA, and Arkema are actively investing in research and development to improve bioplastic properties and expand their product portfolios, fostering further market expansion. The projected market size for 2025 is estimated to be approximately $25 billion (assuming a logical extrapolation based on the provided CAGR and current market size estimations) and is poised for continued expansion through 2033.
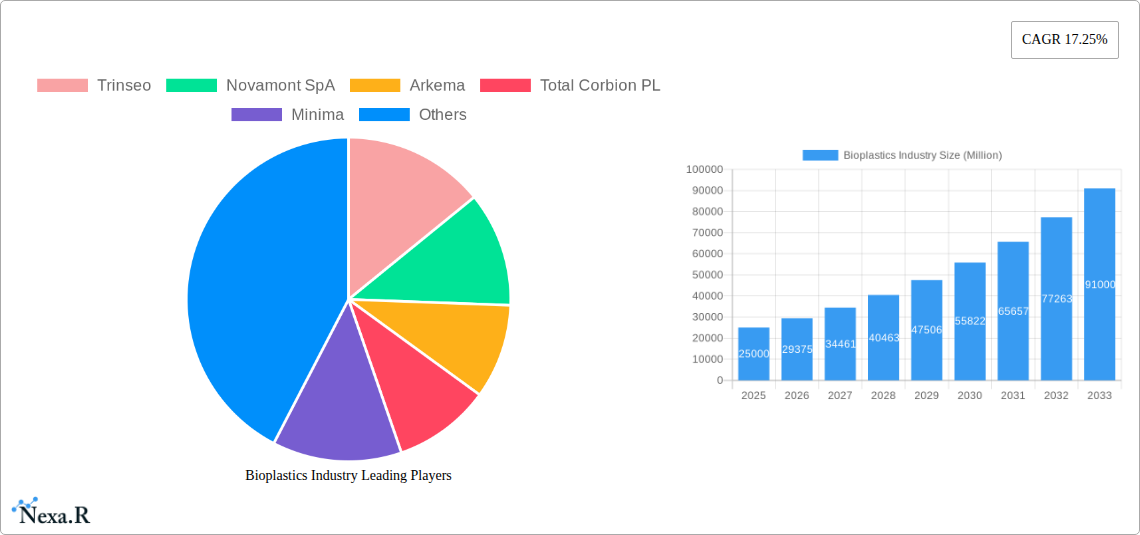
Bioplastics Industry Market Size (In Billion)
The competitive landscape is characterized by both established chemical companies and specialized bioplastics manufacturers. Strategic partnerships, mergers, and acquisitions are expected to increase as companies strive for market share and technological advancements. Future growth will depend on addressing challenges related to cost reduction, scalability, and the development of new bio-based feedstocks with improved performance characteristics. Furthermore, promoting public awareness about the benefits of bioplastics and overcoming consumer misconceptions are crucial for long-term market penetration and sustainable growth. The focus on developing bioplastics suitable for diverse applications, such as high-performance engineering plastics, will also be a key driver of future expansion.
Bioplastics Industry Company Market Share
Bioplastics Industry Market Report: 2019-2033
This comprehensive report provides a detailed analysis of the bioplastics industry, encompassing market dynamics, growth trends, regional dominance, product landscape, key players, and future outlook. With a study period spanning 2019-2033, a base year of 2025, and a forecast period of 2025-2033, this report offers invaluable insights for industry professionals, investors, and strategic decision-makers. The report segments the market by type (Bio-based Biodegradables, Other Bio-based Biodegradables, Bio-based Non-biodegradables) and application (Flexible Packaging, Rigid Packaging, Automotive and Assembly Operations, Agriculture and Horticulture, Construction, Textiles, Electrical and Electronics, Other Applications), providing a granular understanding of market performance across various segments. The global market size is projected to reach xx Million units by 2033.
Bioplastics Industry Market Dynamics & Structure
The bioplastics market is characterized by moderate concentration, with several key players holding significant market share. Technological innovation, driven by advancements in bio-based polymers and processing techniques, is a key growth driver. Stringent environmental regulations and consumer demand for sustainable alternatives are shaping market dynamics. Competitive pressure from traditional plastics remains a challenge, alongside the higher cost of bioplastics compared to conventional materials. Mergers and acquisitions are becoming increasingly prevalent as companies seek to expand their product portfolios and market reach.
- Market Concentration: Moderately concentrated, with the top 10 players holding approximately xx% of the market share in 2024.
- Technological Innovation: Focus on improving biodegradability, performance characteristics, and reducing production costs.
- Regulatory Framework: Increasingly stringent regulations promoting bioplastics adoption and restricting conventional plastics.
- Competitive Substitutes: Traditional petroleum-based plastics remain major competitors.
- End-User Demographics: Growing awareness of environmental concerns among consumers fuels demand.
- M&A Trends: Increased M&A activity as companies seek to expand their market reach and product offerings. xx M&A deals were recorded between 2019 and 2024.
Bioplastics Industry Growth Trends & Insights
The bioplastics market has witnessed significant growth over the historical period (2019-2024), driven by increasing environmental concerns, rising demand for sustainable packaging solutions, and supportive government policies. The market size expanded from xx Million units in 2019 to xx Million units in 2024, exhibiting a CAGR of xx%. This upward trajectory is expected to continue throughout the forecast period (2025-2033), with the market projected to reach xx Million units by 2033, at a CAGR of xx%. Technological advancements in biopolymer production and processing are contributing to cost reductions and improved performance characteristics, further accelerating market adoption. Consumer preference shifts toward eco-friendly products are also bolstering market growth. Specific application segments, particularly flexible and rigid packaging, are experiencing rapid expansion. However, challenges like high production costs and scalability issues are limiting widespread adoption.
Dominant Regions, Countries, or Segments in Bioplastics Industry
The Asia-Pacific region is currently the dominant market for bioplastics, followed by Europe and North America. Growth in the Asia-Pacific region is primarily driven by rapid economic development, increasing industrialization, and rising consumer awareness of environmental sustainability. Within the application segments, flexible packaging holds the largest market share due to its widespread use in the food and beverage industry. Bio-based biodegradable plastics constitute the largest type segment, reflecting a strong preference for environmentally friendly materials.
- Key Drivers:
- Asia-Pacific: Rapid economic growth, rising disposable incomes, and stringent environmental regulations.
- Europe: Strong focus on sustainability initiatives, supportive government policies, and advanced recycling infrastructure.
- North America: Increasing consumer demand for eco-friendly products and growing adoption of bioplastics in various applications.
- Flexible Packaging: High demand from food and beverage industries and widespread use in various consumer goods.
- Bio-based Biodegradables: Strong environmental benefits and growing consumer preference for environmentally friendly alternatives.
Bioplastics Industry Product Landscape
The bioplastics market offers a diverse range of products, including PLA (polylactic acid), PHA (polyhydroxyalkanoates), starch-based bioplastics, and cellulose-based bioplastics. These materials find applications across various sectors, from packaging and agriculture to automotive and textiles. Ongoing innovations focus on enhancing biodegradability, improving mechanical properties, and expanding applications. Key selling propositions include biodegradability, compostability, renewability, and reduced carbon footprint. Recent technological advancements include the development of bioplastics with enhanced barrier properties and improved heat resistance.
Key Drivers, Barriers & Challenges in Bioplastics Industry
Key Drivers:
- Increasing environmental awareness and stringent regulations related to plastic waste.
- Growing demand for sustainable and eco-friendly packaging solutions.
- Technological advancements leading to cost reductions and improved performance of bioplastics.
- Government incentives and support for the bioplastics industry.
Challenges:
- High production costs compared to conventional plastics limiting widespread adoption.
- Scalability issues in production hindering mass market penetration.
- Lack of standardized testing and certification for biodegradability and compostability.
- Competition from traditional plastics and other sustainable alternatives. The high cost of bioplastics compared to traditional plastics is hindering adoption, estimated to add xx% to the final product cost.
Emerging Opportunities in Bioplastics Industry
- Expansion into new and untapped markets, particularly in developing economies.
- Development of innovative applications, such as biodegradable medical implants and agricultural films.
- Growing demand for bioplastics in specialized applications, such as electronics and automotive components.
- Emergence of new bio-based polymers with improved properties and functionalities.
Growth Accelerators in the Bioplastics Industry Industry
Technological breakthroughs in biopolymer production and processing are pivotal in reducing costs and improving performance. Strategic partnerships between bioplastics producers, packaging companies, and brand owners are facilitating wider adoption. Market expansion strategies focusing on emerging economies with significant growth potential are driving long-term growth. Investment in research and development is crucial for bringing innovations to market.
Key Players Shaping the Bioplastics Industry Market
- Trinseo
- Novamont SpA
- Arkema
- Total Corbion PLA
- Minima
- Futerro
- Rodenburg Biopolymers
- Braskem
- Indorama Ventures Public Company Limited
- Natureworks LLC
- BIOTEC
- Danimer Scientific
- BASF SE
Notable Milestones in Bioplastics Industry Sector
- March 2022: ABB technology automates NatureWorks' new bioplastics plant in Thailand, boosting production to 75,000 tons of Ingeo PLA per year.
- April 2022: Trinseo launches MAGNUM BIO ABS for automotive applications, expanding its sustainable portfolio.
- August 2022: BASF Venture Capital GmbH and Aqua-Spark invest in Sea6 Energy Pvt. Ltd., focusing on red seaweed-based bioplastics and biofuels.
In-Depth Bioplastics Industry Market Outlook
The bioplastics industry is poised for robust growth in the coming years, driven by several factors. Continued technological advancements, particularly in biodegradability and performance characteristics, will lead to wider adoption. Strategic partnerships and increased investment in R&D will fuel innovation and market expansion. Growing regulatory pressure favoring sustainable materials and increasing consumer demand for eco-friendly products will further propel market growth. The long-term outlook remains positive, with significant opportunities for companies to capitalize on the growing demand for sustainable alternatives to traditional plastics.
Bioplastics Industry Segmentation
-
1. Type
-
1.1. Bio-based Biodegradables
- 1.1.1. Starch-based
- 1.1.2. Polylactic Acid (PLA)
- 1.1.3. Polyhydroxy Alkanoates (PHA)
- 1.1.4. Polyesters (PBS, PBAT, and PCL)
- 1.1.5. Other Bio-based Biodegradables
-
1.2. Bio-based Non-biodegradables
- 1.2.1. Bio Polyethylene Terephthalate (PET)
- 1.2.2. Bio Polyamides
- 1.2.3. Bio Polytrimethylene Terephthalate
- 1.2.4. Other Non-biodegradables
-
1.1. Bio-based Biodegradables
-
2. Application
- 2.1. Flexible Packaging
- 2.2. Rigid Packaging
- 2.3. Automotive and Assembly Operations
- 2.4. Agriculture and Horticulture
- 2.5. Construction
- 2.6. Textiles
- 2.7. Electrical and Electronics
- 2.8. Other Applications
Bioplastics Industry Segmentation By Geography
-
1. Asia Pacific
- 1.1. China
- 1.2. India
- 1.3. Japan
- 1.4. South Korea
- 1.5. Rest of Asia Pacific
-
2. North America
- 2.1. United States
- 2.2. Canada
- 2.3. Mexico
-
3. Europe
- 3.1. Germany
- 3.2. United Kingdom
- 3.3. Italy
- 3.4. France
- 3.5. Rest of Europe
-
4. South America
- 4.1. Brazil
- 4.2. Argentina
- 4.3. Rest of South America
-
5. Middle East and Africa
- 5.1. Saudi Arabia
- 5.2. South Africa
- 5.3. Rest of Middle East and Africa
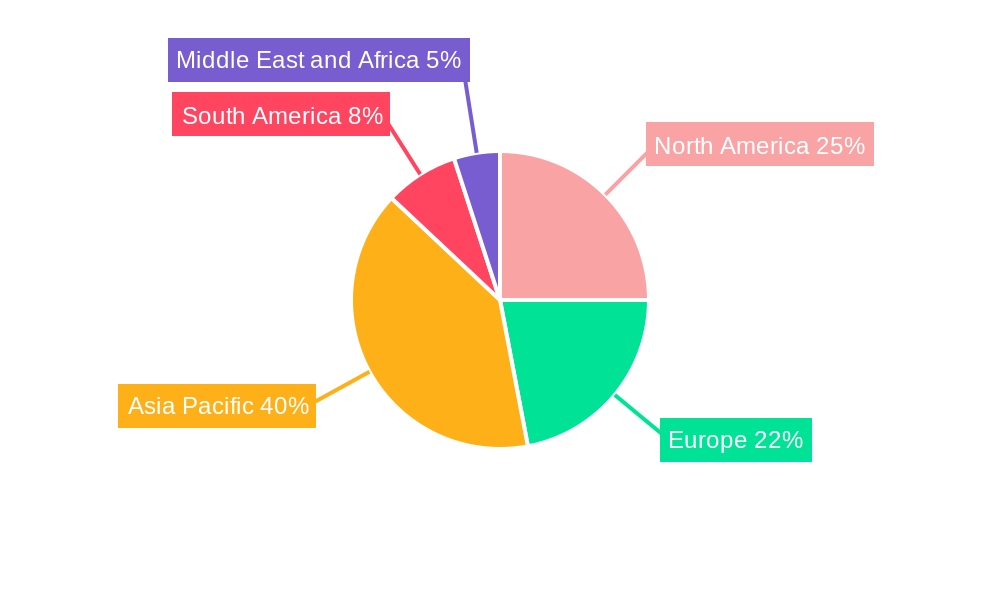
Bioplastics Industry Regional Market Share
Geographic Coverage of Bioplastics Industry
Bioplastics Industry REPORT HIGHLIGHTS
| Aspects | Details |
|---|---|
| Study Period | 2020-2034 |
| Base Year | 2025 |
| Estimated Year | 2026 |
| Forecast Period | 2026-2034 |
| Historical Period | 2020-2025 |
| Growth Rate | CAGR of 17.6% from 2020-2034 |
| Segmentation |
|
Table of Contents
- 1. Introduction
- 1.1. Research Scope
- 1.2. Market Segmentation
- 1.3. Research Objective
- 1.4. Definitions and Assumptions
- 2. Executive Summary
- 2.1. Market Snapshot
- 3. Market Dynamics
- 3.1. Market Drivers
- 3.2. Market Restrains
- 3.3. Market Trends
- 3.4. Market Opportunities
- 4. Market Factor Analysis
- 4.1. Porters Five Forces
- 4.1.1. Bargaining Power of Suppliers
- 4.1.2. Bargaining Power of Buyers
- 4.1.3. Threat of New Entrants
- 4.1.4. Threat of Substitutes
- 4.1.5. Competitive Rivalry
- 4.2. PESTEL analysis
- 4.3. BCG Analysis
- 4.3.1. Stars (High Growth, High Market Share)
- 4.3.2. Cash Cows (Low Growth, High Market Share)
- 4.3.3. Question Mark (High Growth, Low Market Share)
- 4.3.4. Dogs (Low Growth, Low Market Share)
- 4.4. Ansoff Matrix Analysis
- 4.5. Supply Chain Analysis
- 4.6. Regulatory Landscape
- 4.7. Current Market Potential and Opportunity Assessment (TAM–SAM–SOM Framework)
- 4.8. NRP Analyst Note
- 4.1. Porters Five Forces
- 5. Market Analysis, Insights and Forecast 2021-2033
- 5.1. Market Analysis, Insights and Forecast - by Type
- 5.1.1. Bio-based Biodegradables
- 5.1.1.1. Starch-based
- 5.1.1.2. Polylactic Acid (PLA)
- 5.1.1.3. Polyhydroxy Alkanoates (PHA)
- 5.1.1.4. Polyesters (PBS, PBAT, and PCL)
- 5.1.1.5. Other Bio-based Biodegradables
- 5.1.2. Bio-based Non-biodegradables
- 5.1.2.1. Bio Polyethylene Terephthalate (PET)
- 5.1.2.2. Bio Polyamides
- 5.1.2.3. Bio Polytrimethylene Terephthalate
- 5.1.2.4. Other Non-biodegradables
- 5.1.1. Bio-based Biodegradables
- 5.2. Market Analysis, Insights and Forecast - by Application
- 5.2.1. Flexible Packaging
- 5.2.2. Rigid Packaging
- 5.2.3. Automotive and Assembly Operations
- 5.2.4. Agriculture and Horticulture
- 5.2.5. Construction
- 5.2.6. Textiles
- 5.2.7. Electrical and Electronics
- 5.2.8. Other Applications
- 5.3. Market Analysis, Insights and Forecast - by Region
- 5.3.1. Asia Pacific
- 5.3.2. North America
- 5.3.3. Europe
- 5.3.4. South America
- 5.3.5. Middle East and Africa
- 5.1. Market Analysis, Insights and Forecast - by Type
- 6. Global Bioplastics Industry Analysis, Insights and Forecast, 2021-2033
- 6.1. Market Analysis, Insights and Forecast - by Type
- 6.1.1. Bio-based Biodegradables
- 6.1.1.1. Starch-based
- 6.1.1.2. Polylactic Acid (PLA)
- 6.1.1.3. Polyhydroxy Alkanoates (PHA)
- 6.1.1.4. Polyesters (PBS, PBAT, and PCL)
- 6.1.1.5. Other Bio-based Biodegradables
- 6.1.2. Bio-based Non-biodegradables
- 6.1.2.1. Bio Polyethylene Terephthalate (PET)
- 6.1.2.2. Bio Polyamides
- 6.1.2.3. Bio Polytrimethylene Terephthalate
- 6.1.2.4. Other Non-biodegradables
- 6.1.1. Bio-based Biodegradables
- 6.2. Market Analysis, Insights and Forecast - by Application
- 6.2.1. Flexible Packaging
- 6.2.2. Rigid Packaging
- 6.2.3. Automotive and Assembly Operations
- 6.2.4. Agriculture and Horticulture
- 6.2.5. Construction
- 6.2.6. Textiles
- 6.2.7. Electrical and Electronics
- 6.2.8. Other Applications
- 6.1. Market Analysis, Insights and Forecast - by Type
- 7. Asia Pacific Bioplastics Industry Analysis, Insights and Forecast, 2020-2032
- 7.1. Market Analysis, Insights and Forecast - by Type
- 7.1.1. Bio-based Biodegradables
- 7.1.1.1. Starch-based
- 7.1.1.2. Polylactic Acid (PLA)
- 7.1.1.3. Polyhydroxy Alkanoates (PHA)
- 7.1.1.4. Polyesters (PBS, PBAT, and PCL)
- 7.1.1.5. Other Bio-based Biodegradables
- 7.1.2. Bio-based Non-biodegradables
- 7.1.2.1. Bio Polyethylene Terephthalate (PET)
- 7.1.2.2. Bio Polyamides
- 7.1.2.3. Bio Polytrimethylene Terephthalate
- 7.1.2.4. Other Non-biodegradables
- 7.1.1. Bio-based Biodegradables
- 7.2. Market Analysis, Insights and Forecast - by Application
- 7.2.1. Flexible Packaging
- 7.2.2. Rigid Packaging
- 7.2.3. Automotive and Assembly Operations
- 7.2.4. Agriculture and Horticulture
- 7.2.5. Construction
- 7.2.6. Textiles
- 7.2.7. Electrical and Electronics
- 7.2.8. Other Applications
- 7.1. Market Analysis, Insights and Forecast - by Type
- 8. North America Bioplastics Industry Analysis, Insights and Forecast, 2020-2032
- 8.1. Market Analysis, Insights and Forecast - by Type
- 8.1.1. Bio-based Biodegradables
- 8.1.1.1. Starch-based
- 8.1.1.2. Polylactic Acid (PLA)
- 8.1.1.3. Polyhydroxy Alkanoates (PHA)
- 8.1.1.4. Polyesters (PBS, PBAT, and PCL)
- 8.1.1.5. Other Bio-based Biodegradables
- 8.1.2. Bio-based Non-biodegradables
- 8.1.2.1. Bio Polyethylene Terephthalate (PET)
- 8.1.2.2. Bio Polyamides
- 8.1.2.3. Bio Polytrimethylene Terephthalate
- 8.1.2.4. Other Non-biodegradables
- 8.1.1. Bio-based Biodegradables
- 8.2. Market Analysis, Insights and Forecast - by Application
- 8.2.1. Flexible Packaging
- 8.2.2. Rigid Packaging
- 8.2.3. Automotive and Assembly Operations
- 8.2.4. Agriculture and Horticulture
- 8.2.5. Construction
- 8.2.6. Textiles
- 8.2.7. Electrical and Electronics
- 8.2.8. Other Applications
- 8.1. Market Analysis, Insights and Forecast - by Type
- 9. Europe Bioplastics Industry Analysis, Insights and Forecast, 2020-2032
- 9.1. Market Analysis, Insights and Forecast - by Type
- 9.1.1. Bio-based Biodegradables
- 9.1.1.1. Starch-based
- 9.1.1.2. Polylactic Acid (PLA)
- 9.1.1.3. Polyhydroxy Alkanoates (PHA)
- 9.1.1.4. Polyesters (PBS, PBAT, and PCL)
- 9.1.1.5. Other Bio-based Biodegradables
- 9.1.2. Bio-based Non-biodegradables
- 9.1.2.1. Bio Polyethylene Terephthalate (PET)
- 9.1.2.2. Bio Polyamides
- 9.1.2.3. Bio Polytrimethylene Terephthalate
- 9.1.2.4. Other Non-biodegradables
- 9.1.1. Bio-based Biodegradables
- 9.2. Market Analysis, Insights and Forecast - by Application
- 9.2.1. Flexible Packaging
- 9.2.2. Rigid Packaging
- 9.2.3. Automotive and Assembly Operations
- 9.2.4. Agriculture and Horticulture
- 9.2.5. Construction
- 9.2.6. Textiles
- 9.2.7. Electrical and Electronics
- 9.2.8. Other Applications
- 9.1. Market Analysis, Insights and Forecast - by Type
- 10. South America Bioplastics Industry Analysis, Insights and Forecast, 2020-2032
- 10.1. Market Analysis, Insights and Forecast - by Type
- 10.1.1. Bio-based Biodegradables
- 10.1.1.1. Starch-based
- 10.1.1.2. Polylactic Acid (PLA)
- 10.1.1.3. Polyhydroxy Alkanoates (PHA)
- 10.1.1.4. Polyesters (PBS, PBAT, and PCL)
- 10.1.1.5. Other Bio-based Biodegradables
- 10.1.2. Bio-based Non-biodegradables
- 10.1.2.1. Bio Polyethylene Terephthalate (PET)
- 10.1.2.2. Bio Polyamides
- 10.1.2.3. Bio Polytrimethylene Terephthalate
- 10.1.2.4. Other Non-biodegradables
- 10.1.1. Bio-based Biodegradables
- 10.2. Market Analysis, Insights and Forecast - by Application
- 10.2.1. Flexible Packaging
- 10.2.2. Rigid Packaging
- 10.2.3. Automotive and Assembly Operations
- 10.2.4. Agriculture and Horticulture
- 10.2.5. Construction
- 10.2.6. Textiles
- 10.2.7. Electrical and Electronics
- 10.2.8. Other Applications
- 10.1. Market Analysis, Insights and Forecast - by Type
- 11. Middle East and Africa Bioplastics Industry Analysis, Insights and Forecast, 2020-2032
- 11.1. Market Analysis, Insights and Forecast - by Type
- 11.1.1. Bio-based Biodegradables
- 11.1.1.1. Starch-based
- 11.1.1.2. Polylactic Acid (PLA)
- 11.1.1.3. Polyhydroxy Alkanoates (PHA)
- 11.1.1.4. Polyesters (PBS, PBAT, and PCL)
- 11.1.1.5. Other Bio-based Biodegradables
- 11.1.2. Bio-based Non-biodegradables
- 11.1.2.1. Bio Polyethylene Terephthalate (PET)
- 11.1.2.2. Bio Polyamides
- 11.1.2.3. Bio Polytrimethylene Terephthalate
- 11.1.2.4. Other Non-biodegradables
- 11.1.1. Bio-based Biodegradables
- 11.2. Market Analysis, Insights and Forecast - by Application
- 11.2.1. Flexible Packaging
- 11.2.2. Rigid Packaging
- 11.2.3. Automotive and Assembly Operations
- 11.2.4. Agriculture and Horticulture
- 11.2.5. Construction
- 11.2.6. Textiles
- 11.2.7. Electrical and Electronics
- 11.2.8. Other Applications
- 11.1. Market Analysis, Insights and Forecast - by Type
- 12. Competitive Analysis
- 12.1. Company Profiles
- 12.1.1 Trinseo
- 12.1.1.1. Company Overview
- 12.1.1.2. Products
- 12.1.1.3. Company Financials
- 12.1.1.4. SWOT Analysis
- 12.1.2 Novamont SpA
- 12.1.2.1. Company Overview
- 12.1.2.2. Products
- 12.1.2.3. Company Financials
- 12.1.2.4. SWOT Analysis
- 12.1.3 Arkema
- 12.1.3.1. Company Overview
- 12.1.3.2. Products
- 12.1.3.3. Company Financials
- 12.1.3.4. SWOT Analysis
- 12.1.4 Total Corbion PL
- 12.1.4.1. Company Overview
- 12.1.4.2. Products
- 12.1.4.3. Company Financials
- 12.1.4.4. SWOT Analysis
- 12.1.5 Minima
- 12.1.5.1. Company Overview
- 12.1.5.2. Products
- 12.1.5.3. Company Financials
- 12.1.5.4. SWOT Analysis
- 12.1.6 Futerro
- 12.1.6.1. Company Overview
- 12.1.6.2. Products
- 12.1.6.3. Company Financials
- 12.1.6.4. SWOT Analysis
- 12.1.7 Rodenburg Biopolymers
- 12.1.7.1. Company Overview
- 12.1.7.2. Products
- 12.1.7.3. Company Financials
- 12.1.7.4. SWOT Analysis
- 12.1.8 Braskem
- 12.1.8.1. Company Overview
- 12.1.8.2. Products
- 12.1.8.3. Company Financials
- 12.1.8.4. SWOT Analysis
- 12.1.9 Indorama Ventures Public Company Limited
- 12.1.9.1. Company Overview
- 12.1.9.2. Products
- 12.1.9.3. Company Financials
- 12.1.9.4. SWOT Analysis
- 12.1.10 Natureworks LLC
- 12.1.10.1. Company Overview
- 12.1.10.2. Products
- 12.1.10.3. Company Financials
- 12.1.10.4. SWOT Analysis
- 12.1.11 BIOTEC
- 12.1.11.1. Company Overview
- 12.1.11.2. Products
- 12.1.11.3. Company Financials
- 12.1.11.4. SWOT Analysis
- 12.1.12 Danimer Scientific
- 12.1.12.1. Company Overview
- 12.1.12.2. Products
- 12.1.12.3. Company Financials
- 12.1.12.4. SWOT Analysis
- 12.1.13 BASF SE
- 12.1.13.1. Company Overview
- 12.1.13.2. Products
- 12.1.13.3. Company Financials
- 12.1.13.4. SWOT Analysis
- 12.1.1 Trinseo
- 12.2. Market Entropy
- 12.2.1 Company's Key Areas Served
- 12.2.2 Recent Developments
- 12.3. Company Market Share Analysis 2025
- 12.3.1 Top 5 Companies Market Share Analysis
- 12.3.2 Top 3 Companies Market Share Analysis
- 12.4. List of Potential Customers
- 13. Research Methodology
List of Figures
- Figure 1: Global Bioplastics Industry Revenue Breakdown (undefined, %) by Region 2025 & 2033
- Figure 2: Global Bioplastics Industry Volume Breakdown (Million, %) by Region 2025 & 2033
- Figure 3: Asia Pacific Bioplastics Industry Revenue (undefined), by Type 2025 & 2033
- Figure 4: Asia Pacific Bioplastics Industry Volume (Million), by Type 2025 & 2033
- Figure 5: Asia Pacific Bioplastics Industry Revenue Share (%), by Type 2025 & 2033
- Figure 6: Asia Pacific Bioplastics Industry Volume Share (%), by Type 2025 & 2033
- Figure 7: Asia Pacific Bioplastics Industry Revenue (undefined), by Application 2025 & 2033
- Figure 8: Asia Pacific Bioplastics Industry Volume (Million), by Application 2025 & 2033
- Figure 9: Asia Pacific Bioplastics Industry Revenue Share (%), by Application 2025 & 2033
- Figure 10: Asia Pacific Bioplastics Industry Volume Share (%), by Application 2025 & 2033
- Figure 11: Asia Pacific Bioplastics Industry Revenue (undefined), by Country 2025 & 2033
- Figure 12: Asia Pacific Bioplastics Industry Volume (Million), by Country 2025 & 2033
- Figure 13: Asia Pacific Bioplastics Industry Revenue Share (%), by Country 2025 & 2033
- Figure 14: Asia Pacific Bioplastics Industry Volume Share (%), by Country 2025 & 2033
- Figure 15: North America Bioplastics Industry Revenue (undefined), by Type 2025 & 2033
- Figure 16: North America Bioplastics Industry Volume (Million), by Type 2025 & 2033
- Figure 17: North America Bioplastics Industry Revenue Share (%), by Type 2025 & 2033
- Figure 18: North America Bioplastics Industry Volume Share (%), by Type 2025 & 2033
- Figure 19: North America Bioplastics Industry Revenue (undefined), by Application 2025 & 2033
- Figure 20: North America Bioplastics Industry Volume (Million), by Application 2025 & 2033
- Figure 21: North America Bioplastics Industry Revenue Share (%), by Application 2025 & 2033
- Figure 22: North America Bioplastics Industry Volume Share (%), by Application 2025 & 2033
- Figure 23: North America Bioplastics Industry Revenue (undefined), by Country 2025 & 2033
- Figure 24: North America Bioplastics Industry Volume (Million), by Country 2025 & 2033
- Figure 25: North America Bioplastics Industry Revenue Share (%), by Country 2025 & 2033
- Figure 26: North America Bioplastics Industry Volume Share (%), by Country 2025 & 2033
- Figure 27: Europe Bioplastics Industry Revenue (undefined), by Type 2025 & 2033
- Figure 28: Europe Bioplastics Industry Volume (Million), by Type 2025 & 2033
- Figure 29: Europe Bioplastics Industry Revenue Share (%), by Type 2025 & 2033
- Figure 30: Europe Bioplastics Industry Volume Share (%), by Type 2025 & 2033
- Figure 31: Europe Bioplastics Industry Revenue (undefined), by Application 2025 & 2033
- Figure 32: Europe Bioplastics Industry Volume (Million), by Application 2025 & 2033
- Figure 33: Europe Bioplastics Industry Revenue Share (%), by Application 2025 & 2033
- Figure 34: Europe Bioplastics Industry Volume Share (%), by Application 2025 & 2033
- Figure 35: Europe Bioplastics Industry Revenue (undefined), by Country 2025 & 2033
- Figure 36: Europe Bioplastics Industry Volume (Million), by Country 2025 & 2033
- Figure 37: Europe Bioplastics Industry Revenue Share (%), by Country 2025 & 2033
- Figure 38: Europe Bioplastics Industry Volume Share (%), by Country 2025 & 2033
- Figure 39: South America Bioplastics Industry Revenue (undefined), by Type 2025 & 2033
- Figure 40: South America Bioplastics Industry Volume (Million), by Type 2025 & 2033
- Figure 41: South America Bioplastics Industry Revenue Share (%), by Type 2025 & 2033
- Figure 42: South America Bioplastics Industry Volume Share (%), by Type 2025 & 2033
- Figure 43: South America Bioplastics Industry Revenue (undefined), by Application 2025 & 2033
- Figure 44: South America Bioplastics Industry Volume (Million), by Application 2025 & 2033
- Figure 45: South America Bioplastics Industry Revenue Share (%), by Application 2025 & 2033
- Figure 46: South America Bioplastics Industry Volume Share (%), by Application 2025 & 2033
- Figure 47: South America Bioplastics Industry Revenue (undefined), by Country 2025 & 2033
- Figure 48: South America Bioplastics Industry Volume (Million), by Country 2025 & 2033
- Figure 49: South America Bioplastics Industry Revenue Share (%), by Country 2025 & 2033
- Figure 50: South America Bioplastics Industry Volume Share (%), by Country 2025 & 2033
- Figure 51: Middle East and Africa Bioplastics Industry Revenue (undefined), by Type 2025 & 2033
- Figure 52: Middle East and Africa Bioplastics Industry Volume (Million), by Type 2025 & 2033
- Figure 53: Middle East and Africa Bioplastics Industry Revenue Share (%), by Type 2025 & 2033
- Figure 54: Middle East and Africa Bioplastics Industry Volume Share (%), by Type 2025 & 2033
- Figure 55: Middle East and Africa Bioplastics Industry Revenue (undefined), by Application 2025 & 2033
- Figure 56: Middle East and Africa Bioplastics Industry Volume (Million), by Application 2025 & 2033
- Figure 57: Middle East and Africa Bioplastics Industry Revenue Share (%), by Application 2025 & 2033
- Figure 58: Middle East and Africa Bioplastics Industry Volume Share (%), by Application 2025 & 2033
- Figure 59: Middle East and Africa Bioplastics Industry Revenue (undefined), by Country 2025 & 2033
- Figure 60: Middle East and Africa Bioplastics Industry Volume (Million), by Country 2025 & 2033
- Figure 61: Middle East and Africa Bioplastics Industry Revenue Share (%), by Country 2025 & 2033
- Figure 62: Middle East and Africa Bioplastics Industry Volume Share (%), by Country 2025 & 2033
List of Tables
- Table 1: Global Bioplastics Industry Revenue undefined Forecast, by Type 2020 & 2033
- Table 2: Global Bioplastics Industry Volume Million Forecast, by Type 2020 & 2033
- Table 3: Global Bioplastics Industry Revenue undefined Forecast, by Application 2020 & 2033
- Table 4: Global Bioplastics Industry Volume Million Forecast, by Application 2020 & 2033
- Table 5: Global Bioplastics Industry Revenue undefined Forecast, by Region 2020 & 2033
- Table 6: Global Bioplastics Industry Volume Million Forecast, by Region 2020 & 2033
- Table 7: Global Bioplastics Industry Revenue undefined Forecast, by Type 2020 & 2033
- Table 8: Global Bioplastics Industry Volume Million Forecast, by Type 2020 & 2033
- Table 9: Global Bioplastics Industry Revenue undefined Forecast, by Application 2020 & 2033
- Table 10: Global Bioplastics Industry Volume Million Forecast, by Application 2020 & 2033
- Table 11: Global Bioplastics Industry Revenue undefined Forecast, by Country 2020 & 2033
- Table 12: Global Bioplastics Industry Volume Million Forecast, by Country 2020 & 2033
- Table 13: China Bioplastics Industry Revenue (undefined) Forecast, by Application 2020 & 2033
- Table 14: China Bioplastics Industry Volume (Million) Forecast, by Application 2020 & 2033
- Table 15: India Bioplastics Industry Revenue (undefined) Forecast, by Application 2020 & 2033
- Table 16: India Bioplastics Industry Volume (Million) Forecast, by Application 2020 & 2033
- Table 17: Japan Bioplastics Industry Revenue (undefined) Forecast, by Application 2020 & 2033
- Table 18: Japan Bioplastics Industry Volume (Million) Forecast, by Application 2020 & 2033
- Table 19: South Korea Bioplastics Industry Revenue (undefined) Forecast, by Application 2020 & 2033
- Table 20: South Korea Bioplastics Industry Volume (Million) Forecast, by Application 2020 & 2033
- Table 21: Rest of Asia Pacific Bioplastics Industry Revenue (undefined) Forecast, by Application 2020 & 2033
- Table 22: Rest of Asia Pacific Bioplastics Industry Volume (Million) Forecast, by Application 2020 & 2033
- Table 23: Global Bioplastics Industry Revenue undefined Forecast, by Type 2020 & 2033
- Table 24: Global Bioplastics Industry Volume Million Forecast, by Type 2020 & 2033
- Table 25: Global Bioplastics Industry Revenue undefined Forecast, by Application 2020 & 2033
- Table 26: Global Bioplastics Industry Volume Million Forecast, by Application 2020 & 2033
- Table 27: Global Bioplastics Industry Revenue undefined Forecast, by Country 2020 & 2033
- Table 28: Global Bioplastics Industry Volume Million Forecast, by Country 2020 & 2033
- Table 29: United States Bioplastics Industry Revenue (undefined) Forecast, by Application 2020 & 2033
- Table 30: United States Bioplastics Industry Volume (Million) Forecast, by Application 2020 & 2033
- Table 31: Canada Bioplastics Industry Revenue (undefined) Forecast, by Application 2020 & 2033
- Table 32: Canada Bioplastics Industry Volume (Million) Forecast, by Application 2020 & 2033
- Table 33: Mexico Bioplastics Industry Revenue (undefined) Forecast, by Application 2020 & 2033
- Table 34: Mexico Bioplastics Industry Volume (Million) Forecast, by Application 2020 & 2033
- Table 35: Global Bioplastics Industry Revenue undefined Forecast, by Type 2020 & 2033
- Table 36: Global Bioplastics Industry Volume Million Forecast, by Type 2020 & 2033
- Table 37: Global Bioplastics Industry Revenue undefined Forecast, by Application 2020 & 2033
- Table 38: Global Bioplastics Industry Volume Million Forecast, by Application 2020 & 2033
- Table 39: Global Bioplastics Industry Revenue undefined Forecast, by Country 2020 & 2033
- Table 40: Global Bioplastics Industry Volume Million Forecast, by Country 2020 & 2033
- Table 41: Germany Bioplastics Industry Revenue (undefined) Forecast, by Application 2020 & 2033
- Table 42: Germany Bioplastics Industry Volume (Million) Forecast, by Application 2020 & 2033
- Table 43: United Kingdom Bioplastics Industry Revenue (undefined) Forecast, by Application 2020 & 2033
- Table 44: United Kingdom Bioplastics Industry Volume (Million) Forecast, by Application 2020 & 2033
- Table 45: Italy Bioplastics Industry Revenue (undefined) Forecast, by Application 2020 & 2033
- Table 46: Italy Bioplastics Industry Volume (Million) Forecast, by Application 2020 & 2033
- Table 47: France Bioplastics Industry Revenue (undefined) Forecast, by Application 2020 & 2033
- Table 48: France Bioplastics Industry Volume (Million) Forecast, by Application 2020 & 2033
- Table 49: Rest of Europe Bioplastics Industry Revenue (undefined) Forecast, by Application 2020 & 2033
- Table 50: Rest of Europe Bioplastics Industry Volume (Million) Forecast, by Application 2020 & 2033
- Table 51: Global Bioplastics Industry Revenue undefined Forecast, by Type 2020 & 2033
- Table 52: Global Bioplastics Industry Volume Million Forecast, by Type 2020 & 2033
- Table 53: Global Bioplastics Industry Revenue undefined Forecast, by Application 2020 & 2033
- Table 54: Global Bioplastics Industry Volume Million Forecast, by Application 2020 & 2033
- Table 55: Global Bioplastics Industry Revenue undefined Forecast, by Country 2020 & 2033
- Table 56: Global Bioplastics Industry Volume Million Forecast, by Country 2020 & 2033
- Table 57: Brazil Bioplastics Industry Revenue (undefined) Forecast, by Application 2020 & 2033
- Table 58: Brazil Bioplastics Industry Volume (Million) Forecast, by Application 2020 & 2033
- Table 59: Argentina Bioplastics Industry Revenue (undefined) Forecast, by Application 2020 & 2033
- Table 60: Argentina Bioplastics Industry Volume (Million) Forecast, by Application 2020 & 2033
- Table 61: Rest of South America Bioplastics Industry Revenue (undefined) Forecast, by Application 2020 & 2033
- Table 62: Rest of South America Bioplastics Industry Volume (Million) Forecast, by Application 2020 & 2033
- Table 63: Global Bioplastics Industry Revenue undefined Forecast, by Type 2020 & 2033
- Table 64: Global Bioplastics Industry Volume Million Forecast, by Type 2020 & 2033
- Table 65: Global Bioplastics Industry Revenue undefined Forecast, by Application 2020 & 2033
- Table 66: Global Bioplastics Industry Volume Million Forecast, by Application 2020 & 2033
- Table 67: Global Bioplastics Industry Revenue undefined Forecast, by Country 2020 & 2033
- Table 68: Global Bioplastics Industry Volume Million Forecast, by Country 2020 & 2033
- Table 69: Saudi Arabia Bioplastics Industry Revenue (undefined) Forecast, by Application 2020 & 2033
- Table 70: Saudi Arabia Bioplastics Industry Volume (Million) Forecast, by Application 2020 & 2033
- Table 71: South Africa Bioplastics Industry Revenue (undefined) Forecast, by Application 2020 & 2033
- Table 72: South Africa Bioplastics Industry Volume (Million) Forecast, by Application 2020 & 2033
- Table 73: Rest of Middle East and Africa Bioplastics Industry Revenue (undefined) Forecast, by Application 2020 & 2033
- Table 74: Rest of Middle East and Africa Bioplastics Industry Volume (Million) Forecast, by Application 2020 & 2033
Frequently Asked Questions
1. What is the projected Compound Annual Growth Rate (CAGR) of the Bioplastics Industry?
The projected CAGR is approximately 17.6%.
2. Which companies are prominent players in the Bioplastics Industry?
Key companies in the market include Trinseo, Novamont SpA, Arkema, Total Corbion PL, Minima, Futerro, Rodenburg Biopolymers, Braskem, Indorama Ventures Public Company Limited, Natureworks LLC, BIOTEC, Danimer Scientific, BASF SE.
3. What are the main segments of the Bioplastics Industry?
The market segments include Type, Application.
4. Can you provide details about the market size?
The market size is estimated to be USD XXX N/A as of 2022.
5. What are some drivers contributing to market growth?
Environmental Factors Encouraging a Paradigm Shift; Growing Demand for Bioplastics in Packaging.
6. What are the notable trends driving market growth?
Flexible Packaging is Expected to Dominate the Market.
7. Are there any restraints impacting market growth?
Availability of Cheaper Alternatives.
8. Can you provide examples of recent developments in the market?
August 2022: BASF Venture Capital GmbH, the corporate venture company of BASF SE, Germany, and Aqua-Spark, a Dutch investment fund, is investing in Sea6 Energy Pvt. Ltd. Sea6 Energy is a leader in the production and processing of tropical red seaweed. Sea6 Energy is also working on developing bioplastics and biofuels based on red seaweed.
9. What pricing options are available for accessing the report?
Pricing options include single-user, multi-user, and enterprise licenses priced at USD 4750, USD 5250, and USD 8750 respectively.
10. Is the market size provided in terms of value or volume?
The market size is provided in terms of value, measured in N/A and volume, measured in Million.
11. Are there any specific market keywords associated with the report?
Yes, the market keyword associated with the report is "Bioplastics Industry," which aids in identifying and referencing the specific market segment covered.
12. How do I determine which pricing option suits my needs best?
The pricing options vary based on user requirements and access needs. Individual users may opt for single-user licenses, while businesses requiring broader access may choose multi-user or enterprise licenses for cost-effective access to the report.
13. Are there any additional resources or data provided in the Bioplastics Industry report?
While the report offers comprehensive insights, it's advisable to review the specific contents or supplementary materials provided to ascertain if additional resources or data are available.
14. How can I stay updated on further developments or reports in the Bioplastics Industry?
To stay informed about further developments, trends, and reports in the Bioplastics Industry, consider subscribing to industry newsletters, following relevant companies and organizations, or regularly checking reputable industry news sources and publications.
Methodology
Step 1 - Identification of Relevant Samples Size from Population Database


Step 2 - Approaches for Defining Global Market Size (Value, Volume* & Price*)

Note*: In applicable scenarios
Step 3 - Data Sources
Primary Research
- Web Analytics
- Survey Reports
- Research Institute
- Latest Research Reports
- Opinion Leaders
Secondary Research
- Annual Reports
- White Paper
- Latest Press Release
- Industry Association
- Paid Database
- Investor Presentations

Step 4 - Data Triangulation
Involves using different sources of information in order to increase the validity of a study
These sources are likely to be stakeholders in a program - participants, other researchers, program staff, other community members, and so on.
Then we put all data in single framework & apply various statistical tools to find out the dynamic on the market.
During the analysis stage, feedback from the stakeholder groups would be compared to determine areas of agreement as well as areas of divergence