

Key Insights
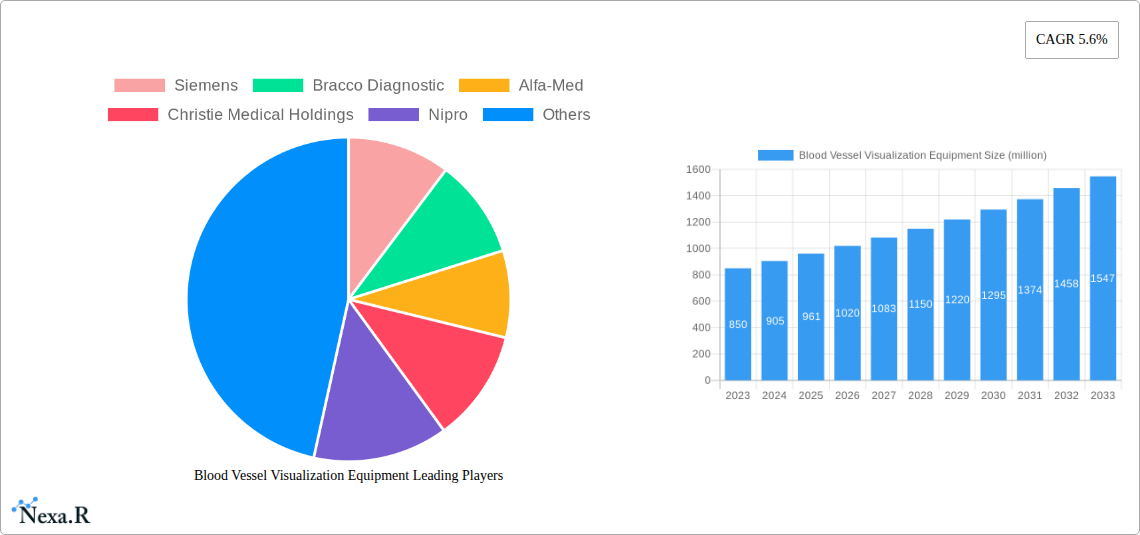
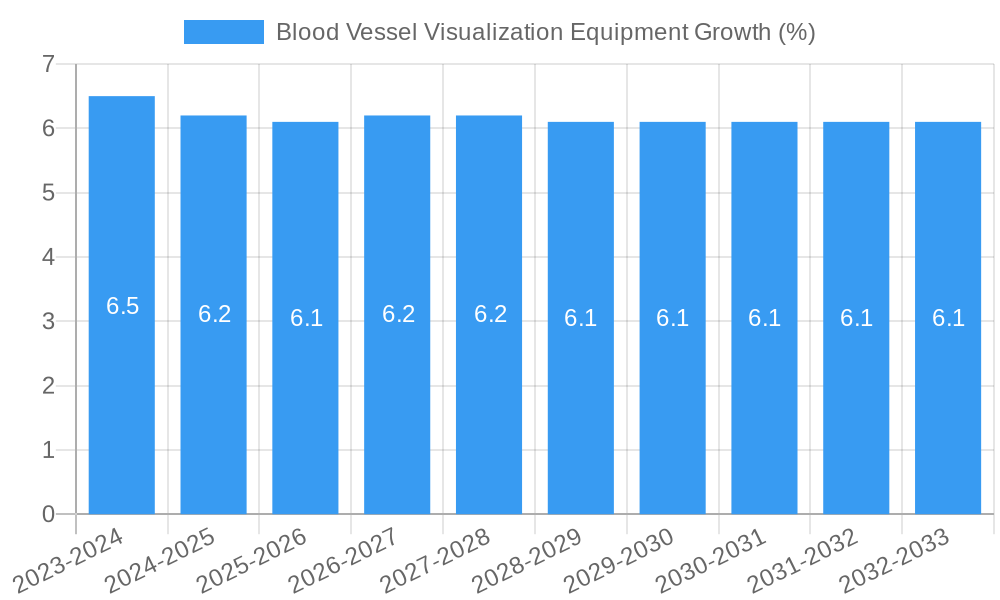
The global Blood Vessel Visualization Equipment market is poised for substantial growth, projected to reach $961 million by 2025 and expand at a Compound Annual Growth Rate (CAGR) of 5.6% through 2033. This expansion is primarily fueled by increasing global prevalence of cardiovascular diseases, advancements in imaging technologies, and a growing demand for minimally invasive diagnostic and therapeutic procedures. Hospitals and diagnostic imaging centers represent the dominant application segments, driven by the need for accurate and early detection of vascular abnormalities. The Ultrasound Imaging segment is expected to lead in terms of market share due to its cost-effectiveness, portability, and non-ionizing radiation properties. However, the growing integration of artificial intelligence and machine learning with Magnetic Resonance Imaging (MRI) and Computed Tomography (CT) is anticipated to create new avenues for advanced visualization and diagnostic precision, contributing to market diversification.
The market's trajectory is further bolstered by an aging global population, leading to a higher incidence of vascular-related conditions like peripheral artery disease and deep vein thrombosis. Technological innovations, including the development of high-resolution imaging devices, real-time visualization capabilities, and sophisticated software for image analysis, are crucial drivers. Emerging economies, particularly in the Asia Pacific region, are exhibiting significant growth potential owing to increasing healthcare expenditure, rising awareness of vascular health, and the expansion of healthcare infrastructure. While the market shows robust growth, potential restraints could include the high initial investment cost for advanced equipment, stringent regulatory approvals, and the need for skilled professionals to operate these sophisticated systems. Nonetheless, the relentless pursuit of improved patient outcomes and enhanced diagnostic accuracy underpins a positive outlook for the Blood Vessel Visualization Equipment market.
Blood Vessel Visualization Equipment Market Report Description
Unlock critical insights into the global Blood Vessel Visualization Equipment market with this comprehensive industry analysis. This report delivers an in-depth understanding of market dynamics, growth trends, and competitive landscapes, empowering stakeholders to make informed strategic decisions. We provide meticulous forecasts and historical analysis, covering the Study Period: 2019–2033, with a Base Year: 2025 and Forecast Period: 2025–2033, including a detailed analysis of the Historical Period: 2019–2024. This report is meticulously designed for medical device manufacturers, diagnostic imaging providers, healthcare institutions, investors, and researchers seeking to capitalize on the burgeoning opportunities within the vascular imaging sector.
Blood Vessel Visualization Equipment Market Dynamics & Structure
The global Blood Vessel Visualization Equipment market is characterized by a moderate to high concentration, with key players like Siemens, GE Healthcare, and Philips holding significant shares. Technological innovation is the primary driver, fueled by advancements in imaging modalities such as high-resolution ultrasound, infrared technology, and improved MRI coils. Regulatory frameworks, including FDA approvals and CE marking, play a crucial role in market access and product development timelines. Competitive product substitutes, primarily manual palpation and traditional diagnostic methods, are gradually being displaced by advanced visualization technologies. End-user demographics are shifting towards an aging global population experiencing a rise in cardiovascular and peripheral vascular diseases, increasing the demand for accurate and early diagnosis. Mergers and Acquisitions (M&A) activity is moderate, driven by strategic consolidation and the acquisition of innovative startups to expand product portfolios and geographic reach.
- Market Concentration: Moderate to High, with dominant global players.
- Technological Innovation Drivers: Enhanced resolution, portability, AI integration, and minimally invasive visualization techniques.
- Regulatory Frameworks: Stringent approval processes impacting time-to-market and R&D investment.
- Competitive Product Substitutes: Transition from invasive procedures and older imaging methods to advanced visualization.
- End-User Demographics: Growing prevalence of vascular diseases in aging populations.
- M&A Trends: Strategic acquisitions of technology-focused companies to enhance portfolios.
Blood Vessel Visualization Equipment Growth Trends & Insights
The global Blood Vessel Visualization Equipment market is poised for robust expansion, projected to reach a substantial valuation driven by escalating demand for minimally invasive diagnostic and therapeutic procedures. This market expansion is intrinsically linked to the increasing incidence of chronic diseases, particularly cardiovascular and peripheral vascular disorders, which necessitates early and accurate detection. The adoption of advanced imaging technologies is accelerating, transforming patient care pathways and improving surgical outcomes. Ultrasound imaging, renowned for its real-time visualization capabilities and portability, remains a dominant force. However, the market is witnessing significant growth in infrared imaging for superficial vein visualization and advanced MRI techniques for intricate vascular mapping. The integration of artificial intelligence (AI) into visualization equipment is a transformative trend, enabling automated analysis, enhanced image interpretation, and improved diagnostic accuracy. This technological evolution is driving consumer behavior shifts towards proactive health management and preferences for non-invasive diagnostic solutions. The market penetration of advanced blood vessel visualization equipment is steadily increasing across both developed and emerging economies, as healthcare providers recognize the clinical and economic benefits. Key performance indicators such as Compound Annual Growth Rate (CAGR) are expected to remain strong throughout the forecast period, reflecting sustained market momentum. The Estimated Year: 2025 will see significant market activity as adoption rates for newer technologies climb. The Forecast Period: 2025–2033 anticipates continuous innovation and market expansion, with a CAGR estimated at xx%. The market size in 2025 is expected to be approximately $xx million units. The projected market size by 2033 is expected to reach $xx million units.
Dominant Regions, Countries, or Segments in Blood Vessel Visualization Equipment
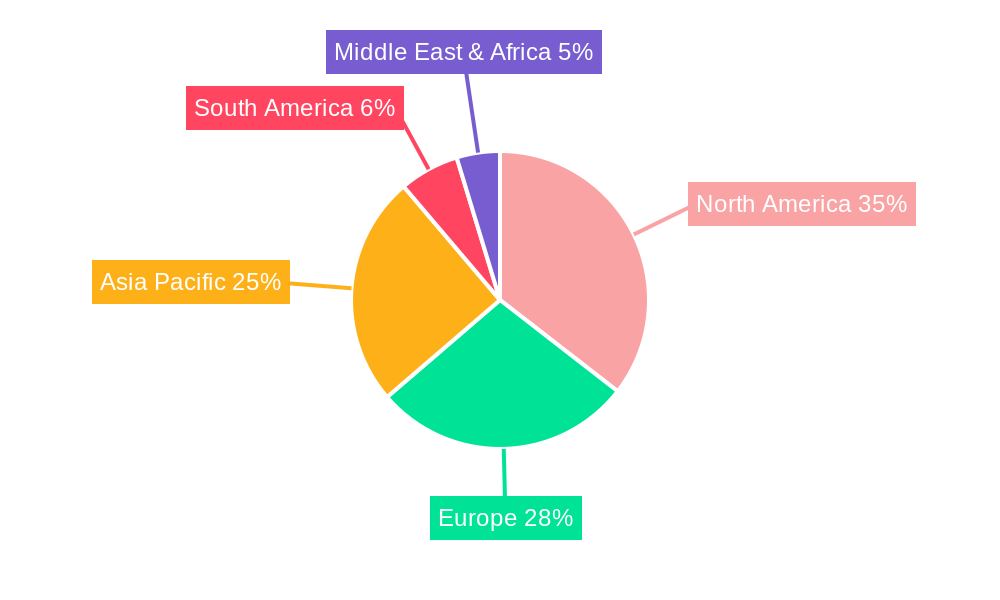
North America currently stands as the dominant region in the Blood Vessel Visualization Equipment market, driven by a confluence of factors including a well-established healthcare infrastructure, high healthcare expenditure, and a proactive approach to adopting advanced medical technologies. The United States, in particular, represents a significant portion of the market share, owing to its large patient population, prevalence of chronic vascular diseases, and robust research and development ecosystem. The Application segment of Hospitals is the primary revenue generator, followed by Diagnostic Imaging Centers. The Type segment of Ultrasound Imaging dominates due to its versatility, affordability, and real-time visualization capabilities, making it indispensable for a wide range of vascular assessments. However, other types are gaining traction. Infrared Imaging, for instance, is experiencing rapid adoption for applications like phlebotomy and venipuncture, particularly in Others (including outpatient clinics and home healthcare settings), due to its non-invasiveness and ease of use. The technological advancements in Magnetic Resonance Imaging (MRI) are also contributing to its growth, especially for detailed anatomical mapping of complex vascular structures. The economic policies in these regions, which incentivize technological adoption and innovation, further fuel market growth. The high per capita income and insurance coverage facilitate greater access to sophisticated medical devices. Furthermore, the presence of leading global manufacturers and strong distribution networks ensures widespread availability of these visualization tools. The increasing awareness among healthcare professionals and patients about the benefits of advanced vascular visualization, such as improved diagnostic accuracy and reduced patient discomfort, also plays a pivotal role. The market share of North America is estimated at xx% in the Estimated Year: 2025, with significant growth potential driven by ongoing technological refinements and expanding applications.
Blood Vessel Visualization Equipment Product Landscape
The Blood Vessel Visualization Equipment market is characterized by continuous product innovation, with a focus on enhancing imaging resolution, portability, and ease of use. Companies are actively developing devices that offer real-time, high-fidelity visualization of vascular structures, aiding in diagnosis, minimally invasive procedures, and therapeutic interventions. Applications span from general vascular assessments to specialized areas like neurovascular imaging and peripheral artery disease diagnosis. Key technological advancements include miniaturization of ultrasound probes, development of sophisticated infrared mapping algorithms, and improved contrast enhancement techniques in MRI. Performance metrics such as image clarity, penetration depth, and diagnostic accuracy are constantly being refined. Unique selling propositions often lie in the integration of AI for automated vein detection, user-friendly interfaces, and wireless connectivity for seamless data integration into electronic health records.
Key Drivers, Barriers & Challenges in Blood Vessel Visualization Equipment
Key Drivers: The primary forces propelling the Blood Vessel Visualization Equipment market are the escalating global prevalence of vascular diseases, the increasing demand for minimally invasive diagnostic and therapeutic procedures, and continuous technological advancements in imaging modalities. The aging global population contributes significantly to the rising incidence of conditions like atherosclerosis and peripheral artery disease, necessitating advanced visualization tools for accurate diagnosis and treatment. Furthermore, the drive towards improved patient outcomes and reduced healthcare costs encourages the adoption of non-invasive and efficient imaging solutions.
Barriers & Challenges: The market faces several challenges, including the high initial cost of advanced visualization equipment, which can be a significant barrier for smaller healthcare facilities, especially in emerging economies. Stringent regulatory approval processes in different regions can delay market entry and increase R&D expenses. Supply chain disruptions, as witnessed in recent global events, can impact the availability and cost of critical components. Intense competition among established players and emerging startups also puts pressure on pricing and profit margins. Furthermore, the need for specialized training to operate and interpret advanced imaging systems can limit widespread adoption. The market for blood vessel visualization equipment is projected to face challenges related to supply chain volatility and regulatory hurdles, impacting the availability of xx% of critical components.
Emerging Opportunities in Blood Vessel Visualization Equipment
Emerging opportunities in the Blood Vessel Visualization Equipment market lie in the development of AI-powered diagnostic platforms that offer predictive analytics for vascular health. The expansion of point-of-care ultrasound (POCUS) devices for vascular assessment in remote or underserved areas presents a significant growth avenue. Innovations in wearable or implantable vascular imaging technologies could revolutionize long-term patient monitoring. Untapped markets in developing economies, with increasing healthcare investments, also offer considerable potential. Furthermore, the growing interest in personalized medicine and precision vascular interventions will drive demand for highly specialized visualization equipment.
Growth Accelerators in the Blood Vessel Visualization Equipment Industry
Long-term growth in the Blood Vessel Visualization Equipment industry will be significantly accelerated by continuous technological breakthroughs, such as advancements in artificial intelligence for image analysis and fusion imaging techniques that combine multiple modalities for comprehensive visualization. Strategic partnerships between equipment manufacturers and software developers are crucial for integrating advanced analytics and AI algorithms. Market expansion strategies, including the penetration of emerging economies and the development of cost-effective solutions tailored for these regions, will also act as major growth accelerators. Increased government initiatives and funding for cardiovascular research and treatment will further bolster market expansion.
Key Players Shaping the Blood Vessel Visualization Equipment Market
- Siemens
- Bracco Diagnostic
- Alfa-Med
- Christie Medical Holdings
- Nipro
- Tecmag
- Philips
- GE Healthcare
- VueTek
- Luminetx
- AccuVein
- Samsung Medison
- Shimadzu
- Fujifilm Sonosite
- Clarius
- Mindray Medical
- Avinger
- Paragon Medical
- Olympus
Notable Milestones in Blood Vessel Visualization Equipment Sector
- 2022: Introduction of advanced AI algorithms for real-time vein detection in ultrasound devices, improving phlebotomy success rates.
- 2023: Launch of highly portable, handheld ultrasound systems with enhanced vascular imaging capabilities, increasing accessibility in clinical settings.
- 2023: Significant advancements in infrared vein visualization technology, offering higher resolution and deeper penetration for superficial vessel mapping.
- 2024: Increased regulatory approvals for minimally invasive endovascular treatment devices that rely heavily on advanced visualization for guidance.
- 2024: Strategic collaborations formed between leading imaging companies and AI developers to integrate predictive analytics for vascular disease management.
In-Depth Blood Vessel Visualization Equipment Market Outlook
The future outlook for the Blood Vessel Visualization Equipment market is exceptionally promising, driven by sustained demand for advanced diagnostic and therapeutic solutions. Growth accelerators such as the integration of artificial intelligence for enhanced diagnostic accuracy and personalized treatment planning will be pivotal. Strategic partnerships and the expanding footprint in emerging markets are set to unlock substantial revenue streams. The continuous evolution of imaging technologies, leading to more portable, user-friendly, and cost-effective devices, will further democratize access to these critical tools. The market is poised for significant expansion, offering lucrative opportunities for stakeholders focused on innovation and addressing the growing global burden of vascular diseases.
Blood Vessel Visualization Equipment Segmentation
-
1. Application
- 1.1. Hospitals
- 1.2. Diagnostic Imaging Centers
- 1.3. Others
-
2. Type
- 2.1. Ultrasound Imaging
- 2.2. Infrared Imaging
- 2.3. Magnetic Resonance Imaging
- 2.4. Tomography
- 2.5. Others
Blood Vessel Visualization Equipment Segmentation By Geography
-
1. North America
- 1.1. United States
- 1.2. Canada
- 1.3. Mexico
-
2. South America
- 2.1. Brazil
- 2.2. Argentina
- 2.3. Rest of South America
-
3. Europe
- 3.1. United Kingdom
- 3.2. Germany
- 3.3. France
- 3.4. Italy
- 3.5. Spain
- 3.6. Russia
- 3.7. Benelux
- 3.8. Nordics
- 3.9. Rest of Europe
-
4. Middle East & Africa
- 4.1. Turkey
- 4.2. Israel
- 4.3. GCC
- 4.4. North Africa
- 4.5. South Africa
- 4.6. Rest of Middle East & Africa
-
5. Asia Pacific
- 5.1. China
- 5.2. India
- 5.3. Japan
- 5.4. South Korea
- 5.5. ASEAN
- 5.6. Oceania
- 5.7. Rest of Asia Pacific
Blood Vessel Visualization Equipment REPORT HIGHLIGHTS
| Aspects | Details |
|---|---|
| Study Period | 2019-2033 |
| Base Year | 2024 |
| Estimated Year | 2025 |
| Forecast Period | 2025-2033 |
| Historical Period | 2019-2024 |
| Growth Rate | CAGR of 5.6% from 2019-2033 |
| Segmentation |
|
Table of Contents
- 1. Introduction
- 1.1. Research Scope
- 1.2. Market Segmentation
- 1.3. Research Methodology
- 1.4. Definitions and Assumptions
- 2. Executive Summary
- 2.1. Introduction
- 3. Market Dynamics
- 3.1. Introduction
- 3.2. Market Drivers
- 3.3. Market Restrains
- 3.4. Market Trends
- 4. Market Factor Analysis
- 4.1. Porters Five Forces
- 4.2. Supply/Value Chain
- 4.3. PESTEL analysis
- 4.4. Market Entropy
- 4.5. Patent/Trademark Analysis
- 5. Global Blood Vessel Visualization Equipment Analysis, Insights and Forecast, 2019-2031
- 5.1. Market Analysis, Insights and Forecast - by Application
- 5.1.1. Hospitals
- 5.1.2. Diagnostic Imaging Centers
- 5.1.3. Others
- 5.2. Market Analysis, Insights and Forecast - by Type
- 5.2.1. Ultrasound Imaging
- 5.2.2. Infrared Imaging
- 5.2.3. Magnetic Resonance Imaging
- 5.2.4. Tomography
- 5.2.5. Others
- 5.3. Market Analysis, Insights and Forecast - by Region
- 5.3.1. North America
- 5.3.2. South America
- 5.3.3. Europe
- 5.3.4. Middle East & Africa
- 5.3.5. Asia Pacific
- 5.1. Market Analysis, Insights and Forecast - by Application
- 6. North America Blood Vessel Visualization Equipment Analysis, Insights and Forecast, 2019-2031
- 6.1. Market Analysis, Insights and Forecast - by Application
- 6.1.1. Hospitals
- 6.1.2. Diagnostic Imaging Centers
- 6.1.3. Others
- 6.2. Market Analysis, Insights and Forecast - by Type
- 6.2.1. Ultrasound Imaging
- 6.2.2. Infrared Imaging
- 6.2.3. Magnetic Resonance Imaging
- 6.2.4. Tomography
- 6.2.5. Others
- 6.1. Market Analysis, Insights and Forecast - by Application
- 7. South America Blood Vessel Visualization Equipment Analysis, Insights and Forecast, 2019-2031
- 7.1. Market Analysis, Insights and Forecast - by Application
- 7.1.1. Hospitals
- 7.1.2. Diagnostic Imaging Centers
- 7.1.3. Others
- 7.2. Market Analysis, Insights and Forecast - by Type
- 7.2.1. Ultrasound Imaging
- 7.2.2. Infrared Imaging
- 7.2.3. Magnetic Resonance Imaging
- 7.2.4. Tomography
- 7.2.5. Others
- 7.1. Market Analysis, Insights and Forecast - by Application
- 8. Europe Blood Vessel Visualization Equipment Analysis, Insights and Forecast, 2019-2031
- 8.1. Market Analysis, Insights and Forecast - by Application
- 8.1.1. Hospitals
- 8.1.2. Diagnostic Imaging Centers
- 8.1.3. Others
- 8.2. Market Analysis, Insights and Forecast - by Type
- 8.2.1. Ultrasound Imaging
- 8.2.2. Infrared Imaging
- 8.2.3. Magnetic Resonance Imaging
- 8.2.4. Tomography
- 8.2.5. Others
- 8.1. Market Analysis, Insights and Forecast - by Application
- 9. Middle East & Africa Blood Vessel Visualization Equipment Analysis, Insights and Forecast, 2019-2031
- 9.1. Market Analysis, Insights and Forecast - by Application
- 9.1.1. Hospitals
- 9.1.2. Diagnostic Imaging Centers
- 9.1.3. Others
- 9.2. Market Analysis, Insights and Forecast - by Type
- 9.2.1. Ultrasound Imaging
- 9.2.2. Infrared Imaging
- 9.2.3. Magnetic Resonance Imaging
- 9.2.4. Tomography
- 9.2.5. Others
- 9.1. Market Analysis, Insights and Forecast - by Application
- 10. Asia Pacific Blood Vessel Visualization Equipment Analysis, Insights and Forecast, 2019-2031
- 10.1. Market Analysis, Insights and Forecast - by Application
- 10.1.1. Hospitals
- 10.1.2. Diagnostic Imaging Centers
- 10.1.3. Others
- 10.2. Market Analysis, Insights and Forecast - by Type
- 10.2.1. Ultrasound Imaging
- 10.2.2. Infrared Imaging
- 10.2.3. Magnetic Resonance Imaging
- 10.2.4. Tomography
- 10.2.5. Others
- 10.1. Market Analysis, Insights and Forecast - by Application
- 11. Competitive Analysis
- 11.1. Global Market Share Analysis 2024
- 11.2. Company Profiles
- 11.2.1 Siemens
- 11.2.1.1. Overview
- 11.2.1.2. Products
- 11.2.1.3. SWOT Analysis
- 11.2.1.4. Recent Developments
- 11.2.1.5. Financials (Based on Availability)
- 11.2.2 Bracco Diagnostic
- 11.2.2.1. Overview
- 11.2.2.2. Products
- 11.2.2.3. SWOT Analysis
- 11.2.2.4. Recent Developments
- 11.2.2.5. Financials (Based on Availability)
- 11.2.3 Alfa-Med
- 11.2.3.1. Overview
- 11.2.3.2. Products
- 11.2.3.3. SWOT Analysis
- 11.2.3.4. Recent Developments
- 11.2.3.5. Financials (Based on Availability)
- 11.2.4 Christie Medical Holdings
- 11.2.4.1. Overview
- 11.2.4.2. Products
- 11.2.4.3. SWOT Analysis
- 11.2.4.4. Recent Developments
- 11.2.4.5. Financials (Based on Availability)
- 11.2.5 Nipro
- 11.2.5.1. Overview
- 11.2.5.2. Products
- 11.2.5.3. SWOT Analysis
- 11.2.5.4. Recent Developments
- 11.2.5.5. Financials (Based on Availability)
- 11.2.6 Tecmag
- 11.2.6.1. Overview
- 11.2.6.2. Products
- 11.2.6.3. SWOT Analysis
- 11.2.6.4. Recent Developments
- 11.2.6.5. Financials (Based on Availability)
- 11.2.7 Philips
- 11.2.7.1. Overview
- 11.2.7.2. Products
- 11.2.7.3. SWOT Analysis
- 11.2.7.4. Recent Developments
- 11.2.7.5. Financials (Based on Availability)
- 11.2.8 GE Healthcare
- 11.2.8.1. Overview
- 11.2.8.2. Products
- 11.2.8.3. SWOT Analysis
- 11.2.8.4. Recent Developments
- 11.2.8.5. Financials (Based on Availability)
- 11.2.9 VueTek
- 11.2.9.1. Overview
- 11.2.9.2. Products
- 11.2.9.3. SWOT Analysis
- 11.2.9.4. Recent Developments
- 11.2.9.5. Financials (Based on Availability)
- 11.2.10 Luminetx
- 11.2.10.1. Overview
- 11.2.10.2. Products
- 11.2.10.3. SWOT Analysis
- 11.2.10.4. Recent Developments
- 11.2.10.5. Financials (Based on Availability)
- 11.2.11 AccuVein
- 11.2.11.1. Overview
- 11.2.11.2. Products
- 11.2.11.3. SWOT Analysis
- 11.2.11.4. Recent Developments
- 11.2.11.5. Financials (Based on Availability)
- 11.2.12 Samsung Medison
- 11.2.12.1. Overview
- 11.2.12.2. Products
- 11.2.12.3. SWOT Analysis
- 11.2.12.4. Recent Developments
- 11.2.12.5. Financials (Based on Availability)
- 11.2.13 Shimadzu
- 11.2.13.1. Overview
- 11.2.13.2. Products
- 11.2.13.3. SWOT Analysis
- 11.2.13.4. Recent Developments
- 11.2.13.5. Financials (Based on Availability)
- 11.2.14 Fujifilm Sonosite
- 11.2.14.1. Overview
- 11.2.14.2. Products
- 11.2.14.3. SWOT Analysis
- 11.2.14.4. Recent Developments
- 11.2.14.5. Financials (Based on Availability)
- 11.2.15 Clarius
- 11.2.15.1. Overview
- 11.2.15.2. Products
- 11.2.15.3. SWOT Analysis
- 11.2.15.4. Recent Developments
- 11.2.15.5. Financials (Based on Availability)
- 11.2.16 Mindray Medical
- 11.2.16.1. Overview
- 11.2.16.2. Products
- 11.2.16.3. SWOT Analysis
- 11.2.16.4. Recent Developments
- 11.2.16.5. Financials (Based on Availability)
- 11.2.17 Avinger
- 11.2.17.1. Overview
- 11.2.17.2. Products
- 11.2.17.3. SWOT Analysis
- 11.2.17.4. Recent Developments
- 11.2.17.5. Financials (Based on Availability)
- 11.2.18 Paragon Medical
- 11.2.18.1. Overview
- 11.2.18.2. Products
- 11.2.18.3. SWOT Analysis
- 11.2.18.4. Recent Developments
- 11.2.18.5. Financials (Based on Availability)
- 11.2.19 Olympus
- 11.2.19.1. Overview
- 11.2.19.2. Products
- 11.2.19.3. SWOT Analysis
- 11.2.19.4. Recent Developments
- 11.2.19.5. Financials (Based on Availability)
- 11.2.1 Siemens
List of Figures
- Figure 1: Global Blood Vessel Visualization Equipment Revenue Breakdown (million, %) by Region 2024 & 2032
- Figure 2: North America Blood Vessel Visualization Equipment Revenue (million), by Application 2024 & 2032
- Figure 3: North America Blood Vessel Visualization Equipment Revenue Share (%), by Application 2024 & 2032
- Figure 4: North America Blood Vessel Visualization Equipment Revenue (million), by Type 2024 & 2032
- Figure 5: North America Blood Vessel Visualization Equipment Revenue Share (%), by Type 2024 & 2032
- Figure 6: North America Blood Vessel Visualization Equipment Revenue (million), by Country 2024 & 2032
- Figure 7: North America Blood Vessel Visualization Equipment Revenue Share (%), by Country 2024 & 2032
- Figure 8: South America Blood Vessel Visualization Equipment Revenue (million), by Application 2024 & 2032
- Figure 9: South America Blood Vessel Visualization Equipment Revenue Share (%), by Application 2024 & 2032
- Figure 10: South America Blood Vessel Visualization Equipment Revenue (million), by Type 2024 & 2032
- Figure 11: South America Blood Vessel Visualization Equipment Revenue Share (%), by Type 2024 & 2032
- Figure 12: South America Blood Vessel Visualization Equipment Revenue (million), by Country 2024 & 2032
- Figure 13: South America Blood Vessel Visualization Equipment Revenue Share (%), by Country 2024 & 2032
- Figure 14: Europe Blood Vessel Visualization Equipment Revenue (million), by Application 2024 & 2032
- Figure 15: Europe Blood Vessel Visualization Equipment Revenue Share (%), by Application 2024 & 2032
- Figure 16: Europe Blood Vessel Visualization Equipment Revenue (million), by Type 2024 & 2032
- Figure 17: Europe Blood Vessel Visualization Equipment Revenue Share (%), by Type 2024 & 2032
- Figure 18: Europe Blood Vessel Visualization Equipment Revenue (million), by Country 2024 & 2032
- Figure 19: Europe Blood Vessel Visualization Equipment Revenue Share (%), by Country 2024 & 2032
- Figure 20: Middle East & Africa Blood Vessel Visualization Equipment Revenue (million), by Application 2024 & 2032
- Figure 21: Middle East & Africa Blood Vessel Visualization Equipment Revenue Share (%), by Application 2024 & 2032
- Figure 22: Middle East & Africa Blood Vessel Visualization Equipment Revenue (million), by Type 2024 & 2032
- Figure 23: Middle East & Africa Blood Vessel Visualization Equipment Revenue Share (%), by Type 2024 & 2032
- Figure 24: Middle East & Africa Blood Vessel Visualization Equipment Revenue (million), by Country 2024 & 2032
- Figure 25: Middle East & Africa Blood Vessel Visualization Equipment Revenue Share (%), by Country 2024 & 2032
- Figure 26: Asia Pacific Blood Vessel Visualization Equipment Revenue (million), by Application 2024 & 2032
- Figure 27: Asia Pacific Blood Vessel Visualization Equipment Revenue Share (%), by Application 2024 & 2032
- Figure 28: Asia Pacific Blood Vessel Visualization Equipment Revenue (million), by Type 2024 & 2032
- Figure 29: Asia Pacific Blood Vessel Visualization Equipment Revenue Share (%), by Type 2024 & 2032
- Figure 30: Asia Pacific Blood Vessel Visualization Equipment Revenue (million), by Country 2024 & 2032
- Figure 31: Asia Pacific Blood Vessel Visualization Equipment Revenue Share (%), by Country 2024 & 2032
List of Tables
- Table 1: Global Blood Vessel Visualization Equipment Revenue million Forecast, by Region 2019 & 2032
- Table 2: Global Blood Vessel Visualization Equipment Revenue million Forecast, by Application 2019 & 2032
- Table 3: Global Blood Vessel Visualization Equipment Revenue million Forecast, by Type 2019 & 2032
- Table 4: Global Blood Vessel Visualization Equipment Revenue million Forecast, by Region 2019 & 2032
- Table 5: Global Blood Vessel Visualization Equipment Revenue million Forecast, by Application 2019 & 2032
- Table 6: Global Blood Vessel Visualization Equipment Revenue million Forecast, by Type 2019 & 2032
- Table 7: Global Blood Vessel Visualization Equipment Revenue million Forecast, by Country 2019 & 2032
- Table 8: United States Blood Vessel Visualization Equipment Revenue (million) Forecast, by Application 2019 & 2032
- Table 9: Canada Blood Vessel Visualization Equipment Revenue (million) Forecast, by Application 2019 & 2032
- Table 10: Mexico Blood Vessel Visualization Equipment Revenue (million) Forecast, by Application 2019 & 2032
- Table 11: Global Blood Vessel Visualization Equipment Revenue million Forecast, by Application 2019 & 2032
- Table 12: Global Blood Vessel Visualization Equipment Revenue million Forecast, by Type 2019 & 2032
- Table 13: Global Blood Vessel Visualization Equipment Revenue million Forecast, by Country 2019 & 2032
- Table 14: Brazil Blood Vessel Visualization Equipment Revenue (million) Forecast, by Application 2019 & 2032
- Table 15: Argentina Blood Vessel Visualization Equipment Revenue (million) Forecast, by Application 2019 & 2032
- Table 16: Rest of South America Blood Vessel Visualization Equipment Revenue (million) Forecast, by Application 2019 & 2032
- Table 17: Global Blood Vessel Visualization Equipment Revenue million Forecast, by Application 2019 & 2032
- Table 18: Global Blood Vessel Visualization Equipment Revenue million Forecast, by Type 2019 & 2032
- Table 19: Global Blood Vessel Visualization Equipment Revenue million Forecast, by Country 2019 & 2032
- Table 20: United Kingdom Blood Vessel Visualization Equipment Revenue (million) Forecast, by Application 2019 & 2032
- Table 21: Germany Blood Vessel Visualization Equipment Revenue (million) Forecast, by Application 2019 & 2032
- Table 22: France Blood Vessel Visualization Equipment Revenue (million) Forecast, by Application 2019 & 2032
- Table 23: Italy Blood Vessel Visualization Equipment Revenue (million) Forecast, by Application 2019 & 2032
- Table 24: Spain Blood Vessel Visualization Equipment Revenue (million) Forecast, by Application 2019 & 2032
- Table 25: Russia Blood Vessel Visualization Equipment Revenue (million) Forecast, by Application 2019 & 2032
- Table 26: Benelux Blood Vessel Visualization Equipment Revenue (million) Forecast, by Application 2019 & 2032
- Table 27: Nordics Blood Vessel Visualization Equipment Revenue (million) Forecast, by Application 2019 & 2032
- Table 28: Rest of Europe Blood Vessel Visualization Equipment Revenue (million) Forecast, by Application 2019 & 2032
- Table 29: Global Blood Vessel Visualization Equipment Revenue million Forecast, by Application 2019 & 2032
- Table 30: Global Blood Vessel Visualization Equipment Revenue million Forecast, by Type 2019 & 2032
- Table 31: Global Blood Vessel Visualization Equipment Revenue million Forecast, by Country 2019 & 2032
- Table 32: Turkey Blood Vessel Visualization Equipment Revenue (million) Forecast, by Application 2019 & 2032
- Table 33: Israel Blood Vessel Visualization Equipment Revenue (million) Forecast, by Application 2019 & 2032
- Table 34: GCC Blood Vessel Visualization Equipment Revenue (million) Forecast, by Application 2019 & 2032
- Table 35: North Africa Blood Vessel Visualization Equipment Revenue (million) Forecast, by Application 2019 & 2032
- Table 36: South Africa Blood Vessel Visualization Equipment Revenue (million) Forecast, by Application 2019 & 2032
- Table 37: Rest of Middle East & Africa Blood Vessel Visualization Equipment Revenue (million) Forecast, by Application 2019 & 2032
- Table 38: Global Blood Vessel Visualization Equipment Revenue million Forecast, by Application 2019 & 2032
- Table 39: Global Blood Vessel Visualization Equipment Revenue million Forecast, by Type 2019 & 2032
- Table 40: Global Blood Vessel Visualization Equipment Revenue million Forecast, by Country 2019 & 2032
- Table 41: China Blood Vessel Visualization Equipment Revenue (million) Forecast, by Application 2019 & 2032
- Table 42: India Blood Vessel Visualization Equipment Revenue (million) Forecast, by Application 2019 & 2032
- Table 43: Japan Blood Vessel Visualization Equipment Revenue (million) Forecast, by Application 2019 & 2032
- Table 44: South Korea Blood Vessel Visualization Equipment Revenue (million) Forecast, by Application 2019 & 2032
- Table 45: ASEAN Blood Vessel Visualization Equipment Revenue (million) Forecast, by Application 2019 & 2032
- Table 46: Oceania Blood Vessel Visualization Equipment Revenue (million) Forecast, by Application 2019 & 2032
- Table 47: Rest of Asia Pacific Blood Vessel Visualization Equipment Revenue (million) Forecast, by Application 2019 & 2032
Frequently Asked Questions
1. What is the projected Compound Annual Growth Rate (CAGR) of the Blood Vessel Visualization Equipment?
The projected CAGR is approximately 5.6%.
2. Which companies are prominent players in the Blood Vessel Visualization Equipment?
Key companies in the market include Siemens, Bracco Diagnostic, Alfa-Med, Christie Medical Holdings, Nipro, Tecmag, Philips, GE Healthcare, VueTek, Luminetx, AccuVein, Samsung Medison, Shimadzu, Fujifilm Sonosite, Clarius, Mindray Medical, Avinger, Paragon Medical, Olympus.
3. What are the main segments of the Blood Vessel Visualization Equipment?
The market segments include Application, Type.
4. Can you provide details about the market size?
The market size is estimated to be USD 961 million as of 2022.
5. What are some drivers contributing to market growth?
N/A
6. What are the notable trends driving market growth?
N/A
7. Are there any restraints impacting market growth?
N/A
8. Can you provide examples of recent developments in the market?
N/A
9. What pricing options are available for accessing the report?
Pricing options include single-user, multi-user, and enterprise licenses priced at USD 4250.00, USD 6375.00, and USD 8500.00 respectively.
10. Is the market size provided in terms of value or volume?
The market size is provided in terms of value, measured in million.
11. Are there any specific market keywords associated with the report?
Yes, the market keyword associated with the report is "Blood Vessel Visualization Equipment," which aids in identifying and referencing the specific market segment covered.
12. How do I determine which pricing option suits my needs best?
The pricing options vary based on user requirements and access needs. Individual users may opt for single-user licenses, while businesses requiring broader access may choose multi-user or enterprise licenses for cost-effective access to the report.
13. Are there any additional resources or data provided in the Blood Vessel Visualization Equipment report?
While the report offers comprehensive insights, it's advisable to review the specific contents or supplementary materials provided to ascertain if additional resources or data are available.
14. How can I stay updated on further developments or reports in the Blood Vessel Visualization Equipment?
To stay informed about further developments, trends, and reports in the Blood Vessel Visualization Equipment, consider subscribing to industry newsletters, following relevant companies and organizations, or regularly checking reputable industry news sources and publications.
Methodology
Step 1 - Identification of Relevant Samples Size from Population Database


Step 2 - Approaches for Defining Global Market Size (Value, Volume* & Price*)

Note*: In applicable scenarios
Step 3 - Data Sources
Primary Research
- Web Analytics
- Survey Reports
- Research Institute
- Latest Research Reports
- Opinion Leaders
Secondary Research
- Annual Reports
- White Paper
- Latest Press Release
- Industry Association
- Paid Database
- Investor Presentations

Step 4 - Data Triangulation
Involves using different sources of information in order to increase the validity of a study
These sources are likely to be stakeholders in a program - participants, other researchers, program staff, other community members, and so on.
Then we put all data in single framework & apply various statistical tools to find out the dynamic on the market.
During the analysis stage, feedback from the stakeholder groups would be compared to determine areas of agreement as well as areas of divergence
