

Key Insights
The RNA analytics market is poised for substantial expansion, propelled by innovations in sequencing technologies, a deeper understanding of RNA's biological functions, and the growing utility in clinical diagnostics and drug discovery. The market is projected to achieve a Compound Annual Growth Rate (CAGR) of 17.1%. This upward trajectory is driven by the increasing incidence of chronic diseases, which necessitates advanced diagnostic solutions, and the widespread adoption of personalized medicine. Significant research and development investments by pharmaceutical and biotechnology firms are further stimulating market growth. While the market features numerous participants, leading entities such as Illumina, Thermo Fisher Scientific, and QIAGEN command substantial market share through their comprehensive product offerings and established distribution channels. Key growth areas include next-generation sequencing (NGS) within the technology segment, and clinical diagnostics and drug discovery in the application segment. North America currently leads the market, supported by its sophisticated healthcare infrastructure and robust research funding. However, the Asia-Pacific region is anticipated to witness the most rapid growth, fueled by escalating healthcare expenditures and heightened awareness of advanced diagnostic methodologies.
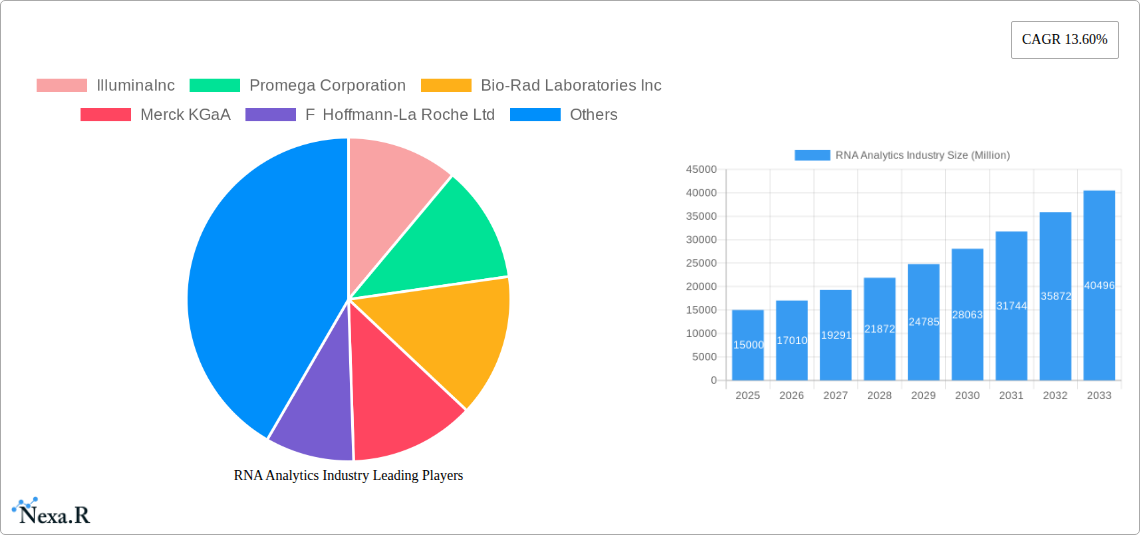
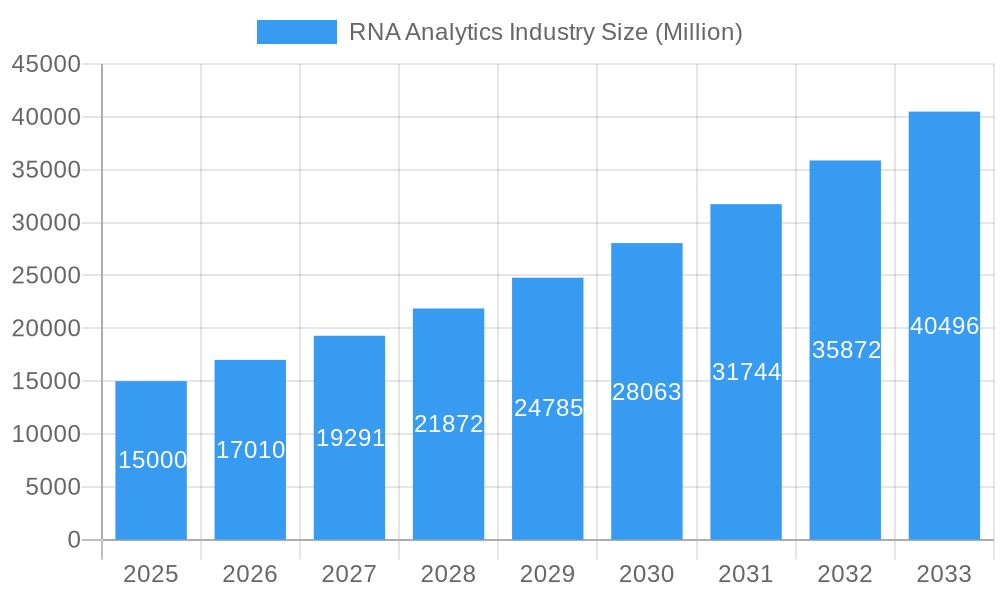
RNA Analytics Industry Market Size (In Billion)
Future market expansion will be influenced by several critical factors. Ongoing technological advancements, particularly in high-throughput sequencing and bioinformatics, will be paramount. Decreasing sequencing costs and the development of more intuitive analytical tools are expected to enhance market accessibility. Regulatory approvals for novel RNA-based diagnostics and therapeutics will also play a significant role in market growth. Conversely, potential impediments include the complex regulatory environment for diagnostics and the high cost associated with advanced instrumentation, which may constrain growth in specific regions. Growing concerns regarding data privacy and security, especially with the proliferation of large genomic datasets, will necessitate robust solutions and regulatory frameworks. Overall, the RNA analytics market is set for sustained growth, underpinned by technological innovation, expanding applications, and increased investment.
RNA Analytics Industry Company Market Share
This detailed report offers an in-depth analysis of the RNA Analytics industry, covering market dynamics, growth trajectories, key stakeholders, and future projections. Focusing on the parent market of Life Sciences and the child market of Genomics, this report provides critical intelligence for industry professionals, investors, and researchers. The analysis spans the period from 2019 to 2033, with 2025 designated as the base and estimated year. The current market size is valued at $8.8 billion.
RNA Analytics Industry Market Dynamics & Structure
The RNA Analytics market, valued at xx Million in 2024, is characterized by a moderately concentrated landscape with key players such as Illumina Inc, Thermo Fisher Scientific, and QIAGEN holding significant market share. Technological innovation, particularly in next-generation sequencing (NGS) and microarrays, is a primary growth driver. Stringent regulatory frameworks, particularly concerning clinical diagnostics, influence market dynamics. Competitive product substitutes, such as digital PCR, also impact market penetration. End-user demographics are predominantly skewed towards pharmaceutical & biotechnology companies and hospitals & diagnostic centers. The market has witnessed several M&A activities in recent years, with xx deals recorded between 2019 and 2024, indicating consolidation and strategic expansion.
- Market Concentration: Moderately concentrated, with top 5 players holding approximately xx% market share in 2024.
- Technological Innovation: NGS and microarray technologies are major drivers, with continuous advancements in accuracy, speed, and cost-effectiveness.
- Regulatory Landscape: Stringent regulations, especially for clinical applications, present both challenges and opportunities.
- Competitive Substitutes: Digital PCR and other technologies pose competitive pressure.
- M&A Activity: xx deals recorded between 2019 and 2024, indicating market consolidation.
- Innovation Barriers: High R&D costs, complex regulatory pathways, and intellectual property protection issues.
RNA Analytics Industry Growth Trends & Insights
The RNA Analytics market exhibited a CAGR of xx% during the historical period (2019-2024), driven by increasing adoption of RNA-based diagnostics and therapeutics. The market is expected to maintain a robust CAGR of xx% during the forecast period (2025-2033), reaching xx Million by 2033. This growth is fueled by technological advancements, rising healthcare expenditure, and growing demand for personalized medicine. The market penetration of RNA sequencing technologies is increasing steadily, especially in clinical diagnostics. Consumer behavior shifts towards proactive healthcare and personalized treatments are also significant contributors to market growth. Technological disruptions, such as CRISPR-Cas technology and single-cell RNA sequencing, are expected to further accelerate market expansion.
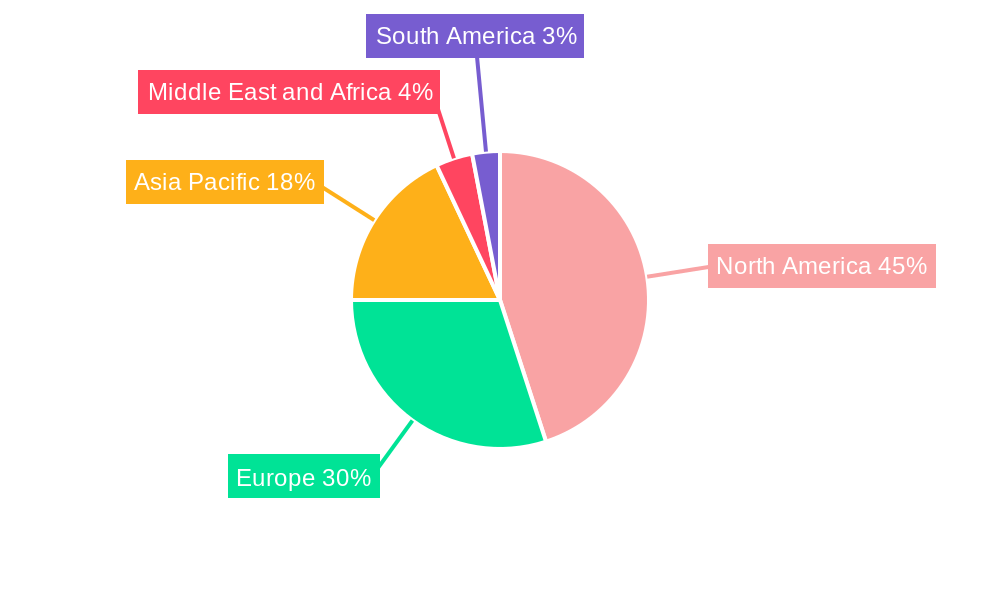
Dominant Regions, Countries, or Segments in RNA Analytics Industry
North America currently dominates the RNA Analytics market, holding the largest market share in 2024 (xx%), followed by Europe (xx%) and Asia Pacific (xx%). The dominance of North America is attributed to the presence of major players, advanced research infrastructure, and high healthcare spending. Within segments, the Sequencing technology segment is the largest, driven by its versatility and application in various fields. The Clinical Diagnostics application segment demonstrates the highest growth potential due to increasing demand for rapid and accurate disease diagnostics. Pharmaceutical and Biotechnology companies constitute the largest end-user segment, owing to the critical role of RNA analytics in drug discovery and development.
- Key Drivers: Strong presence of leading companies and research institutions, significant investments in R&D, favorable regulatory environment.
- North America: Largest market share (xx% in 2024), driven by advanced infrastructure and high healthcare spending.
- Europe: Significant market share (xx% in 2024), fueled by strong government support and rising adoption of advanced technologies.
- Sequencing Technology: Largest segment by technology, owing to its wide applications and continuous technological advancements.
- Clinical Diagnostics Application: Fastest-growing application segment, driven by increasing demand for accurate and rapid diagnostics.
- Pharmaceutical & Biotechnology Companies: Largest end-user segment, leveraging RNA analytics for drug discovery and development.
RNA Analytics Industry Product Landscape
The RNA analytics market offers a diverse range of products, including reagents/consumables, instruments, and software solutions. Recent innovations focus on improving efficiency, throughput, and data analysis capabilities. Products are characterized by high sensitivity, specificity, and accuracy. Unique selling propositions include ease of use, automation features, and comprehensive data analysis tools. Technological advancements in NGS, microarrays, and PCR continue to enhance product performance and expand applications.
Key Drivers, Barriers & Challenges in RNA Analytics Industry
Key Drivers:
- Increasing demand for personalized medicine.
- Technological advancements in NGS and microarrays.
- Rising prevalence of chronic diseases requiring advanced diagnostics.
- Growing investments in R&D by pharmaceutical and biotech companies.
Challenges and Restraints:
- High cost of instruments and reagents can limit accessibility.
- Complex data analysis requirements may necessitate specialized expertise.
- Stringent regulatory requirements for clinical applications can slow down product development.
- Intense competition among established players and new entrants.
Emerging Opportunities in RNA Analytics Industry
- Expanding applications in liquid biopsies for cancer diagnostics.
- Growth in single-cell RNA sequencing for deeper biological insights.
- Development of advanced bioinformatics tools for effective data analysis.
- Exploration of new therapeutic targets using RNA-based approaches.
Growth Accelerators in the RNA Analytics Industry
Technological breakthroughs in NGS, CRISPR-Cas, and other related fields will further accelerate market growth. Strategic partnerships and collaborations between companies and research institutions will play a crucial role in driving innovation. Market expansion into emerging economies with growing healthcare infrastructure and rising disease burden will create new opportunities.
Key Players Shaping the RNA Analytics Industry Market
- Illumina Inc
- Promega Corporation
- Bio-Rad Laboratories Inc
- Merck KGaA
- F Hoffmann-La Roche Ltd
- Eurofins Scientific
- Agilent Technologies Inc
- LC Sciences
- GenXPro GmbH
- BioMérieux SA
- Thermo Fisher Scientific
- QIAGEN
Notable Milestones in RNA Analytics Industry Sector
- June 2022: Bio-Rad Laboratories, Inc. launched the SEQuoia Express Stranded RNA Library Prep Kit, enhancing RNA-Sequencing workflows.
- February 2022: eRNA partnered with Merck KGaA for mRNA design and LNP delivery platform development.
In-Depth RNA Analytics Industry Market Outlook
The RNA Analytics market is poised for significant growth, driven by continuous technological innovation, increasing healthcare spending, and rising demand for personalized medicine. Strategic acquisitions, partnerships, and expansion into new applications will further shape market dynamics. The focus on developing user-friendly, cost-effective, and high-throughput solutions will be crucial for market leaders. The long-term outlook is optimistic, with substantial potential for expansion across various sectors.
RNA Analytics Industry Segmentation
-
1. Product Type
- 1.1. Reagents/Consumables
- 1.2. Instruments
- 1.3. Other Product Types
-
2. Technology
- 2.1. Microarrays
- 2.2. Sequencing
- 2.3. Polymerase Chain Reaction (PCR)
- 2.4. Others
-
3. Application
- 3.1. Clinical Diagnostics
- 3.2. Drug Discovery
- 3.3. Toxicogenomic
- 3.4. Other Applications
-
4. End User
- 4.1. Pharmaceutical & Biotechnology Companies
- 4.2. Hospitals and Diagnostic Centers
- 4.3. Others
RNA Analytics Industry Segmentation By Geography
-
1. North America
- 1.1. United States
- 1.2. Canada
- 1.3. Mexico
-
2. Europe
- 2.1. Germany
- 2.2. United Kingdom
- 2.3. France
- 2.4. Italy
- 2.5. Spain
- 2.6. Rest of Europe
-
3. Asia Pacific
- 3.1. China
- 3.2. Japan
- 3.3. India
- 3.4. Australia
- 3.5. South Korea
- 3.6. Rest of Asia Pacific
-
4. Middle East and Africa
- 4.1. GCC
- 4.2. South Africa
- 4.3. Rest of Middle East and Africa
-
5. South America
- 5.1. Brazil
- 5.2. Argentina
- 5.3. Rest of South America
RNA Analytics Industry Regional Market Share
Geographic Coverage of RNA Analytics Industry
RNA Analytics Industry REPORT HIGHLIGHTS
| Aspects | Details |
|---|---|
| Study Period | 2020-2034 |
| Base Year | 2025 |
| Estimated Year | 2026 |
| Forecast Period | 2026-2034 |
| Historical Period | 2020-2025 |
| Growth Rate | CAGR of 17.1% from 2020-2034 |
| Segmentation |
|
Table of Contents
- 1. Introduction
- 1.1. Research Scope
- 1.2. Market Segmentation
- 1.3. Research Objective
- 1.4. Definitions and Assumptions
- 2. Executive Summary
- 2.1. Market Snapshot
- 3. Market Dynamics
- 3.1. Market Drivers
- 3.2. Market Restrains
- 3.3. Market Trends
- 3.4. Market Opportunities
- 4. Market Factor Analysis
- 4.1. Porters Five Forces
- 4.1.1. Bargaining Power of Suppliers
- 4.1.2. Bargaining Power of Buyers
- 4.1.3. Threat of New Entrants
- 4.1.4. Threat of Substitutes
- 4.1.5. Competitive Rivalry
- 4.2. PESTEL analysis
- 4.3. BCG Analysis
- 4.3.1. Stars (High Growth, High Market Share)
- 4.3.2. Cash Cows (Low Growth, High Market Share)
- 4.3.3. Question Mark (High Growth, Low Market Share)
- 4.3.4. Dogs (Low Growth, Low Market Share)
- 4.4. Ansoff Matrix Analysis
- 4.5. Supply Chain Analysis
- 4.6. Regulatory Landscape
- 4.7. Current Market Potential and Opportunity Assessment (TAM–SAM–SOM Framework)
- 4.8. NRP Analyst Note
- 4.1. Porters Five Forces
- 5. Market Analysis, Insights and Forecast 2021-2033
- 5.1. Market Analysis, Insights and Forecast - by Product Type
- 5.1.1. Reagents/Consumables
- 5.1.2. Instruments
- 5.1.3. Other Product Types
- 5.2. Market Analysis, Insights and Forecast - by Technology
- 5.2.1. Microarrays
- 5.2.2. Sequencing
- 5.2.3. Polymerase Chain Reaction (PCR)
- 5.2.4. Others
- 5.3. Market Analysis, Insights and Forecast - by Application
- 5.3.1. Clinical Diagnostics
- 5.3.2. Drug Discovery
- 5.3.3. Toxicogenomic
- 5.3.4. Other Applications
- 5.4. Market Analysis, Insights and Forecast - by End User
- 5.4.1. Pharmaceutical & Biotechnology Companies
- 5.4.2. Hospitals and Diagnostic Centers
- 5.4.3. Others
- 5.5. Market Analysis, Insights and Forecast - by Region
- 5.5.1. North America
- 5.5.2. Europe
- 5.5.3. Asia Pacific
- 5.5.4. Middle East and Africa
- 5.5.5. South America
- 5.1. Market Analysis, Insights and Forecast - by Product Type
- 6. Global RNA Analytics Industry Analysis, Insights and Forecast, 2021-2033
- 6.1. Market Analysis, Insights and Forecast - by Product Type
- 6.1.1. Reagents/Consumables
- 6.1.2. Instruments
- 6.1.3. Other Product Types
- 6.2. Market Analysis, Insights and Forecast - by Technology
- 6.2.1. Microarrays
- 6.2.2. Sequencing
- 6.2.3. Polymerase Chain Reaction (PCR)
- 6.2.4. Others
- 6.3. Market Analysis, Insights and Forecast - by Application
- 6.3.1. Clinical Diagnostics
- 6.3.2. Drug Discovery
- 6.3.3. Toxicogenomic
- 6.3.4. Other Applications
- 6.4. Market Analysis, Insights and Forecast - by End User
- 6.4.1. Pharmaceutical & Biotechnology Companies
- 6.4.2. Hospitals and Diagnostic Centers
- 6.4.3. Others
- 6.1. Market Analysis, Insights and Forecast - by Product Type
- 7. North America RNA Analytics Industry Analysis, Insights and Forecast, 2020-2032
- 7.1. Market Analysis, Insights and Forecast - by Product Type
- 7.1.1. Reagents/Consumables
- 7.1.2. Instruments
- 7.1.3. Other Product Types
- 7.2. Market Analysis, Insights and Forecast - by Technology
- 7.2.1. Microarrays
- 7.2.2. Sequencing
- 7.2.3. Polymerase Chain Reaction (PCR)
- 7.2.4. Others
- 7.3. Market Analysis, Insights and Forecast - by Application
- 7.3.1. Clinical Diagnostics
- 7.3.2. Drug Discovery
- 7.3.3. Toxicogenomic
- 7.3.4. Other Applications
- 7.4. Market Analysis, Insights and Forecast - by End User
- 7.4.1. Pharmaceutical & Biotechnology Companies
- 7.4.2. Hospitals and Diagnostic Centers
- 7.4.3. Others
- 7.1. Market Analysis, Insights and Forecast - by Product Type
- 8. Europe RNA Analytics Industry Analysis, Insights and Forecast, 2020-2032
- 8.1. Market Analysis, Insights and Forecast - by Product Type
- 8.1.1. Reagents/Consumables
- 8.1.2. Instruments
- 8.1.3. Other Product Types
- 8.2. Market Analysis, Insights and Forecast - by Technology
- 8.2.1. Microarrays
- 8.2.2. Sequencing
- 8.2.3. Polymerase Chain Reaction (PCR)
- 8.2.4. Others
- 8.3. Market Analysis, Insights and Forecast - by Application
- 8.3.1. Clinical Diagnostics
- 8.3.2. Drug Discovery
- 8.3.3. Toxicogenomic
- 8.3.4. Other Applications
- 8.4. Market Analysis, Insights and Forecast - by End User
- 8.4.1. Pharmaceutical & Biotechnology Companies
- 8.4.2. Hospitals and Diagnostic Centers
- 8.4.3. Others
- 8.1. Market Analysis, Insights and Forecast - by Product Type
- 9. Asia Pacific RNA Analytics Industry Analysis, Insights and Forecast, 2020-2032
- 9.1. Market Analysis, Insights and Forecast - by Product Type
- 9.1.1. Reagents/Consumables
- 9.1.2. Instruments
- 9.1.3. Other Product Types
- 9.2. Market Analysis, Insights and Forecast - by Technology
- 9.2.1. Microarrays
- 9.2.2. Sequencing
- 9.2.3. Polymerase Chain Reaction (PCR)
- 9.2.4. Others
- 9.3. Market Analysis, Insights and Forecast - by Application
- 9.3.1. Clinical Diagnostics
- 9.3.2. Drug Discovery
- 9.3.3. Toxicogenomic
- 9.3.4. Other Applications
- 9.4. Market Analysis, Insights and Forecast - by End User
- 9.4.1. Pharmaceutical & Biotechnology Companies
- 9.4.2. Hospitals and Diagnostic Centers
- 9.4.3. Others
- 9.1. Market Analysis, Insights and Forecast - by Product Type
- 10. Middle East and Africa RNA Analytics Industry Analysis, Insights and Forecast, 2020-2032
- 10.1. Market Analysis, Insights and Forecast - by Product Type
- 10.1.1. Reagents/Consumables
- 10.1.2. Instruments
- 10.1.3. Other Product Types
- 10.2. Market Analysis, Insights and Forecast - by Technology
- 10.2.1. Microarrays
- 10.2.2. Sequencing
- 10.2.3. Polymerase Chain Reaction (PCR)
- 10.2.4. Others
- 10.3. Market Analysis, Insights and Forecast - by Application
- 10.3.1. Clinical Diagnostics
- 10.3.2. Drug Discovery
- 10.3.3. Toxicogenomic
- 10.3.4. Other Applications
- 10.4. Market Analysis, Insights and Forecast - by End User
- 10.4.1. Pharmaceutical & Biotechnology Companies
- 10.4.2. Hospitals and Diagnostic Centers
- 10.4.3. Others
- 10.1. Market Analysis, Insights and Forecast - by Product Type
- 11. South America RNA Analytics Industry Analysis, Insights and Forecast, 2020-2032
- 11.1. Market Analysis, Insights and Forecast - by Product Type
- 11.1.1. Reagents/Consumables
- 11.1.2. Instruments
- 11.1.3. Other Product Types
- 11.2. Market Analysis, Insights and Forecast - by Technology
- 11.2.1. Microarrays
- 11.2.2. Sequencing
- 11.2.3. Polymerase Chain Reaction (PCR)
- 11.2.4. Others
- 11.3. Market Analysis, Insights and Forecast - by Application
- 11.3.1. Clinical Diagnostics
- 11.3.2. Drug Discovery
- 11.3.3. Toxicogenomic
- 11.3.4. Other Applications
- 11.4. Market Analysis, Insights and Forecast - by End User
- 11.4.1. Pharmaceutical & Biotechnology Companies
- 11.4.2. Hospitals and Diagnostic Centers
- 11.4.3. Others
- 11.1. Market Analysis, Insights and Forecast - by Product Type
- 12. Competitive Analysis
- 12.1. Company Profiles
- 12.1.1 IlluminaInc
- 12.1.1.1. Company Overview
- 12.1.1.2. Products
- 12.1.1.3. Company Financials
- 12.1.1.4. SWOT Analysis
- 12.1.2 Promega Corporation
- 12.1.2.1. Company Overview
- 12.1.2.2. Products
- 12.1.2.3. Company Financials
- 12.1.2.4. SWOT Analysis
- 12.1.3 Bio-Rad Laboratories Inc
- 12.1.3.1. Company Overview
- 12.1.3.2. Products
- 12.1.3.3. Company Financials
- 12.1.3.4. SWOT Analysis
- 12.1.4 Merck KGaA
- 12.1.4.1. Company Overview
- 12.1.4.2. Products
- 12.1.4.3. Company Financials
- 12.1.4.4. SWOT Analysis
- 12.1.5 F Hoffmann-La Roche Ltd
- 12.1.5.1. Company Overview
- 12.1.5.2. Products
- 12.1.5.3. Company Financials
- 12.1.5.4. SWOT Analysis
- 12.1.6 Eurofins Scientific
- 12.1.6.1. Company Overview
- 12.1.6.2. Products
- 12.1.6.3. Company Financials
- 12.1.6.4. SWOT Analysis
- 12.1.7 Agilent Technologies Inc
- 12.1.7.1. Company Overview
- 12.1.7.2. Products
- 12.1.7.3. Company Financials
- 12.1.7.4. SWOT Analysis
- 12.1.8 LC Sciences
- 12.1.8.1. Company Overview
- 12.1.8.2. Products
- 12.1.8.3. Company Financials
- 12.1.8.4. SWOT Analysis
- 12.1.9 GenXPro GmbH
- 12.1.9.1. Company Overview
- 12.1.9.2. Products
- 12.1.9.3. Company Financials
- 12.1.9.4. SWOT Analysis
- 12.1.10 BioMérieux SA
- 12.1.10.1. Company Overview
- 12.1.10.2. Products
- 12.1.10.3. Company Financials
- 12.1.10.4. SWOT Analysis
- 12.1.11 Thermo Fisher Scientific
- 12.1.11.1. Company Overview
- 12.1.11.2. Products
- 12.1.11.3. Company Financials
- 12.1.11.4. SWOT Analysis
- 12.1.12 QIAGEN
- 12.1.12.1. Company Overview
- 12.1.12.2. Products
- 12.1.12.3. Company Financials
- 12.1.12.4. SWOT Analysis
- 12.1.1 IlluminaInc
- 12.2. Market Entropy
- 12.2.1 Company's Key Areas Served
- 12.2.2 Recent Developments
- 12.3. Company Market Share Analysis 2025
- 12.3.1 Top 5 Companies Market Share Analysis
- 12.3.2 Top 3 Companies Market Share Analysis
- 12.4. List of Potential Customers
- 13. Research Methodology
List of Figures
- Figure 1: Global RNA Analytics Industry Revenue Breakdown (billion, %) by Region 2025 & 2033
- Figure 2: Global RNA Analytics Industry Volume Breakdown (K Unit, %) by Region 2025 & 2033
- Figure 3: North America RNA Analytics Industry Revenue (billion), by Product Type 2025 & 2033
- Figure 4: North America RNA Analytics Industry Volume (K Unit), by Product Type 2025 & 2033
- Figure 5: North America RNA Analytics Industry Revenue Share (%), by Product Type 2025 & 2033
- Figure 6: North America RNA Analytics Industry Volume Share (%), by Product Type 2025 & 2033
- Figure 7: North America RNA Analytics Industry Revenue (billion), by Technology 2025 & 2033
- Figure 8: North America RNA Analytics Industry Volume (K Unit), by Technology 2025 & 2033
- Figure 9: North America RNA Analytics Industry Revenue Share (%), by Technology 2025 & 2033
- Figure 10: North America RNA Analytics Industry Volume Share (%), by Technology 2025 & 2033
- Figure 11: North America RNA Analytics Industry Revenue (billion), by Application 2025 & 2033
- Figure 12: North America RNA Analytics Industry Volume (K Unit), by Application 2025 & 2033
- Figure 13: North America RNA Analytics Industry Revenue Share (%), by Application 2025 & 2033
- Figure 14: North America RNA Analytics Industry Volume Share (%), by Application 2025 & 2033
- Figure 15: North America RNA Analytics Industry Revenue (billion), by End User 2025 & 2033
- Figure 16: North America RNA Analytics Industry Volume (K Unit), by End User 2025 & 2033
- Figure 17: North America RNA Analytics Industry Revenue Share (%), by End User 2025 & 2033
- Figure 18: North America RNA Analytics Industry Volume Share (%), by End User 2025 & 2033
- Figure 19: North America RNA Analytics Industry Revenue (billion), by Country 2025 & 2033
- Figure 20: North America RNA Analytics Industry Volume (K Unit), by Country 2025 & 2033
- Figure 21: North America RNA Analytics Industry Revenue Share (%), by Country 2025 & 2033
- Figure 22: North America RNA Analytics Industry Volume Share (%), by Country 2025 & 2033
- Figure 23: Europe RNA Analytics Industry Revenue (billion), by Product Type 2025 & 2033
- Figure 24: Europe RNA Analytics Industry Volume (K Unit), by Product Type 2025 & 2033
- Figure 25: Europe RNA Analytics Industry Revenue Share (%), by Product Type 2025 & 2033
- Figure 26: Europe RNA Analytics Industry Volume Share (%), by Product Type 2025 & 2033
- Figure 27: Europe RNA Analytics Industry Revenue (billion), by Technology 2025 & 2033
- Figure 28: Europe RNA Analytics Industry Volume (K Unit), by Technology 2025 & 2033
- Figure 29: Europe RNA Analytics Industry Revenue Share (%), by Technology 2025 & 2033
- Figure 30: Europe RNA Analytics Industry Volume Share (%), by Technology 2025 & 2033
- Figure 31: Europe RNA Analytics Industry Revenue (billion), by Application 2025 & 2033
- Figure 32: Europe RNA Analytics Industry Volume (K Unit), by Application 2025 & 2033
- Figure 33: Europe RNA Analytics Industry Revenue Share (%), by Application 2025 & 2033
- Figure 34: Europe RNA Analytics Industry Volume Share (%), by Application 2025 & 2033
- Figure 35: Europe RNA Analytics Industry Revenue (billion), by End User 2025 & 2033
- Figure 36: Europe RNA Analytics Industry Volume (K Unit), by End User 2025 & 2033
- Figure 37: Europe RNA Analytics Industry Revenue Share (%), by End User 2025 & 2033
- Figure 38: Europe RNA Analytics Industry Volume Share (%), by End User 2025 & 2033
- Figure 39: Europe RNA Analytics Industry Revenue (billion), by Country 2025 & 2033
- Figure 40: Europe RNA Analytics Industry Volume (K Unit), by Country 2025 & 2033
- Figure 41: Europe RNA Analytics Industry Revenue Share (%), by Country 2025 & 2033
- Figure 42: Europe RNA Analytics Industry Volume Share (%), by Country 2025 & 2033
- Figure 43: Asia Pacific RNA Analytics Industry Revenue (billion), by Product Type 2025 & 2033
- Figure 44: Asia Pacific RNA Analytics Industry Volume (K Unit), by Product Type 2025 & 2033
- Figure 45: Asia Pacific RNA Analytics Industry Revenue Share (%), by Product Type 2025 & 2033
- Figure 46: Asia Pacific RNA Analytics Industry Volume Share (%), by Product Type 2025 & 2033
- Figure 47: Asia Pacific RNA Analytics Industry Revenue (billion), by Technology 2025 & 2033
- Figure 48: Asia Pacific RNA Analytics Industry Volume (K Unit), by Technology 2025 & 2033
- Figure 49: Asia Pacific RNA Analytics Industry Revenue Share (%), by Technology 2025 & 2033
- Figure 50: Asia Pacific RNA Analytics Industry Volume Share (%), by Technology 2025 & 2033
- Figure 51: Asia Pacific RNA Analytics Industry Revenue (billion), by Application 2025 & 2033
- Figure 52: Asia Pacific RNA Analytics Industry Volume (K Unit), by Application 2025 & 2033
- Figure 53: Asia Pacific RNA Analytics Industry Revenue Share (%), by Application 2025 & 2033
- Figure 54: Asia Pacific RNA Analytics Industry Volume Share (%), by Application 2025 & 2033
- Figure 55: Asia Pacific RNA Analytics Industry Revenue (billion), by End User 2025 & 2033
- Figure 56: Asia Pacific RNA Analytics Industry Volume (K Unit), by End User 2025 & 2033
- Figure 57: Asia Pacific RNA Analytics Industry Revenue Share (%), by End User 2025 & 2033
- Figure 58: Asia Pacific RNA Analytics Industry Volume Share (%), by End User 2025 & 2033
- Figure 59: Asia Pacific RNA Analytics Industry Revenue (billion), by Country 2025 & 2033
- Figure 60: Asia Pacific RNA Analytics Industry Volume (K Unit), by Country 2025 & 2033
- Figure 61: Asia Pacific RNA Analytics Industry Revenue Share (%), by Country 2025 & 2033
- Figure 62: Asia Pacific RNA Analytics Industry Volume Share (%), by Country 2025 & 2033
- Figure 63: Middle East and Africa RNA Analytics Industry Revenue (billion), by Product Type 2025 & 2033
- Figure 64: Middle East and Africa RNA Analytics Industry Volume (K Unit), by Product Type 2025 & 2033
- Figure 65: Middle East and Africa RNA Analytics Industry Revenue Share (%), by Product Type 2025 & 2033
- Figure 66: Middle East and Africa RNA Analytics Industry Volume Share (%), by Product Type 2025 & 2033
- Figure 67: Middle East and Africa RNA Analytics Industry Revenue (billion), by Technology 2025 & 2033
- Figure 68: Middle East and Africa RNA Analytics Industry Volume (K Unit), by Technology 2025 & 2033
- Figure 69: Middle East and Africa RNA Analytics Industry Revenue Share (%), by Technology 2025 & 2033
- Figure 70: Middle East and Africa RNA Analytics Industry Volume Share (%), by Technology 2025 & 2033
- Figure 71: Middle East and Africa RNA Analytics Industry Revenue (billion), by Application 2025 & 2033
- Figure 72: Middle East and Africa RNA Analytics Industry Volume (K Unit), by Application 2025 & 2033
- Figure 73: Middle East and Africa RNA Analytics Industry Revenue Share (%), by Application 2025 & 2033
- Figure 74: Middle East and Africa RNA Analytics Industry Volume Share (%), by Application 2025 & 2033
- Figure 75: Middle East and Africa RNA Analytics Industry Revenue (billion), by End User 2025 & 2033
- Figure 76: Middle East and Africa RNA Analytics Industry Volume (K Unit), by End User 2025 & 2033
- Figure 77: Middle East and Africa RNA Analytics Industry Revenue Share (%), by End User 2025 & 2033
- Figure 78: Middle East and Africa RNA Analytics Industry Volume Share (%), by End User 2025 & 2033
- Figure 79: Middle East and Africa RNA Analytics Industry Revenue (billion), by Country 2025 & 2033
- Figure 80: Middle East and Africa RNA Analytics Industry Volume (K Unit), by Country 2025 & 2033
- Figure 81: Middle East and Africa RNA Analytics Industry Revenue Share (%), by Country 2025 & 2033
- Figure 82: Middle East and Africa RNA Analytics Industry Volume Share (%), by Country 2025 & 2033
- Figure 83: South America RNA Analytics Industry Revenue (billion), by Product Type 2025 & 2033
- Figure 84: South America RNA Analytics Industry Volume (K Unit), by Product Type 2025 & 2033
- Figure 85: South America RNA Analytics Industry Revenue Share (%), by Product Type 2025 & 2033
- Figure 86: South America RNA Analytics Industry Volume Share (%), by Product Type 2025 & 2033
- Figure 87: South America RNA Analytics Industry Revenue (billion), by Technology 2025 & 2033
- Figure 88: South America RNA Analytics Industry Volume (K Unit), by Technology 2025 & 2033
- Figure 89: South America RNA Analytics Industry Revenue Share (%), by Technology 2025 & 2033
- Figure 90: South America RNA Analytics Industry Volume Share (%), by Technology 2025 & 2033
- Figure 91: South America RNA Analytics Industry Revenue (billion), by Application 2025 & 2033
- Figure 92: South America RNA Analytics Industry Volume (K Unit), by Application 2025 & 2033
- Figure 93: South America RNA Analytics Industry Revenue Share (%), by Application 2025 & 2033
- Figure 94: South America RNA Analytics Industry Volume Share (%), by Application 2025 & 2033
- Figure 95: South America RNA Analytics Industry Revenue (billion), by End User 2025 & 2033
- Figure 96: South America RNA Analytics Industry Volume (K Unit), by End User 2025 & 2033
- Figure 97: South America RNA Analytics Industry Revenue Share (%), by End User 2025 & 2033
- Figure 98: South America RNA Analytics Industry Volume Share (%), by End User 2025 & 2033
- Figure 99: South America RNA Analytics Industry Revenue (billion), by Country 2025 & 2033
- Figure 100: South America RNA Analytics Industry Volume (K Unit), by Country 2025 & 2033
- Figure 101: South America RNA Analytics Industry Revenue Share (%), by Country 2025 & 2033
- Figure 102: South America RNA Analytics Industry Volume Share (%), by Country 2025 & 2033
List of Tables
- Table 1: Global RNA Analytics Industry Revenue billion Forecast, by Product Type 2020 & 2033
- Table 2: Global RNA Analytics Industry Volume K Unit Forecast, by Product Type 2020 & 2033
- Table 3: Global RNA Analytics Industry Revenue billion Forecast, by Technology 2020 & 2033
- Table 4: Global RNA Analytics Industry Volume K Unit Forecast, by Technology 2020 & 2033
- Table 5: Global RNA Analytics Industry Revenue billion Forecast, by Application 2020 & 2033
- Table 6: Global RNA Analytics Industry Volume K Unit Forecast, by Application 2020 & 2033
- Table 7: Global RNA Analytics Industry Revenue billion Forecast, by End User 2020 & 2033
- Table 8: Global RNA Analytics Industry Volume K Unit Forecast, by End User 2020 & 2033
- Table 9: Global RNA Analytics Industry Revenue billion Forecast, by Region 2020 & 2033
- Table 10: Global RNA Analytics Industry Volume K Unit Forecast, by Region 2020 & 2033
- Table 11: Global RNA Analytics Industry Revenue billion Forecast, by Product Type 2020 & 2033
- Table 12: Global RNA Analytics Industry Volume K Unit Forecast, by Product Type 2020 & 2033
- Table 13: Global RNA Analytics Industry Revenue billion Forecast, by Technology 2020 & 2033
- Table 14: Global RNA Analytics Industry Volume K Unit Forecast, by Technology 2020 & 2033
- Table 15: Global RNA Analytics Industry Revenue billion Forecast, by Application 2020 & 2033
- Table 16: Global RNA Analytics Industry Volume K Unit Forecast, by Application 2020 & 2033
- Table 17: Global RNA Analytics Industry Revenue billion Forecast, by End User 2020 & 2033
- Table 18: Global RNA Analytics Industry Volume K Unit Forecast, by End User 2020 & 2033
- Table 19: Global RNA Analytics Industry Revenue billion Forecast, by Country 2020 & 2033
- Table 20: Global RNA Analytics Industry Volume K Unit Forecast, by Country 2020 & 2033
- Table 21: United States RNA Analytics Industry Revenue (billion) Forecast, by Application 2020 & 2033
- Table 22: United States RNA Analytics Industry Volume (K Unit) Forecast, by Application 2020 & 2033
- Table 23: Canada RNA Analytics Industry Revenue (billion) Forecast, by Application 2020 & 2033
- Table 24: Canada RNA Analytics Industry Volume (K Unit) Forecast, by Application 2020 & 2033
- Table 25: Mexico RNA Analytics Industry Revenue (billion) Forecast, by Application 2020 & 2033
- Table 26: Mexico RNA Analytics Industry Volume (K Unit) Forecast, by Application 2020 & 2033
- Table 27: Global RNA Analytics Industry Revenue billion Forecast, by Product Type 2020 & 2033
- Table 28: Global RNA Analytics Industry Volume K Unit Forecast, by Product Type 2020 & 2033
- Table 29: Global RNA Analytics Industry Revenue billion Forecast, by Technology 2020 & 2033
- Table 30: Global RNA Analytics Industry Volume K Unit Forecast, by Technology 2020 & 2033
- Table 31: Global RNA Analytics Industry Revenue billion Forecast, by Application 2020 & 2033
- Table 32: Global RNA Analytics Industry Volume K Unit Forecast, by Application 2020 & 2033
- Table 33: Global RNA Analytics Industry Revenue billion Forecast, by End User 2020 & 2033
- Table 34: Global RNA Analytics Industry Volume K Unit Forecast, by End User 2020 & 2033
- Table 35: Global RNA Analytics Industry Revenue billion Forecast, by Country 2020 & 2033
- Table 36: Global RNA Analytics Industry Volume K Unit Forecast, by Country 2020 & 2033
- Table 37: Germany RNA Analytics Industry Revenue (billion) Forecast, by Application 2020 & 2033
- Table 38: Germany RNA Analytics Industry Volume (K Unit) Forecast, by Application 2020 & 2033
- Table 39: United Kingdom RNA Analytics Industry Revenue (billion) Forecast, by Application 2020 & 2033
- Table 40: United Kingdom RNA Analytics Industry Volume (K Unit) Forecast, by Application 2020 & 2033
- Table 41: France RNA Analytics Industry Revenue (billion) Forecast, by Application 2020 & 2033
- Table 42: France RNA Analytics Industry Volume (K Unit) Forecast, by Application 2020 & 2033
- Table 43: Italy RNA Analytics Industry Revenue (billion) Forecast, by Application 2020 & 2033
- Table 44: Italy RNA Analytics Industry Volume (K Unit) Forecast, by Application 2020 & 2033
- Table 45: Spain RNA Analytics Industry Revenue (billion) Forecast, by Application 2020 & 2033
- Table 46: Spain RNA Analytics Industry Volume (K Unit) Forecast, by Application 2020 & 2033
- Table 47: Rest of Europe RNA Analytics Industry Revenue (billion) Forecast, by Application 2020 & 2033
- Table 48: Rest of Europe RNA Analytics Industry Volume (K Unit) Forecast, by Application 2020 & 2033
- Table 49: Global RNA Analytics Industry Revenue billion Forecast, by Product Type 2020 & 2033
- Table 50: Global RNA Analytics Industry Volume K Unit Forecast, by Product Type 2020 & 2033
- Table 51: Global RNA Analytics Industry Revenue billion Forecast, by Technology 2020 & 2033
- Table 52: Global RNA Analytics Industry Volume K Unit Forecast, by Technology 2020 & 2033
- Table 53: Global RNA Analytics Industry Revenue billion Forecast, by Application 2020 & 2033
- Table 54: Global RNA Analytics Industry Volume K Unit Forecast, by Application 2020 & 2033
- Table 55: Global RNA Analytics Industry Revenue billion Forecast, by End User 2020 & 2033
- Table 56: Global RNA Analytics Industry Volume K Unit Forecast, by End User 2020 & 2033
- Table 57: Global RNA Analytics Industry Revenue billion Forecast, by Country 2020 & 2033
- Table 58: Global RNA Analytics Industry Volume K Unit Forecast, by Country 2020 & 2033
- Table 59: China RNA Analytics Industry Revenue (billion) Forecast, by Application 2020 & 2033
- Table 60: China RNA Analytics Industry Volume (K Unit) Forecast, by Application 2020 & 2033
- Table 61: Japan RNA Analytics Industry Revenue (billion) Forecast, by Application 2020 & 2033
- Table 62: Japan RNA Analytics Industry Volume (K Unit) Forecast, by Application 2020 & 2033
- Table 63: India RNA Analytics Industry Revenue (billion) Forecast, by Application 2020 & 2033
- Table 64: India RNA Analytics Industry Volume (K Unit) Forecast, by Application 2020 & 2033
- Table 65: Australia RNA Analytics Industry Revenue (billion) Forecast, by Application 2020 & 2033
- Table 66: Australia RNA Analytics Industry Volume (K Unit) Forecast, by Application 2020 & 2033
- Table 67: South Korea RNA Analytics Industry Revenue (billion) Forecast, by Application 2020 & 2033
- Table 68: South Korea RNA Analytics Industry Volume (K Unit) Forecast, by Application 2020 & 2033
- Table 69: Rest of Asia Pacific RNA Analytics Industry Revenue (billion) Forecast, by Application 2020 & 2033
- Table 70: Rest of Asia Pacific RNA Analytics Industry Volume (K Unit) Forecast, by Application 2020 & 2033
- Table 71: Global RNA Analytics Industry Revenue billion Forecast, by Product Type 2020 & 2033
- Table 72: Global RNA Analytics Industry Volume K Unit Forecast, by Product Type 2020 & 2033
- Table 73: Global RNA Analytics Industry Revenue billion Forecast, by Technology 2020 & 2033
- Table 74: Global RNA Analytics Industry Volume K Unit Forecast, by Technology 2020 & 2033
- Table 75: Global RNA Analytics Industry Revenue billion Forecast, by Application 2020 & 2033
- Table 76: Global RNA Analytics Industry Volume K Unit Forecast, by Application 2020 & 2033
- Table 77: Global RNA Analytics Industry Revenue billion Forecast, by End User 2020 & 2033
- Table 78: Global RNA Analytics Industry Volume K Unit Forecast, by End User 2020 & 2033
- Table 79: Global RNA Analytics Industry Revenue billion Forecast, by Country 2020 & 2033
- Table 80: Global RNA Analytics Industry Volume K Unit Forecast, by Country 2020 & 2033
- Table 81: GCC RNA Analytics Industry Revenue (billion) Forecast, by Application 2020 & 2033
- Table 82: GCC RNA Analytics Industry Volume (K Unit) Forecast, by Application 2020 & 2033
- Table 83: South Africa RNA Analytics Industry Revenue (billion) Forecast, by Application 2020 & 2033
- Table 84: South Africa RNA Analytics Industry Volume (K Unit) Forecast, by Application 2020 & 2033
- Table 85: Rest of Middle East and Africa RNA Analytics Industry Revenue (billion) Forecast, by Application 2020 & 2033
- Table 86: Rest of Middle East and Africa RNA Analytics Industry Volume (K Unit) Forecast, by Application 2020 & 2033
- Table 87: Global RNA Analytics Industry Revenue billion Forecast, by Product Type 2020 & 2033
- Table 88: Global RNA Analytics Industry Volume K Unit Forecast, by Product Type 2020 & 2033
- Table 89: Global RNA Analytics Industry Revenue billion Forecast, by Technology 2020 & 2033
- Table 90: Global RNA Analytics Industry Volume K Unit Forecast, by Technology 2020 & 2033
- Table 91: Global RNA Analytics Industry Revenue billion Forecast, by Application 2020 & 2033
- Table 92: Global RNA Analytics Industry Volume K Unit Forecast, by Application 2020 & 2033
- Table 93: Global RNA Analytics Industry Revenue billion Forecast, by End User 2020 & 2033
- Table 94: Global RNA Analytics Industry Volume K Unit Forecast, by End User 2020 & 2033
- Table 95: Global RNA Analytics Industry Revenue billion Forecast, by Country 2020 & 2033
- Table 96: Global RNA Analytics Industry Volume K Unit Forecast, by Country 2020 & 2033
- Table 97: Brazil RNA Analytics Industry Revenue (billion) Forecast, by Application 2020 & 2033
- Table 98: Brazil RNA Analytics Industry Volume (K Unit) Forecast, by Application 2020 & 2033
- Table 99: Argentina RNA Analytics Industry Revenue (billion) Forecast, by Application 2020 & 2033
- Table 100: Argentina RNA Analytics Industry Volume (K Unit) Forecast, by Application 2020 & 2033
- Table 101: Rest of South America RNA Analytics Industry Revenue (billion) Forecast, by Application 2020 & 2033
- Table 102: Rest of South America RNA Analytics Industry Volume (K Unit) Forecast, by Application 2020 & 2033
Frequently Asked Questions
1. What is the projected Compound Annual Growth Rate (CAGR) of the RNA Analytics Industry?
The projected CAGR is approximately 17.1%.
2. Which companies are prominent players in the RNA Analytics Industry?
Key companies in the market include IlluminaInc, Promega Corporation, Bio-Rad Laboratories Inc, Merck KGaA, F Hoffmann-La Roche Ltd, Eurofins Scientific, Agilent Technologies Inc, LC Sciences, GenXPro GmbH, BioMérieux SA, Thermo Fisher Scientific, QIAGEN.
3. What are the main segments of the RNA Analytics Industry?
The market segments include Product Type, Technology, Application, End User.
4. Can you provide details about the market size?
The market size is estimated to be USD 8.8 billion as of 2022.
5. What are some drivers contributing to market growth?
Rising RNA Analysis in Cancer Personalized or Precision Medicine; Growing Applications of RNA Sequencing in Transcriptomics.
6. What are the notable trends driving market growth?
Reagents/Consumables Segment is Expected to Hold a Significant Share.
7. Are there any restraints impacting market growth?
High Cost Associated With Platforms; High Capital Investments for Research and Development.
8. Can you provide examples of recent developments in the market?
June 2022: Bio-Rad Laboratories, Inc. launched the SEQuoia Express Stranded RNA Library Prep Kit. The kit provides biopharmaceutical and research scientists with an easy-to-use solution for constructing robust libraries to support efficient RNA-Sequencing workflows for comprehensive transcriptome profiling.
9. What pricing options are available for accessing the report?
Pricing options include single-user, multi-user, and enterprise licenses priced at USD 4750, USD 5250, and USD 8750 respectively.
10. Is the market size provided in terms of value or volume?
The market size is provided in terms of value, measured in billion and volume, measured in K Unit.
11. Are there any specific market keywords associated with the report?
Yes, the market keyword associated with the report is "RNA Analytics Industry," which aids in identifying and referencing the specific market segment covered.
12. How do I determine which pricing option suits my needs best?
The pricing options vary based on user requirements and access needs. Individual users may opt for single-user licenses, while businesses requiring broader access may choose multi-user or enterprise licenses for cost-effective access to the report.
13. Are there any additional resources or data provided in the RNA Analytics Industry report?
While the report offers comprehensive insights, it's advisable to review the specific contents or supplementary materials provided to ascertain if additional resources or data are available.
14. How can I stay updated on further developments or reports in the RNA Analytics Industry?
To stay informed about further developments, trends, and reports in the RNA Analytics Industry, consider subscribing to industry newsletters, following relevant companies and organizations, or regularly checking reputable industry news sources and publications.
Methodology
Step 1 - Identification of Relevant Samples Size from Population Database


Step 2 - Approaches for Defining Global Market Size (Value, Volume* & Price*)

Note*: In applicable scenarios
Step 3 - Data Sources
Primary Research
- Web Analytics
- Survey Reports
- Research Institute
- Latest Research Reports
- Opinion Leaders
Secondary Research
- Annual Reports
- White Paper
- Latest Press Release
- Industry Association
- Paid Database
- Investor Presentations

Step 4 - Data Triangulation
Involves using different sources of information in order to increase the validity of a study
These sources are likely to be stakeholders in a program - participants, other researchers, program staff, other community members, and so on.
Then we put all data in single framework & apply various statistical tools to find out the dynamic on the market.
During the analysis stage, feedback from the stakeholder groups would be compared to determine areas of agreement as well as areas of divergence