

Key Insights
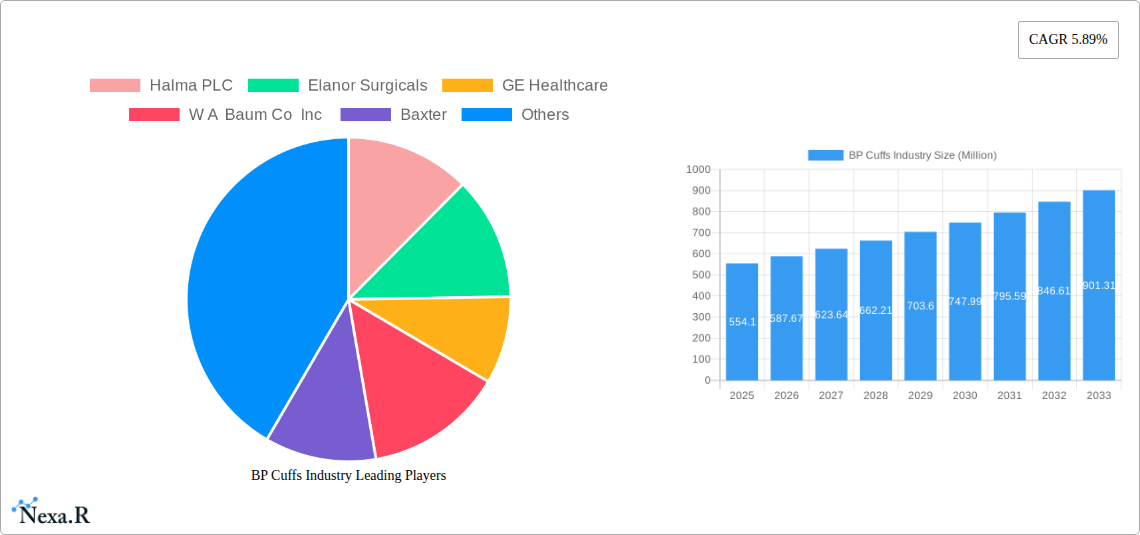
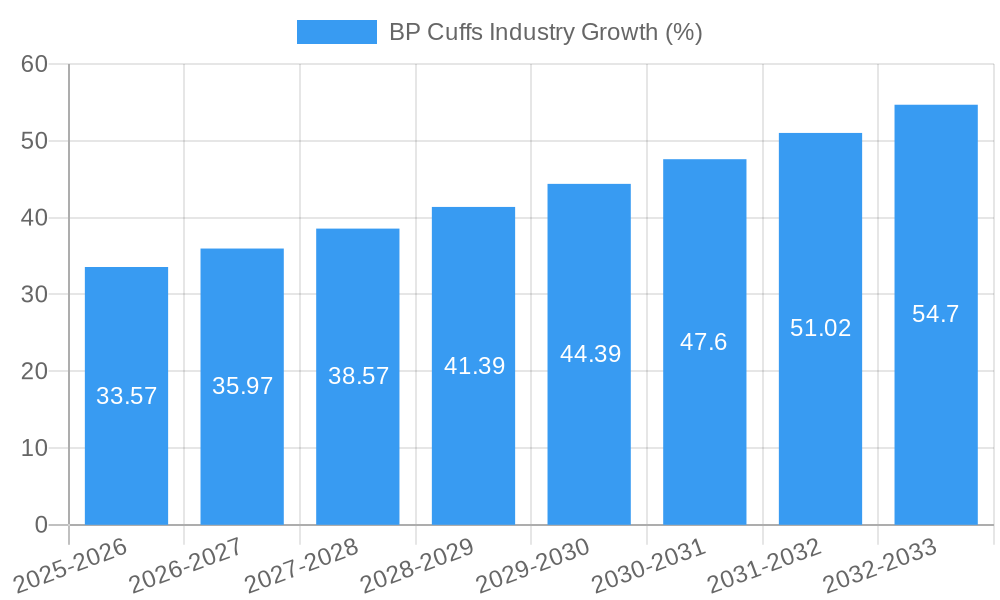
The global blood pressure (BP) cuffs market, valued at $554.10 million in 2025, is projected to experience robust growth, driven by a rising prevalence of hypertension globally, an aging population increasingly requiring regular BP monitoring, and technological advancements in automated and reusable cuffs. The market's Compound Annual Growth Rate (CAGR) of 5.89% from 2025 to 2033 indicates substantial expansion over the forecast period. Key growth drivers include the increasing adoption of home blood pressure monitoring devices, fueled by greater patient empowerment and telehealth initiatives. The rising demand for accurate and reliable BP measurement in hospitals and clinics also contributes significantly to market growth. Furthermore, the shift toward reusable cuffs to reduce healthcare waste and costs is a notable trend. However, market growth might be slightly restrained by the relatively high cost of automated BP cuffs compared to manual ones and the potential for variations in measurement accuracy across different devices. The market is segmented by usage (reusable and disposable), product type (manual and automated), and end-user (hospitals, clinics, and other end-users). Major players like Halma PLC, GE Healthcare, and Omron Healthcare are shaping the market with innovative products and strategic partnerships. Regional growth is expected to be diverse, with North America and Europe maintaining significant market shares due to established healthcare infrastructure and high prevalence of hypertension. However, rapidly developing economies in Asia Pacific and other regions are expected to witness significant growth owing to increasing healthcare spending and rising awareness of cardiovascular diseases.
The competitive landscape is characterized by both established players and emerging companies focusing on technological innovation, product differentiation, and strategic acquisitions to enhance their market presence. The introduction of connected BP cuffs with digital health integration further fuels market expansion, providing valuable data for better patient management and remote monitoring. However, stringent regulatory approvals and the need for maintaining high accuracy standards are challenges that manufacturers must address. The market's growth trajectory is strongly linked to advancements in sensor technology, improved data analytics capabilities, and the increasing integration of BP cuffs into broader telehealth ecosystems. The focus is shifting toward user-friendly designs, improved accuracy, and cost-effectiveness, which will influence the development and adoption of BP cuffs in the years to come.
BP Cuffs Industry: A Comprehensive Market Report (2019-2033)
This in-depth report provides a comprehensive analysis of the BP Cuffs industry, encompassing market dynamics, growth trends, competitive landscape, and future outlook. With a focus on both parent and child markets, this report is an invaluable resource for industry professionals, investors, and strategists seeking to navigate this evolving sector. The study period covers 2019-2033, with 2025 as the base and estimated year. The forecast period spans 2025-2033, and the historical period encompasses 2019-2024. The market size is presented in million units.
BP Cuffs Industry Market Dynamics & Structure
The BP Cuffs market, valued at xx million units in 2024, is characterized by a moderately concentrated landscape with key players holding significant market share. Technological innovation, driven by advancements in sensor technology and digital connectivity, is a major driver of growth. Stringent regulatory frameworks governing medical devices influence product development and market access. Competitive pressure stems from both established players and new entrants offering innovative products. The market is segmented by usage (reusable and disposable), product type (manual and automated), and end-user (hospitals, clinics, and other end-users). M&A activity within the sector remains relatively moderate, with xx major deals recorded between 2019 and 2024.
- Market Concentration: Moderately concentrated, with top 5 players holding approximately xx% market share in 2024.
- Technological Innovation: Focus on miniaturization, wireless connectivity, and integration with telehealth platforms.
- Regulatory Framework: Compliance with FDA (US) and CE (Europe) regulations is crucial.
- Competitive Substitutes: Home blood pressure monitors, wearable health trackers pose indirect competition.
- End-User Demographics: Aging population and rising prevalence of hypertension are key growth drivers.
- M&A Trends: Consolidation expected to increase, driven by economies of scale and expansion into new markets.
BP Cuffs Industry Growth Trends & Insights
The global BP Cuffs market exhibits robust growth, driven by factors such as the increasing prevalence of hypertension, rising geriatric population, growing demand for home healthcare monitoring, and technological advancements in blood pressure monitoring devices. The market is projected to register a CAGR of xx% during the forecast period (2025-2033), reaching xx million units by 2033. Market penetration is highest in developed regions, but growth potential lies significantly in emerging economies. Technological disruptions, particularly the integration of smart technology and AI-powered diagnostic capabilities, are transforming the market landscape, leading to increased accuracy and user convenience. Consumer behavior is shifting towards preference for user-friendly, connected devices that provide real-time data and remote monitoring capabilities.
Dominant Regions, Countries, or Segments in BP Cuffs Industry
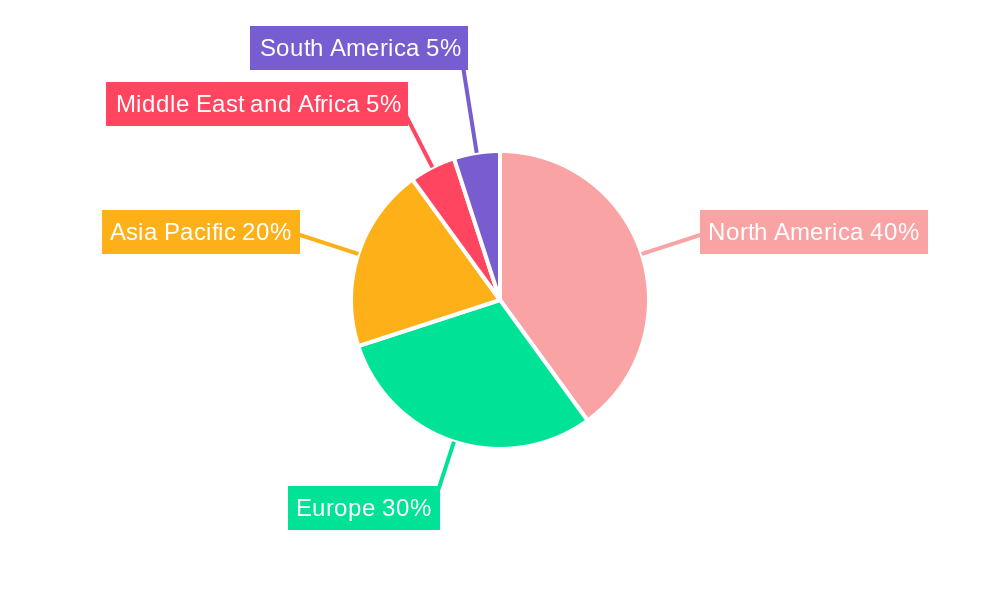
North America currently dominates the BP Cuffs market, owing to high healthcare expenditure, advanced healthcare infrastructure, and a large aging population. However, the Asia-Pacific region is projected to witness the fastest growth rate during the forecast period, driven by rapid economic growth, rising disposable incomes, and increasing awareness of hypertension. Within product segments, the automated BP cuffs segment is experiencing significant growth, driven by its ease of use and accuracy. Disposable cuffs are also gaining traction due to hygiene considerations and single-use convenience. Hospitals remain the largest end-users, followed by clinics and other healthcare settings.
- North America: High adoption rates, strong regulatory environment, advanced healthcare infrastructure.
- Asia-Pacific: Fastest-growing region, driven by rising healthcare spending and increasing awareness.
- Europe: Stable growth, driven by aging population and established healthcare systems.
- Automated BP Cuffs: Increased demand for convenience and accuracy.
- Disposable Cuffs: Growth fueled by hygiene concerns and single-use preference.
BP Cuffs Industry Product Landscape
The BP Cuffs market offers a diverse range of products, from basic manual cuffs to advanced automated and connected devices. Recent innovations include cuffs with improved accuracy, integrated Bluetooth connectivity for data transmission to smartphones and cloud platforms, and adjustable cuffs for better patient comfort and accurate readings. Many manufacturers are focusing on enhancing user experience through intuitive interfaces, compact designs, and integration with health management apps. Key features include improved accuracy, user-friendly interfaces, and wireless connectivity.
Key Drivers, Barriers & Challenges in BP Cuffs Industry
Key Drivers:
- Increasing prevalence of hypertension globally.
- Growing demand for home healthcare monitoring.
- Technological advancements leading to improved accuracy and convenience.
- Rising geriatric population.
- Government initiatives promoting preventative healthcare.
Key Challenges:
- Intense competition from established and emerging players.
- Stringent regulatory requirements for medical devices.
- Potential supply chain disruptions affecting raw material availability and manufacturing.
- Price sensitivity in certain markets.
- The need for continuous innovation to stay competitive.
Emerging Opportunities in BP Cuffs Industry
- Expansion into untapped markets in developing countries.
- Development of integrated blood pressure monitoring systems.
- Integration of AI and machine learning for improved diagnostics.
- Development of wearable and portable BP cuffs.
- Focus on personalized medicine and patient-specific solutions.
Growth Accelerators in the BP Cuffs Industry
Technological advancements, such as the integration of AI and machine learning for improved diagnostic capabilities, are key growth catalysts. Strategic partnerships between medical device manufacturers and telehealth providers will enhance market penetration and access. Expansion into emerging markets with high prevalence of hypertension will drive significant growth.
Key Players Shaping the BP Cuffs Industry Market
- Halma PLC
- Elanor Surgicals
- GE Healthcare
- W A Baum Co Inc
- Baxter
- Spengler SAS
- Cardinal Health
- Koninklijke Philips NV
- Omron Healthcare Inc
- Spacelabs Healthcare
- American Diagnostic Corporation
- Medline Industries Inc
Notable Milestones in BP Cuffs Industry Sector
- September 2022: Garmin launched a smart blood pressure monitor with adjustable cuffs.
- February 2022: Inbody introduced the BP 170 one-touch automatic blood pressure cuff monitor.
In-Depth BP Cuffs Industry Market Outlook
The BP Cuffs market is poised for sustained growth, driven by technological innovation, rising healthcare spending, and the increasing prevalence of hypertension globally. Strategic partnerships, market expansion into emerging economies, and a focus on developing user-friendly, connected devices will create significant opportunities for market players. The integration of AI and machine learning will further enhance the accuracy and efficiency of blood pressure monitoring, leading to improved patient outcomes and a larger market size in the coming years.
BP Cuffs Industry Segmentation
-
1. Usage
- 1.1. Reusable
- 1.2. Disposable
-
2. Product Type
- 2.1. Manual
- 2.2. Automated
-
3. End User
- 3.1. Hospitals
- 3.2. Clinics
- 3.3. Other End Users
BP Cuffs Industry Segmentation By Geography
-
1. North America
- 1.1. United States
- 1.2. Canada
- 1.3. Mexico
-
2. Europe
- 2.1. Germany
- 2.2. United Kingdom
- 2.3. France
- 2.4. Italy
- 2.5. Spain
- 2.6. Rest of Europe
-
3. Asia Pacific
- 3.1. China
- 3.2. Japan
- 3.3. India
- 3.4. Australia
- 3.5. South Korea
- 3.6. Rest of Asia Pacific
-
4. Middle East and Africa
- 4.1. GCC
- 4.2. South Africa
- 4.3. Rest of Middle East and Africa
-
5. South America
- 5.1. Brazil
- 5.2. Argentina
- 5.3. Rest of South America
BP Cuffs Industry REPORT HIGHLIGHTS
| Aspects | Details |
|---|---|
| Study Period | 2019-2033 |
| Base Year | 2024 |
| Estimated Year | 2025 |
| Forecast Period | 2025-2033 |
| Historical Period | 2019-2024 |
| Growth Rate | CAGR of 5.89% from 2019-2033 |
| Segmentation |
|
Table of Contents
- 1. Introduction
- 1.1. Research Scope
- 1.2. Market Segmentation
- 1.3. Research Methodology
- 1.4. Definitions and Assumptions
- 2. Executive Summary
- 2.1. Introduction
- 3. Market Dynamics
- 3.1. Introduction
- 3.2. Market Drivers
- 3.2.1. Increasing Prevalence of Hypertension; Growing Demand for Blood Monitoring Devices
- 3.3. Market Restrains
- 3.3.1. Threat of Infection from Reusable BP Cuffs
- 3.4. Market Trends
- 3.4.1. Automated Blood Pressure Cuffs Segment is Expected to Hold a Significant Market Share Over the Forecast Period
- 4. Market Factor Analysis
- 4.1. Porters Five Forces
- 4.2. Supply/Value Chain
- 4.3. PESTEL analysis
- 4.4. Market Entropy
- 4.5. Patent/Trademark Analysis
- 5. Global BP Cuffs Industry Analysis, Insights and Forecast, 2019-2031
- 5.1. Market Analysis, Insights and Forecast - by Usage
- 5.1.1. Reusable
- 5.1.2. Disposable
- 5.2. Market Analysis, Insights and Forecast - by Product Type
- 5.2.1. Manual
- 5.2.2. Automated
- 5.3. Market Analysis, Insights and Forecast - by End User
- 5.3.1. Hospitals
- 5.3.2. Clinics
- 5.3.3. Other End Users
- 5.4. Market Analysis, Insights and Forecast - by Region
- 5.4.1. North America
- 5.4.2. Europe
- 5.4.3. Asia Pacific
- 5.4.4. Middle East and Africa
- 5.4.5. South America
- 5.1. Market Analysis, Insights and Forecast - by Usage
- 6. North America BP Cuffs Industry Analysis, Insights and Forecast, 2019-2031
- 6.1. Market Analysis, Insights and Forecast - by Usage
- 6.1.1. Reusable
- 6.1.2. Disposable
- 6.2. Market Analysis, Insights and Forecast - by Product Type
- 6.2.1. Manual
- 6.2.2. Automated
- 6.3. Market Analysis, Insights and Forecast - by End User
- 6.3.1. Hospitals
- 6.3.2. Clinics
- 6.3.3. Other End Users
- 6.1. Market Analysis, Insights and Forecast - by Usage
- 7. Europe BP Cuffs Industry Analysis, Insights and Forecast, 2019-2031
- 7.1. Market Analysis, Insights and Forecast - by Usage
- 7.1.1. Reusable
- 7.1.2. Disposable
- 7.2. Market Analysis, Insights and Forecast - by Product Type
- 7.2.1. Manual
- 7.2.2. Automated
- 7.3. Market Analysis, Insights and Forecast - by End User
- 7.3.1. Hospitals
- 7.3.2. Clinics
- 7.3.3. Other End Users
- 7.1. Market Analysis, Insights and Forecast - by Usage
- 8. Asia Pacific BP Cuffs Industry Analysis, Insights and Forecast, 2019-2031
- 8.1. Market Analysis, Insights and Forecast - by Usage
- 8.1.1. Reusable
- 8.1.2. Disposable
- 8.2. Market Analysis, Insights and Forecast - by Product Type
- 8.2.1. Manual
- 8.2.2. Automated
- 8.3. Market Analysis, Insights and Forecast - by End User
- 8.3.1. Hospitals
- 8.3.2. Clinics
- 8.3.3. Other End Users
- 8.1. Market Analysis, Insights and Forecast - by Usage
- 9. Middle East and Africa BP Cuffs Industry Analysis, Insights and Forecast, 2019-2031
- 9.1. Market Analysis, Insights and Forecast - by Usage
- 9.1.1. Reusable
- 9.1.2. Disposable
- 9.2. Market Analysis, Insights and Forecast - by Product Type
- 9.2.1. Manual
- 9.2.2. Automated
- 9.3. Market Analysis, Insights and Forecast - by End User
- 9.3.1. Hospitals
- 9.3.2. Clinics
- 9.3.3. Other End Users
- 9.1. Market Analysis, Insights and Forecast - by Usage
- 10. South America BP Cuffs Industry Analysis, Insights and Forecast, 2019-2031
- 10.1. Market Analysis, Insights and Forecast - by Usage
- 10.1.1. Reusable
- 10.1.2. Disposable
- 10.2. Market Analysis, Insights and Forecast - by Product Type
- 10.2.1. Manual
- 10.2.2. Automated
- 10.3. Market Analysis, Insights and Forecast - by End User
- 10.3.1. Hospitals
- 10.3.2. Clinics
- 10.3.3. Other End Users
- 10.1. Market Analysis, Insights and Forecast - by Usage
- 11. North America BP Cuffs Industry Analysis, Insights and Forecast, 2019-2031
- 11.1. Market Analysis, Insights and Forecast - By Country/Sub-region
- 11.1.1 United States
- 11.1.2 Canada
- 11.1.3 Mexico
- 12. Europe BP Cuffs Industry Analysis, Insights and Forecast, 2019-2031
- 12.1. Market Analysis, Insights and Forecast - By Country/Sub-region
- 12.1.1 Germany
- 12.1.2 United Kingdom
- 12.1.3 France
- 12.1.4 Italy
- 12.1.5 Spain
- 12.1.6 Rest of Europe
- 13. Asia Pacific BP Cuffs Industry Analysis, Insights and Forecast, 2019-2031
- 13.1. Market Analysis, Insights and Forecast - By Country/Sub-region
- 13.1.1 China
- 13.1.2 Japan
- 13.1.3 India
- 13.1.4 Australia
- 13.1.5 South Korea
- 13.1.6 Rest of Asia Pacific
- 14. Middle East and Africa BP Cuffs Industry Analysis, Insights and Forecast, 2019-2031
- 14.1. Market Analysis, Insights and Forecast - By Country/Sub-region
- 14.1.1 GCC
- 14.1.2 South Africa
- 14.1.3 Rest of Middle East and Africa
- 15. South America BP Cuffs Industry Analysis, Insights and Forecast, 2019-2031
- 15.1. Market Analysis, Insights and Forecast - By Country/Sub-region
- 15.1.1 Brazil
- 15.1.2 Argentina
- 15.1.3 Rest of South America
- 16. Competitive Analysis
- 16.1. Global Market Share Analysis 2024
- 16.2. Company Profiles
- 16.2.1 Halma PLC
- 16.2.1.1. Overview
- 16.2.1.2. Products
- 16.2.1.3. SWOT Analysis
- 16.2.1.4. Recent Developments
- 16.2.1.5. Financials (Based on Availability)
- 16.2.2 Elanor Surgicals
- 16.2.2.1. Overview
- 16.2.2.2. Products
- 16.2.2.3. SWOT Analysis
- 16.2.2.4. Recent Developments
- 16.2.2.5. Financials (Based on Availability)
- 16.2.3 GE Healthcare
- 16.2.3.1. Overview
- 16.2.3.2. Products
- 16.2.3.3. SWOT Analysis
- 16.2.3.4. Recent Developments
- 16.2.3.5. Financials (Based on Availability)
- 16.2.4 W A Baum Co Inc
- 16.2.4.1. Overview
- 16.2.4.2. Products
- 16.2.4.3. SWOT Analysis
- 16.2.4.4. Recent Developments
- 16.2.4.5. Financials (Based on Availability)
- 16.2.5 Baxter
- 16.2.5.1. Overview
- 16.2.5.2. Products
- 16.2.5.3. SWOT Analysis
- 16.2.5.4. Recent Developments
- 16.2.5.5. Financials (Based on Availability)
- 16.2.6 Spengler SAS
- 16.2.6.1. Overview
- 16.2.6.2. Products
- 16.2.6.3. SWOT Analysis
- 16.2.6.4. Recent Developments
- 16.2.6.5. Financials (Based on Availability)
- 16.2.7 Cardinal Health
- 16.2.7.1. Overview
- 16.2.7.2. Products
- 16.2.7.3. SWOT Analysis
- 16.2.7.4. Recent Developments
- 16.2.7.5. Financials (Based on Availability)
- 16.2.8 Koninklijke Philips NV
- 16.2.8.1. Overview
- 16.2.8.2. Products
- 16.2.8.3. SWOT Analysis
- 16.2.8.4. Recent Developments
- 16.2.8.5. Financials (Based on Availability)
- 16.2.9 Omron Healthcare Inc
- 16.2.9.1. Overview
- 16.2.9.2. Products
- 16.2.9.3. SWOT Analysis
- 16.2.9.4. Recent Developments
- 16.2.9.5. Financials (Based on Availability)
- 16.2.10 Spacelabs Healthcare
- 16.2.10.1. Overview
- 16.2.10.2. Products
- 16.2.10.3. SWOT Analysis
- 16.2.10.4. Recent Developments
- 16.2.10.5. Financials (Based on Availability)
- 16.2.11 American Diagnostic Corporation
- 16.2.11.1. Overview
- 16.2.11.2. Products
- 16.2.11.3. SWOT Analysis
- 16.2.11.4. Recent Developments
- 16.2.11.5. Financials (Based on Availability)
- 16.2.12 Medline Industries Inc
- 16.2.12.1. Overview
- 16.2.12.2. Products
- 16.2.12.3. SWOT Analysis
- 16.2.12.4. Recent Developments
- 16.2.12.5. Financials (Based on Availability)
- 16.2.1 Halma PLC
List of Figures
- Figure 1: Global BP Cuffs Industry Revenue Breakdown (Million, %) by Region 2024 & 2032
- Figure 2: Global BP Cuffs Industry Volume Breakdown (K Unit, %) by Region 2024 & 2032
- Figure 3: North America BP Cuffs Industry Revenue (Million), by Country 2024 & 2032
- Figure 4: North America BP Cuffs Industry Volume (K Unit), by Country 2024 & 2032
- Figure 5: North America BP Cuffs Industry Revenue Share (%), by Country 2024 & 2032
- Figure 6: North America BP Cuffs Industry Volume Share (%), by Country 2024 & 2032
- Figure 7: Europe BP Cuffs Industry Revenue (Million), by Country 2024 & 2032
- Figure 8: Europe BP Cuffs Industry Volume (K Unit), by Country 2024 & 2032
- Figure 9: Europe BP Cuffs Industry Revenue Share (%), by Country 2024 & 2032
- Figure 10: Europe BP Cuffs Industry Volume Share (%), by Country 2024 & 2032
- Figure 11: Asia Pacific BP Cuffs Industry Revenue (Million), by Country 2024 & 2032
- Figure 12: Asia Pacific BP Cuffs Industry Volume (K Unit), by Country 2024 & 2032
- Figure 13: Asia Pacific BP Cuffs Industry Revenue Share (%), by Country 2024 & 2032
- Figure 14: Asia Pacific BP Cuffs Industry Volume Share (%), by Country 2024 & 2032
- Figure 15: Middle East and Africa BP Cuffs Industry Revenue (Million), by Country 2024 & 2032
- Figure 16: Middle East and Africa BP Cuffs Industry Volume (K Unit), by Country 2024 & 2032
- Figure 17: Middle East and Africa BP Cuffs Industry Revenue Share (%), by Country 2024 & 2032
- Figure 18: Middle East and Africa BP Cuffs Industry Volume Share (%), by Country 2024 & 2032
- Figure 19: South America BP Cuffs Industry Revenue (Million), by Country 2024 & 2032
- Figure 20: South America BP Cuffs Industry Volume (K Unit), by Country 2024 & 2032
- Figure 21: South America BP Cuffs Industry Revenue Share (%), by Country 2024 & 2032
- Figure 22: South America BP Cuffs Industry Volume Share (%), by Country 2024 & 2032
- Figure 23: North America BP Cuffs Industry Revenue (Million), by Usage 2024 & 2032
- Figure 24: North America BP Cuffs Industry Volume (K Unit), by Usage 2024 & 2032
- Figure 25: North America BP Cuffs Industry Revenue Share (%), by Usage 2024 & 2032
- Figure 26: North America BP Cuffs Industry Volume Share (%), by Usage 2024 & 2032
- Figure 27: North America BP Cuffs Industry Revenue (Million), by Product Type 2024 & 2032
- Figure 28: North America BP Cuffs Industry Volume (K Unit), by Product Type 2024 & 2032
- Figure 29: North America BP Cuffs Industry Revenue Share (%), by Product Type 2024 & 2032
- Figure 30: North America BP Cuffs Industry Volume Share (%), by Product Type 2024 & 2032
- Figure 31: North America BP Cuffs Industry Revenue (Million), by End User 2024 & 2032
- Figure 32: North America BP Cuffs Industry Volume (K Unit), by End User 2024 & 2032
- Figure 33: North America BP Cuffs Industry Revenue Share (%), by End User 2024 & 2032
- Figure 34: North America BP Cuffs Industry Volume Share (%), by End User 2024 & 2032
- Figure 35: North America BP Cuffs Industry Revenue (Million), by Country 2024 & 2032
- Figure 36: North America BP Cuffs Industry Volume (K Unit), by Country 2024 & 2032
- Figure 37: North America BP Cuffs Industry Revenue Share (%), by Country 2024 & 2032
- Figure 38: North America BP Cuffs Industry Volume Share (%), by Country 2024 & 2032
- Figure 39: Europe BP Cuffs Industry Revenue (Million), by Usage 2024 & 2032
- Figure 40: Europe BP Cuffs Industry Volume (K Unit), by Usage 2024 & 2032
- Figure 41: Europe BP Cuffs Industry Revenue Share (%), by Usage 2024 & 2032
- Figure 42: Europe BP Cuffs Industry Volume Share (%), by Usage 2024 & 2032
- Figure 43: Europe BP Cuffs Industry Revenue (Million), by Product Type 2024 & 2032
- Figure 44: Europe BP Cuffs Industry Volume (K Unit), by Product Type 2024 & 2032
- Figure 45: Europe BP Cuffs Industry Revenue Share (%), by Product Type 2024 & 2032
- Figure 46: Europe BP Cuffs Industry Volume Share (%), by Product Type 2024 & 2032
- Figure 47: Europe BP Cuffs Industry Revenue (Million), by End User 2024 & 2032
- Figure 48: Europe BP Cuffs Industry Volume (K Unit), by End User 2024 & 2032
- Figure 49: Europe BP Cuffs Industry Revenue Share (%), by End User 2024 & 2032
- Figure 50: Europe BP Cuffs Industry Volume Share (%), by End User 2024 & 2032
- Figure 51: Europe BP Cuffs Industry Revenue (Million), by Country 2024 & 2032
- Figure 52: Europe BP Cuffs Industry Volume (K Unit), by Country 2024 & 2032
- Figure 53: Europe BP Cuffs Industry Revenue Share (%), by Country 2024 & 2032
- Figure 54: Europe BP Cuffs Industry Volume Share (%), by Country 2024 & 2032
- Figure 55: Asia Pacific BP Cuffs Industry Revenue (Million), by Usage 2024 & 2032
- Figure 56: Asia Pacific BP Cuffs Industry Volume (K Unit), by Usage 2024 & 2032
- Figure 57: Asia Pacific BP Cuffs Industry Revenue Share (%), by Usage 2024 & 2032
- Figure 58: Asia Pacific BP Cuffs Industry Volume Share (%), by Usage 2024 & 2032
- Figure 59: Asia Pacific BP Cuffs Industry Revenue (Million), by Product Type 2024 & 2032
- Figure 60: Asia Pacific BP Cuffs Industry Volume (K Unit), by Product Type 2024 & 2032
- Figure 61: Asia Pacific BP Cuffs Industry Revenue Share (%), by Product Type 2024 & 2032
- Figure 62: Asia Pacific BP Cuffs Industry Volume Share (%), by Product Type 2024 & 2032
- Figure 63: Asia Pacific BP Cuffs Industry Revenue (Million), by End User 2024 & 2032
- Figure 64: Asia Pacific BP Cuffs Industry Volume (K Unit), by End User 2024 & 2032
- Figure 65: Asia Pacific BP Cuffs Industry Revenue Share (%), by End User 2024 & 2032
- Figure 66: Asia Pacific BP Cuffs Industry Volume Share (%), by End User 2024 & 2032
- Figure 67: Asia Pacific BP Cuffs Industry Revenue (Million), by Country 2024 & 2032
- Figure 68: Asia Pacific BP Cuffs Industry Volume (K Unit), by Country 2024 & 2032
- Figure 69: Asia Pacific BP Cuffs Industry Revenue Share (%), by Country 2024 & 2032
- Figure 70: Asia Pacific BP Cuffs Industry Volume Share (%), by Country 2024 & 2032
- Figure 71: Middle East and Africa BP Cuffs Industry Revenue (Million), by Usage 2024 & 2032
- Figure 72: Middle East and Africa BP Cuffs Industry Volume (K Unit), by Usage 2024 & 2032
- Figure 73: Middle East and Africa BP Cuffs Industry Revenue Share (%), by Usage 2024 & 2032
- Figure 74: Middle East and Africa BP Cuffs Industry Volume Share (%), by Usage 2024 & 2032
- Figure 75: Middle East and Africa BP Cuffs Industry Revenue (Million), by Product Type 2024 & 2032
- Figure 76: Middle East and Africa BP Cuffs Industry Volume (K Unit), by Product Type 2024 & 2032
- Figure 77: Middle East and Africa BP Cuffs Industry Revenue Share (%), by Product Type 2024 & 2032
- Figure 78: Middle East and Africa BP Cuffs Industry Volume Share (%), by Product Type 2024 & 2032
- Figure 79: Middle East and Africa BP Cuffs Industry Revenue (Million), by End User 2024 & 2032
- Figure 80: Middle East and Africa BP Cuffs Industry Volume (K Unit), by End User 2024 & 2032
- Figure 81: Middle East and Africa BP Cuffs Industry Revenue Share (%), by End User 2024 & 2032
- Figure 82: Middle East and Africa BP Cuffs Industry Volume Share (%), by End User 2024 & 2032
- Figure 83: Middle East and Africa BP Cuffs Industry Revenue (Million), by Country 2024 & 2032
- Figure 84: Middle East and Africa BP Cuffs Industry Volume (K Unit), by Country 2024 & 2032
- Figure 85: Middle East and Africa BP Cuffs Industry Revenue Share (%), by Country 2024 & 2032
- Figure 86: Middle East and Africa BP Cuffs Industry Volume Share (%), by Country 2024 & 2032
- Figure 87: South America BP Cuffs Industry Revenue (Million), by Usage 2024 & 2032
- Figure 88: South America BP Cuffs Industry Volume (K Unit), by Usage 2024 & 2032
- Figure 89: South America BP Cuffs Industry Revenue Share (%), by Usage 2024 & 2032
- Figure 90: South America BP Cuffs Industry Volume Share (%), by Usage 2024 & 2032
- Figure 91: South America BP Cuffs Industry Revenue (Million), by Product Type 2024 & 2032
- Figure 92: South America BP Cuffs Industry Volume (K Unit), by Product Type 2024 & 2032
- Figure 93: South America BP Cuffs Industry Revenue Share (%), by Product Type 2024 & 2032
- Figure 94: South America BP Cuffs Industry Volume Share (%), by Product Type 2024 & 2032
- Figure 95: South America BP Cuffs Industry Revenue (Million), by End User 2024 & 2032
- Figure 96: South America BP Cuffs Industry Volume (K Unit), by End User 2024 & 2032
- Figure 97: South America BP Cuffs Industry Revenue Share (%), by End User 2024 & 2032
- Figure 98: South America BP Cuffs Industry Volume Share (%), by End User 2024 & 2032
- Figure 99: South America BP Cuffs Industry Revenue (Million), by Country 2024 & 2032
- Figure 100: South America BP Cuffs Industry Volume (K Unit), by Country 2024 & 2032
- Figure 101: South America BP Cuffs Industry Revenue Share (%), by Country 2024 & 2032
- Figure 102: South America BP Cuffs Industry Volume Share (%), by Country 2024 & 2032
List of Tables
- Table 1: Global BP Cuffs Industry Revenue Million Forecast, by Region 2019 & 2032
- Table 2: Global BP Cuffs Industry Volume K Unit Forecast, by Region 2019 & 2032
- Table 3: Global BP Cuffs Industry Revenue Million Forecast, by Usage 2019 & 2032
- Table 4: Global BP Cuffs Industry Volume K Unit Forecast, by Usage 2019 & 2032
- Table 5: Global BP Cuffs Industry Revenue Million Forecast, by Product Type 2019 & 2032
- Table 6: Global BP Cuffs Industry Volume K Unit Forecast, by Product Type 2019 & 2032
- Table 7: Global BP Cuffs Industry Revenue Million Forecast, by End User 2019 & 2032
- Table 8: Global BP Cuffs Industry Volume K Unit Forecast, by End User 2019 & 2032
- Table 9: Global BP Cuffs Industry Revenue Million Forecast, by Region 2019 & 2032
- Table 10: Global BP Cuffs Industry Volume K Unit Forecast, by Region 2019 & 2032
- Table 11: Global BP Cuffs Industry Revenue Million Forecast, by Country 2019 & 2032
- Table 12: Global BP Cuffs Industry Volume K Unit Forecast, by Country 2019 & 2032
- Table 13: United States BP Cuffs Industry Revenue (Million) Forecast, by Application 2019 & 2032
- Table 14: United States BP Cuffs Industry Volume (K Unit) Forecast, by Application 2019 & 2032
- Table 15: Canada BP Cuffs Industry Revenue (Million) Forecast, by Application 2019 & 2032
- Table 16: Canada BP Cuffs Industry Volume (K Unit) Forecast, by Application 2019 & 2032
- Table 17: Mexico BP Cuffs Industry Revenue (Million) Forecast, by Application 2019 & 2032
- Table 18: Mexico BP Cuffs Industry Volume (K Unit) Forecast, by Application 2019 & 2032
- Table 19: Global BP Cuffs Industry Revenue Million Forecast, by Country 2019 & 2032
- Table 20: Global BP Cuffs Industry Volume K Unit Forecast, by Country 2019 & 2032
- Table 21: Germany BP Cuffs Industry Revenue (Million) Forecast, by Application 2019 & 2032
- Table 22: Germany BP Cuffs Industry Volume (K Unit) Forecast, by Application 2019 & 2032
- Table 23: United Kingdom BP Cuffs Industry Revenue (Million) Forecast, by Application 2019 & 2032
- Table 24: United Kingdom BP Cuffs Industry Volume (K Unit) Forecast, by Application 2019 & 2032
- Table 25: France BP Cuffs Industry Revenue (Million) Forecast, by Application 2019 & 2032
- Table 26: France BP Cuffs Industry Volume (K Unit) Forecast, by Application 2019 & 2032
- Table 27: Italy BP Cuffs Industry Revenue (Million) Forecast, by Application 2019 & 2032
- Table 28: Italy BP Cuffs Industry Volume (K Unit) Forecast, by Application 2019 & 2032
- Table 29: Spain BP Cuffs Industry Revenue (Million) Forecast, by Application 2019 & 2032
- Table 30: Spain BP Cuffs Industry Volume (K Unit) Forecast, by Application 2019 & 2032
- Table 31: Rest of Europe BP Cuffs Industry Revenue (Million) Forecast, by Application 2019 & 2032
- Table 32: Rest of Europe BP Cuffs Industry Volume (K Unit) Forecast, by Application 2019 & 2032
- Table 33: Global BP Cuffs Industry Revenue Million Forecast, by Country 2019 & 2032
- Table 34: Global BP Cuffs Industry Volume K Unit Forecast, by Country 2019 & 2032
- Table 35: China BP Cuffs Industry Revenue (Million) Forecast, by Application 2019 & 2032
- Table 36: China BP Cuffs Industry Volume (K Unit) Forecast, by Application 2019 & 2032
- Table 37: Japan BP Cuffs Industry Revenue (Million) Forecast, by Application 2019 & 2032
- Table 38: Japan BP Cuffs Industry Volume (K Unit) Forecast, by Application 2019 & 2032
- Table 39: India BP Cuffs Industry Revenue (Million) Forecast, by Application 2019 & 2032
- Table 40: India BP Cuffs Industry Volume (K Unit) Forecast, by Application 2019 & 2032
- Table 41: Australia BP Cuffs Industry Revenue (Million) Forecast, by Application 2019 & 2032
- Table 42: Australia BP Cuffs Industry Volume (K Unit) Forecast, by Application 2019 & 2032
- Table 43: South Korea BP Cuffs Industry Revenue (Million) Forecast, by Application 2019 & 2032
- Table 44: South Korea BP Cuffs Industry Volume (K Unit) Forecast, by Application 2019 & 2032
- Table 45: Rest of Asia Pacific BP Cuffs Industry Revenue (Million) Forecast, by Application 2019 & 2032
- Table 46: Rest of Asia Pacific BP Cuffs Industry Volume (K Unit) Forecast, by Application 2019 & 2032
- Table 47: Global BP Cuffs Industry Revenue Million Forecast, by Country 2019 & 2032
- Table 48: Global BP Cuffs Industry Volume K Unit Forecast, by Country 2019 & 2032
- Table 49: GCC BP Cuffs Industry Revenue (Million) Forecast, by Application 2019 & 2032
- Table 50: GCC BP Cuffs Industry Volume (K Unit) Forecast, by Application 2019 & 2032
- Table 51: South Africa BP Cuffs Industry Revenue (Million) Forecast, by Application 2019 & 2032
- Table 52: South Africa BP Cuffs Industry Volume (K Unit) Forecast, by Application 2019 & 2032
- Table 53: Rest of Middle East and Africa BP Cuffs Industry Revenue (Million) Forecast, by Application 2019 & 2032
- Table 54: Rest of Middle East and Africa BP Cuffs Industry Volume (K Unit) Forecast, by Application 2019 & 2032
- Table 55: Global BP Cuffs Industry Revenue Million Forecast, by Country 2019 & 2032
- Table 56: Global BP Cuffs Industry Volume K Unit Forecast, by Country 2019 & 2032
- Table 57: Brazil BP Cuffs Industry Revenue (Million) Forecast, by Application 2019 & 2032
- Table 58: Brazil BP Cuffs Industry Volume (K Unit) Forecast, by Application 2019 & 2032
- Table 59: Argentina BP Cuffs Industry Revenue (Million) Forecast, by Application 2019 & 2032
- Table 60: Argentina BP Cuffs Industry Volume (K Unit) Forecast, by Application 2019 & 2032
- Table 61: Rest of South America BP Cuffs Industry Revenue (Million) Forecast, by Application 2019 & 2032
- Table 62: Rest of South America BP Cuffs Industry Volume (K Unit) Forecast, by Application 2019 & 2032
- Table 63: Global BP Cuffs Industry Revenue Million Forecast, by Usage 2019 & 2032
- Table 64: Global BP Cuffs Industry Volume K Unit Forecast, by Usage 2019 & 2032
- Table 65: Global BP Cuffs Industry Revenue Million Forecast, by Product Type 2019 & 2032
- Table 66: Global BP Cuffs Industry Volume K Unit Forecast, by Product Type 2019 & 2032
- Table 67: Global BP Cuffs Industry Revenue Million Forecast, by End User 2019 & 2032
- Table 68: Global BP Cuffs Industry Volume K Unit Forecast, by End User 2019 & 2032
- Table 69: Global BP Cuffs Industry Revenue Million Forecast, by Country 2019 & 2032
- Table 70: Global BP Cuffs Industry Volume K Unit Forecast, by Country 2019 & 2032
- Table 71: United States BP Cuffs Industry Revenue (Million) Forecast, by Application 2019 & 2032
- Table 72: United States BP Cuffs Industry Volume (K Unit) Forecast, by Application 2019 & 2032
- Table 73: Canada BP Cuffs Industry Revenue (Million) Forecast, by Application 2019 & 2032
- Table 74: Canada BP Cuffs Industry Volume (K Unit) Forecast, by Application 2019 & 2032
- Table 75: Mexico BP Cuffs Industry Revenue (Million) Forecast, by Application 2019 & 2032
- Table 76: Mexico BP Cuffs Industry Volume (K Unit) Forecast, by Application 2019 & 2032
- Table 77: Global BP Cuffs Industry Revenue Million Forecast, by Usage 2019 & 2032
- Table 78: Global BP Cuffs Industry Volume K Unit Forecast, by Usage 2019 & 2032
- Table 79: Global BP Cuffs Industry Revenue Million Forecast, by Product Type 2019 & 2032
- Table 80: Global BP Cuffs Industry Volume K Unit Forecast, by Product Type 2019 & 2032
- Table 81: Global BP Cuffs Industry Revenue Million Forecast, by End User 2019 & 2032
- Table 82: Global BP Cuffs Industry Volume K Unit Forecast, by End User 2019 & 2032
- Table 83: Global BP Cuffs Industry Revenue Million Forecast, by Country 2019 & 2032
- Table 84: Global BP Cuffs Industry Volume K Unit Forecast, by Country 2019 & 2032
- Table 85: Germany BP Cuffs Industry Revenue (Million) Forecast, by Application 2019 & 2032
- Table 86: Germany BP Cuffs Industry Volume (K Unit) Forecast, by Application 2019 & 2032
- Table 87: United Kingdom BP Cuffs Industry Revenue (Million) Forecast, by Application 2019 & 2032
- Table 88: United Kingdom BP Cuffs Industry Volume (K Unit) Forecast, by Application 2019 & 2032
- Table 89: France BP Cuffs Industry Revenue (Million) Forecast, by Application 2019 & 2032
- Table 90: France BP Cuffs Industry Volume (K Unit) Forecast, by Application 2019 & 2032
- Table 91: Italy BP Cuffs Industry Revenue (Million) Forecast, by Application 2019 & 2032
- Table 92: Italy BP Cuffs Industry Volume (K Unit) Forecast, by Application 2019 & 2032
- Table 93: Spain BP Cuffs Industry Revenue (Million) Forecast, by Application 2019 & 2032
- Table 94: Spain BP Cuffs Industry Volume (K Unit) Forecast, by Application 2019 & 2032
- Table 95: Rest of Europe BP Cuffs Industry Revenue (Million) Forecast, by Application 2019 & 2032
- Table 96: Rest of Europe BP Cuffs Industry Volume (K Unit) Forecast, by Application 2019 & 2032
- Table 97: Global BP Cuffs Industry Revenue Million Forecast, by Usage 2019 & 2032
- Table 98: Global BP Cuffs Industry Volume K Unit Forecast, by Usage 2019 & 2032
- Table 99: Global BP Cuffs Industry Revenue Million Forecast, by Product Type 2019 & 2032
- Table 100: Global BP Cuffs Industry Volume K Unit Forecast, by Product Type 2019 & 2032
- Table 101: Global BP Cuffs Industry Revenue Million Forecast, by End User 2019 & 2032
- Table 102: Global BP Cuffs Industry Volume K Unit Forecast, by End User 2019 & 2032
- Table 103: Global BP Cuffs Industry Revenue Million Forecast, by Country 2019 & 2032
- Table 104: Global BP Cuffs Industry Volume K Unit Forecast, by Country 2019 & 2032
- Table 105: China BP Cuffs Industry Revenue (Million) Forecast, by Application 2019 & 2032
- Table 106: China BP Cuffs Industry Volume (K Unit) Forecast, by Application 2019 & 2032
- Table 107: Japan BP Cuffs Industry Revenue (Million) Forecast, by Application 2019 & 2032
- Table 108: Japan BP Cuffs Industry Volume (K Unit) Forecast, by Application 2019 & 2032
- Table 109: India BP Cuffs Industry Revenue (Million) Forecast, by Application 2019 & 2032
- Table 110: India BP Cuffs Industry Volume (K Unit) Forecast, by Application 2019 & 2032
- Table 111: Australia BP Cuffs Industry Revenue (Million) Forecast, by Application 2019 & 2032
- Table 112: Australia BP Cuffs Industry Volume (K Unit) Forecast, by Application 2019 & 2032
- Table 113: South Korea BP Cuffs Industry Revenue (Million) Forecast, by Application 2019 & 2032
- Table 114: South Korea BP Cuffs Industry Volume (K Unit) Forecast, by Application 2019 & 2032
- Table 115: Rest of Asia Pacific BP Cuffs Industry Revenue (Million) Forecast, by Application 2019 & 2032
- Table 116: Rest of Asia Pacific BP Cuffs Industry Volume (K Unit) Forecast, by Application 2019 & 2032
- Table 117: Global BP Cuffs Industry Revenue Million Forecast, by Usage 2019 & 2032
- Table 118: Global BP Cuffs Industry Volume K Unit Forecast, by Usage 2019 & 2032
- Table 119: Global BP Cuffs Industry Revenue Million Forecast, by Product Type 2019 & 2032
- Table 120: Global BP Cuffs Industry Volume K Unit Forecast, by Product Type 2019 & 2032
- Table 121: Global BP Cuffs Industry Revenue Million Forecast, by End User 2019 & 2032
- Table 122: Global BP Cuffs Industry Volume K Unit Forecast, by End User 2019 & 2032
- Table 123: Global BP Cuffs Industry Revenue Million Forecast, by Country 2019 & 2032
- Table 124: Global BP Cuffs Industry Volume K Unit Forecast, by Country 2019 & 2032
- Table 125: GCC BP Cuffs Industry Revenue (Million) Forecast, by Application 2019 & 2032
- Table 126: GCC BP Cuffs Industry Volume (K Unit) Forecast, by Application 2019 & 2032
- Table 127: South Africa BP Cuffs Industry Revenue (Million) Forecast, by Application 2019 & 2032
- Table 128: South Africa BP Cuffs Industry Volume (K Unit) Forecast, by Application 2019 & 2032
- Table 129: Rest of Middle East and Africa BP Cuffs Industry Revenue (Million) Forecast, by Application 2019 & 2032
- Table 130: Rest of Middle East and Africa BP Cuffs Industry Volume (K Unit) Forecast, by Application 2019 & 2032
- Table 131: Global BP Cuffs Industry Revenue Million Forecast, by Usage 2019 & 2032
- Table 132: Global BP Cuffs Industry Volume K Unit Forecast, by Usage 2019 & 2032
- Table 133: Global BP Cuffs Industry Revenue Million Forecast, by Product Type 2019 & 2032
- Table 134: Global BP Cuffs Industry Volume K Unit Forecast, by Product Type 2019 & 2032
- Table 135: Global BP Cuffs Industry Revenue Million Forecast, by End User 2019 & 2032
- Table 136: Global BP Cuffs Industry Volume K Unit Forecast, by End User 2019 & 2032
- Table 137: Global BP Cuffs Industry Revenue Million Forecast, by Country 2019 & 2032
- Table 138: Global BP Cuffs Industry Volume K Unit Forecast, by Country 2019 & 2032
- Table 139: Brazil BP Cuffs Industry Revenue (Million) Forecast, by Application 2019 & 2032
- Table 140: Brazil BP Cuffs Industry Volume (K Unit) Forecast, by Application 2019 & 2032
- Table 141: Argentina BP Cuffs Industry Revenue (Million) Forecast, by Application 2019 & 2032
- Table 142: Argentina BP Cuffs Industry Volume (K Unit) Forecast, by Application 2019 & 2032
- Table 143: Rest of South America BP Cuffs Industry Revenue (Million) Forecast, by Application 2019 & 2032
- Table 144: Rest of South America BP Cuffs Industry Volume (K Unit) Forecast, by Application 2019 & 2032
Frequently Asked Questions
1. What is the projected Compound Annual Growth Rate (CAGR) of the BP Cuffs Industry?
The projected CAGR is approximately 5.89%.
2. Which companies are prominent players in the BP Cuffs Industry?
Key companies in the market include Halma PLC, Elanor Surgicals, GE Healthcare, W A Baum Co Inc , Baxter, Spengler SAS, Cardinal Health, Koninklijke Philips NV, Omron Healthcare Inc, Spacelabs Healthcare, American Diagnostic Corporation, Medline Industries Inc.
3. What are the main segments of the BP Cuffs Industry?
The market segments include Usage, Product Type, End User.
4. Can you provide details about the market size?
The market size is estimated to be USD 554.10 Million as of 2022.
5. What are some drivers contributing to market growth?
Increasing Prevalence of Hypertension; Growing Demand for Blood Monitoring Devices.
6. What are the notable trends driving market growth?
Automated Blood Pressure Cuffs Segment is Expected to Hold a Significant Market Share Over the Forecast Period.
7. Are there any restraints impacting market growth?
Threat of Infection from Reusable BP Cuffs.
8. Can you provide examples of recent developments in the market?
In September 2022, Garmin launched a smart blood pressure monitor with adjustable cuffs which allows users to measure systolic and diastolic blood pressure at home and on the go.
9. What pricing options are available for accessing the report?
Pricing options include single-user, multi-user, and enterprise licenses priced at USD 4750, USD 5250, and USD 8750 respectively.
10. Is the market size provided in terms of value or volume?
The market size is provided in terms of value, measured in Million and volume, measured in K Unit.
11. Are there any specific market keywords associated with the report?
Yes, the market keyword associated with the report is "BP Cuffs Industry," which aids in identifying and referencing the specific market segment covered.
12. How do I determine which pricing option suits my needs best?
The pricing options vary based on user requirements and access needs. Individual users may opt for single-user licenses, while businesses requiring broader access may choose multi-user or enterprise licenses for cost-effective access to the report.
13. Are there any additional resources or data provided in the BP Cuffs Industry report?
While the report offers comprehensive insights, it's advisable to review the specific contents or supplementary materials provided to ascertain if additional resources or data are available.
14. How can I stay updated on further developments or reports in the BP Cuffs Industry?
To stay informed about further developments, trends, and reports in the BP Cuffs Industry, consider subscribing to industry newsletters, following relevant companies and organizations, or regularly checking reputable industry news sources and publications.
Methodology
Step 1 - Identification of Relevant Samples Size from Population Database


Step 2 - Approaches for Defining Global Market Size (Value, Volume* & Price*)

Note*: In applicable scenarios
Step 3 - Data Sources
Primary Research
- Web Analytics
- Survey Reports
- Research Institute
- Latest Research Reports
- Opinion Leaders
Secondary Research
- Annual Reports
- White Paper
- Latest Press Release
- Industry Association
- Paid Database
- Investor Presentations

Step 4 - Data Triangulation
Involves using different sources of information in order to increase the validity of a study
These sources are likely to be stakeholders in a program - participants, other researchers, program staff, other community members, and so on.
Then we put all data in single framework & apply various statistical tools to find out the dynamic on the market.
During the analysis stage, feedback from the stakeholder groups would be compared to determine areas of agreement as well as areas of divergence
