

Key Insights
The global breast cancer screening tests market is experiencing robust growth, driven by increasing breast cancer incidence, rising awareness about early detection, and technological advancements in diagnostic imaging and genomic testing. The market, valued at approximately $XX million in 2025, is projected to expand at a compound annual growth rate (CAGR) of 8.44% from 2025 to 2033. This growth is fueled by several key factors. Firstly, the aging global population, particularly in developed nations like North America and Europe, contributes significantly to increased breast cancer diagnoses. Secondly, advancements in imaging technologies such as mammography, ultrasound, and MRI offer improved accuracy and earlier detection of cancerous lesions, leading to better patient outcomes and driving market demand. Furthermore, the adoption of genomic tests, such as Oncotype DX and MammaPrint, is gaining traction, enabling personalized treatment plans based on individual tumor characteristics and reducing the need for unnecessary chemotherapy. While factors like high costs associated with advanced screening methods and limited access to healthcare in certain regions pose challenges, the overall market outlook remains positive due to ongoing research and development efforts aimed at developing more effective and cost-efficient screening tools.
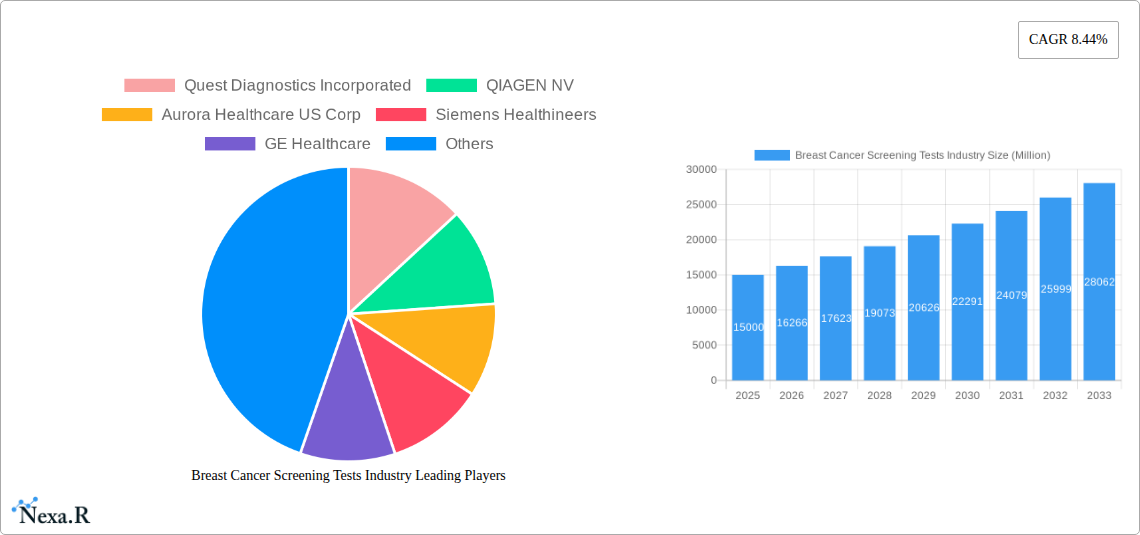
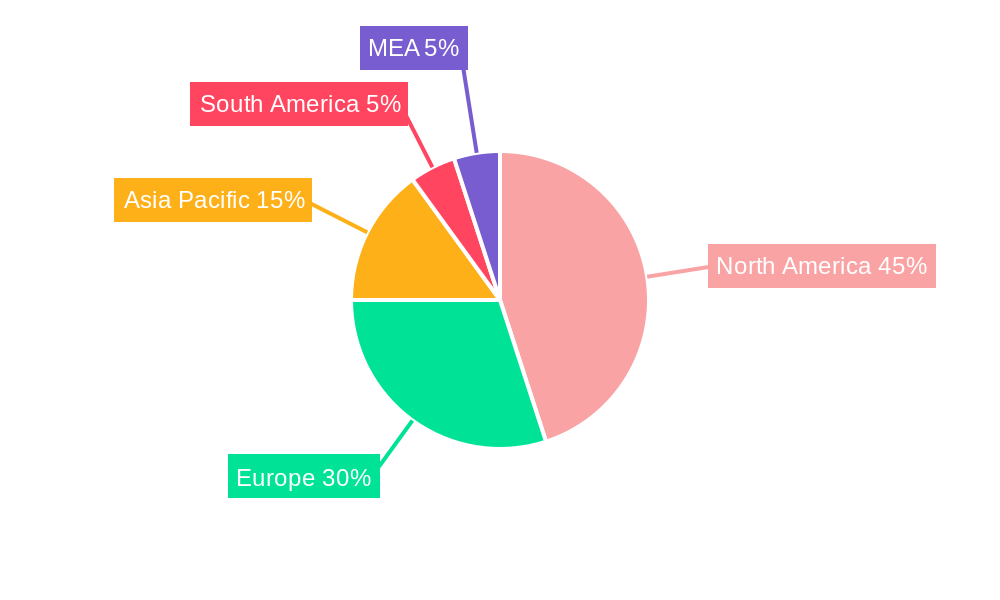
Despite these positive trends, market growth faces certain restraints. High costs associated with advanced screening technologies, like genomic tests and advanced imaging, can limit accessibility, particularly in low- and middle-income countries. Furthermore, variations in healthcare infrastructure and screening guidelines across different regions create disparities in access to these crucial diagnostic tools. The market segmentation is primarily driven by the type of test used, with genomic tests showing higher growth potential due to increasing demand for personalized medicine. North America currently holds the largest market share due to advanced healthcare infrastructure and higher breast cancer prevalence, followed by Europe and Asia Pacific. Key players like Quest Diagnostics, QIAGEN, and Siemens Healthineers are actively involved in research, development, and market expansion through strategic partnerships and technological innovations, further shaping the landscape of breast cancer screening. The competitive landscape is highly dynamic, with established players and emerging companies vying for market share through product differentiation and improved accessibility.
Breast Cancer Screening Tests Industry: Market Analysis & Forecast 2019-2033
This comprehensive report provides an in-depth analysis of the Breast Cancer Screening Tests industry, covering market dynamics, growth trends, regional performance, key players, and future outlook. With a focus on the parent market of cancer diagnostics and the child markets of genomic and imaging tests, this report offers crucial insights for industry professionals, investors, and strategic decision-makers. The study period spans 2019-2033, with a base year of 2025 and a forecast period of 2025-2033. The market size is presented in million units.
Study Period: 2019–2033 Base Year: 2025 Estimated Year: 2025 Forecast Period: 2025–2033 Historical Period: 2019–2024
Breast Cancer Screening Tests Industry Market Dynamics & Structure
The breast cancer screening tests market is characterized by moderate concentration, with a few major players holding significant market share. Technological innovation, particularly in genomic testing and AI-powered imaging, is a key driver. Stringent regulatory frameworks governing diagnostic tests influence market access and product development. The market faces competition from alternative screening methods and varying levels of healthcare access across regions. The aging global population and increased breast cancer awareness are major drivers of market growth. M&A activity has been moderate, with strategic acquisitions aimed at expanding product portfolios and geographical reach. The market size in 2025 is estimated at xx Million.
- Market Concentration: Moderately concentrated, with top 5 players holding approximately xx% market share in 2025.
- Technological Innovation: Rapid advancements in genomic sequencing, AI-powered image analysis, and minimally invasive procedures are driving market growth.
- Regulatory Frameworks: Stringent regulatory approvals (e.g., FDA) and reimbursement policies significantly impact market access and growth.
- Competitive Substitutes: Alternative screening methods like mammograms and ultrasound pose competitive pressure.
- End-User Demographics: The aging population and increased awareness drive demand, particularly in developed economies.
- M&A Trends: Moderate M&A activity, focused on expanding product portfolios and geographical presence. Approximately xx M&A deals were recorded between 2019 and 2024.
Breast Cancer Screening Tests Industry Growth Trends & Insights
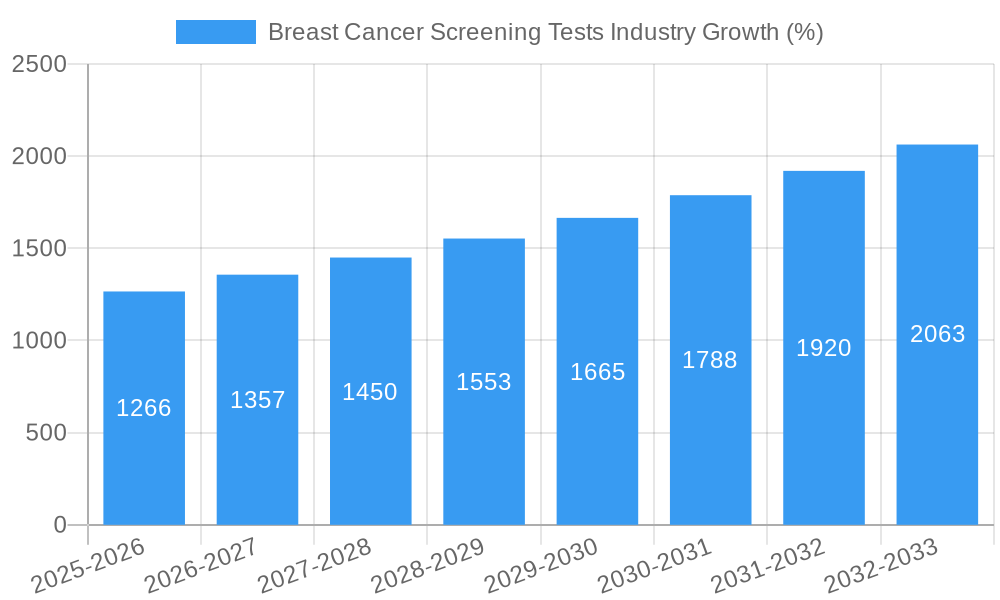
The breast cancer screening tests market exhibits robust growth, driven by increasing prevalence of breast cancer, technological advancements, and rising healthcare expenditure. The market size is projected to reach xx Million by 2033, registering a CAGR of xx% during the forecast period. Adoption rates for advanced genomic tests are increasing steadily, albeit from a smaller base. Technological disruptions, like AI-integrated imaging, are enhancing diagnostic accuracy and efficiency. Consumer behavior is shifting towards personalized medicine and early detection, leading to increased demand for advanced screening tests. Market penetration of genomic tests remains relatively low compared to traditional imaging tests, representing significant untapped potential.
Dominant Regions, Countries, or Segments in Breast Cancer Screening Tests Industry
North America dominates the breast cancer screening tests market, driven by high healthcare expenditure, advanced healthcare infrastructure, and early adoption of new technologies. Within North America, the US holds the largest market share. Europe follows as a significant market, with Western European countries showing higher adoption rates than Eastern European countries. Asia-Pacific is witnessing rapid market expansion due to increasing cancer incidence, rising healthcare awareness, and improving healthcare infrastructure. The Genomic Tests segment is experiencing faster growth than Imaging Tests due to advancements in personalized medicine and early detection capabilities.
- North America: High healthcare expenditure, advanced infrastructure, early adoption of new technologies.
- Europe: Significant market, with Western Europe leading in adoption.
- Asia-Pacific: Rapid growth driven by increasing cancer incidence and improved healthcare infrastructure.
- Genomic Tests Segment: Fastest-growing segment due to advancements in personalized medicine and early detection.
- Imaging Tests Segment: Largest segment, driven by established technologies and widespread adoption.
Breast Cancer Screening Tests Industry Product Landscape
The market offers a range of products, including mammography, ultrasound, MRI, biopsy, and genomic tests. Technological advancements are focusing on improving image quality, reducing invasiveness, enhancing diagnostic accuracy, and personalizing treatment strategies. Unique selling propositions include faster turnaround times, improved sensitivity and specificity, and minimally invasive procedures. Integration of AI and machine learning is enhancing diagnostic accuracy and streamlining workflows.
Key Drivers, Barriers & Challenges in Breast Cancer Screening Tests Industry
Key Drivers:
- Increasing prevalence of breast cancer globally.
- Technological advancements leading to improved accuracy and efficiency.
- Rising healthcare expenditure and insurance coverage.
- Growing awareness and early detection initiatives.
Challenges & Restraints:
- High cost of advanced testing, limiting accessibility in some regions.
- Stringent regulatory requirements for approval and reimbursement.
- Potential for false positives and negatives affecting patient outcomes and resource allocation.
- Competition from alternative screening methods.
Emerging Opportunities in Breast Cancer Screening Tests Industry
- Expansion into underserved markets in developing countries.
- Development of point-of-care testing solutions.
- Integration of liquid biopsies and other non-invasive techniques.
- Focus on personalized medicine approaches tailored to individual risk profiles.
Growth Accelerators in the Breast Cancer Screening Tests Industry Industry
Technological breakthroughs, such as AI-powered diagnostics and liquid biopsy advancements, are key growth catalysts. Strategic partnerships between diagnostic companies and healthcare providers are expanding market access and adoption. Aggressive market expansion strategies, including collaborations with international organizations focused on breast cancer awareness, are fueling market growth.
Key Players Shaping the Breast Cancer Screening Tests Industry Market
- Quest Diagnostics Incorporated
- QIAGEN NV
- Aurora Healthcare US Corp
- Siemens Healthineers
- GE Healthcare
- Hologic Inc
- Analogic Corporation
- Agendia Inc
- Myriad Genetics
- Allengers Medical Systems Limited
- Fujifilm Holdings Corporation
Notable Milestones in Breast Cancer Screening Tests Industry Sector
- February 2023: Abdul Latif Jameel Health partnered with iSono Health to distribute AI-powered automated breast imaging solutions, enhancing diagnostic capabilities.
- October 2022: The University of Texas MD Anderson Cancer Center and WHO collaborated to reduce the global burden of women's cancers, including breast cancer, boosting global initiatives.
In-Depth Breast Cancer Screening Tests Industry Market Outlook
The breast cancer screening tests market is poised for continued robust growth, driven by technological innovation, increased awareness, and rising healthcare expenditure. Strategic partnerships and expansion into new markets represent significant opportunities for growth. The focus on personalized medicine and early detection will continue to shape the future of the industry, driving demand for advanced and accessible screening solutions.
Breast Cancer Screening Tests Industry Segmentation
-
1. Test
- 1.1. Genomic Tests
-
1.2. Imaging Test
- 1.2.1. Mammogram
- 1.2.2. Ultrasound
- 1.2.3. MRI
- 1.2.4. Tomography
- 1.2.5. Other Imaging Tests
-
2. Geography
- 2.1. United States
- 2.2. Canada
- 2.3. Mexico
Breast Cancer Screening Tests Industry Segmentation By Geography
- 1. United States
- 2. Canada
- 3. Mexico
Breast Cancer Screening Tests Industry REPORT HIGHLIGHTS
| Aspects | Details |
|---|---|
| Study Period | 2019-2033 |
| Base Year | 2024 |
| Estimated Year | 2025 |
| Forecast Period | 2025-2033 |
| Historical Period | 2019-2024 |
| Growth Rate | CAGR of 8.44% from 2019-2033 |
| Segmentation |
|
Table of Contents
- 1. Introduction
- 1.1. Research Scope
- 1.2. Market Segmentation
- 1.3. Research Methodology
- 1.4. Definitions and Assumptions
- 2. Executive Summary
- 2.1. Introduction
- 3. Market Dynamics
- 3.1. Introduction
- 3.2. Market Drivers
- 3.2.1. Rising Incidence of Breast Cancer; Technological Advancements in Breast Cancer Screening
- 3.3. Market Restrains
- 3.3.1. Controversies Related to Mammography; Side Effects of Radiation during Screening Tests and Errors in Screening
- 3.4. Market Trends
- 3.4.1. Mammogram is Expected to Hold a Significant Share Over the Forecast Period
- 4. Market Factor Analysis
- 4.1. Porters Five Forces
- 4.2. Supply/Value Chain
- 4.3. PESTEL analysis
- 4.4. Market Entropy
- 4.5. Patent/Trademark Analysis
- 5. Global Breast Cancer Screening Tests Industry Analysis, Insights and Forecast, 2019-2031
- 5.1. Market Analysis, Insights and Forecast - by Test
- 5.1.1. Genomic Tests
- 5.1.2. Imaging Test
- 5.1.2.1. Mammogram
- 5.1.2.2. Ultrasound
- 5.1.2.3. MRI
- 5.1.2.4. Tomography
- 5.1.2.5. Other Imaging Tests
- 5.2. Market Analysis, Insights and Forecast - by Geography
- 5.2.1. United States
- 5.2.2. Canada
- 5.2.3. Mexico
- 5.3. Market Analysis, Insights and Forecast - by Region
- 5.3.1. United States
- 5.3.2. Canada
- 5.3.3. Mexico
- 5.1. Market Analysis, Insights and Forecast - by Test
- 6. United States Breast Cancer Screening Tests Industry Analysis, Insights and Forecast, 2019-2031
- 6.1. Market Analysis, Insights and Forecast - by Test
- 6.1.1. Genomic Tests
- 6.1.2. Imaging Test
- 6.1.2.1. Mammogram
- 6.1.2.2. Ultrasound
- 6.1.2.3. MRI
- 6.1.2.4. Tomography
- 6.1.2.5. Other Imaging Tests
- 6.2. Market Analysis, Insights and Forecast - by Geography
- 6.2.1. United States
- 6.2.2. Canada
- 6.2.3. Mexico
- 6.1. Market Analysis, Insights and Forecast - by Test
- 7. Canada Breast Cancer Screening Tests Industry Analysis, Insights and Forecast, 2019-2031
- 7.1. Market Analysis, Insights and Forecast - by Test
- 7.1.1. Genomic Tests
- 7.1.2. Imaging Test
- 7.1.2.1. Mammogram
- 7.1.2.2. Ultrasound
- 7.1.2.3. MRI
- 7.1.2.4. Tomography
- 7.1.2.5. Other Imaging Tests
- 7.2. Market Analysis, Insights and Forecast - by Geography
- 7.2.1. United States
- 7.2.2. Canada
- 7.2.3. Mexico
- 7.1. Market Analysis, Insights and Forecast - by Test
- 8. Mexico Breast Cancer Screening Tests Industry Analysis, Insights and Forecast, 2019-2031
- 8.1. Market Analysis, Insights and Forecast - by Test
- 8.1.1. Genomic Tests
- 8.1.2. Imaging Test
- 8.1.2.1. Mammogram
- 8.1.2.2. Ultrasound
- 8.1.2.3. MRI
- 8.1.2.4. Tomography
- 8.1.2.5. Other Imaging Tests
- 8.2. Market Analysis, Insights and Forecast - by Geography
- 8.2.1. United States
- 8.2.2. Canada
- 8.2.3. Mexico
- 8.1. Market Analysis, Insights and Forecast - by Test
- 9. North America Breast Cancer Screening Tests Industry Analysis, Insights and Forecast, 2019-2031
- 9.1. Market Analysis, Insights and Forecast - By Country/Sub-region
- 9.1.1 United States
- 9.1.2 Canada
- 9.1.3 Mexico
- 10. Europe Breast Cancer Screening Tests Industry Analysis, Insights and Forecast, 2019-2031
- 10.1. Market Analysis, Insights and Forecast - By Country/Sub-region
- 10.1.1 Germany
- 10.1.2 United Kingdom
- 10.1.3 France
- 10.1.4 Spain
- 10.1.5 Italy
- 10.1.6 Spain
- 10.1.7 Belgium
- 10.1.8 Netherland
- 10.1.9 Nordics
- 10.1.10 Rest of Europe
- 11. Asia Pacific Breast Cancer Screening Tests Industry Analysis, Insights and Forecast, 2019-2031
- 11.1. Market Analysis, Insights and Forecast - By Country/Sub-region
- 11.1.1 China
- 11.1.2 Japan
- 11.1.3 India
- 11.1.4 South Korea
- 11.1.5 Southeast Asia
- 11.1.6 Australia
- 11.1.7 Indonesia
- 11.1.8 Phillipes
- 11.1.9 Singapore
- 11.1.10 Thailandc
- 11.1.11 Rest of Asia Pacific
- 12. South America Breast Cancer Screening Tests Industry Analysis, Insights and Forecast, 2019-2031
- 12.1. Market Analysis, Insights and Forecast - By Country/Sub-region
- 12.1.1 Brazil
- 12.1.2 Argentina
- 12.1.3 Peru
- 12.1.4 Chile
- 12.1.5 Colombia
- 12.1.6 Ecuador
- 12.1.7 Venezuela
- 12.1.8 Rest of South America
- 13. North America Breast Cancer Screening Tests Industry Analysis, Insights and Forecast, 2019-2031
- 13.1. Market Analysis, Insights and Forecast - By Country/Sub-region
- 13.1.1 United States
- 13.1.2 Canada
- 13.1.3 Mexico
- 14. MEA Breast Cancer Screening Tests Industry Analysis, Insights and Forecast, 2019-2031
- 14.1. Market Analysis, Insights and Forecast - By Country/Sub-region
- 14.1.1 United Arab Emirates
- 14.1.2 Saudi Arabia
- 14.1.3 South Africa
- 14.1.4 Rest of Middle East and Africa
- 15. Competitive Analysis
- 15.1. Global Market Share Analysis 2024
- 15.2. Company Profiles
- 15.2.1 Quest Diagnostics Incorporated
- 15.2.1.1. Overview
- 15.2.1.2. Products
- 15.2.1.3. SWOT Analysis
- 15.2.1.4. Recent Developments
- 15.2.1.5. Financials (Based on Availability)
- 15.2.2 QIAGEN NV
- 15.2.2.1. Overview
- 15.2.2.2. Products
- 15.2.2.3. SWOT Analysis
- 15.2.2.4. Recent Developments
- 15.2.2.5. Financials (Based on Availability)
- 15.2.3 Aurora Healthcare US Corp
- 15.2.3.1. Overview
- 15.2.3.2. Products
- 15.2.3.3. SWOT Analysis
- 15.2.3.4. Recent Developments
- 15.2.3.5. Financials (Based on Availability)
- 15.2.4 Siemens Healthineers
- 15.2.4.1. Overview
- 15.2.4.2. Products
- 15.2.4.3. SWOT Analysis
- 15.2.4.4. Recent Developments
- 15.2.4.5. Financials (Based on Availability)
- 15.2.5 GE Healthcare
- 15.2.5.1. Overview
- 15.2.5.2. Products
- 15.2.5.3. SWOT Analysis
- 15.2.5.4. Recent Developments
- 15.2.5.5. Financials (Based on Availability)
- 15.2.6 Hologic Inc
- 15.2.6.1. Overview
- 15.2.6.2. Products
- 15.2.6.3. SWOT Analysis
- 15.2.6.4. Recent Developments
- 15.2.6.5. Financials (Based on Availability)
- 15.2.7 Analogic Corporation
- 15.2.7.1. Overview
- 15.2.7.2. Products
- 15.2.7.3. SWOT Analysis
- 15.2.7.4. Recent Developments
- 15.2.7.5. Financials (Based on Availability)
- 15.2.8 Agendia Inc
- 15.2.8.1. Overview
- 15.2.8.2. Products
- 15.2.8.3. SWOT Analysis
- 15.2.8.4. Recent Developments
- 15.2.8.5. Financials (Based on Availability)
- 15.2.9 Myriad Genetics
- 15.2.9.1. Overview
- 15.2.9.2. Products
- 15.2.9.3. SWOT Analysis
- 15.2.9.4. Recent Developments
- 15.2.9.5. Financials (Based on Availability)
- 15.2.10 Allengers Medical Systems Limited
- 15.2.10.1. Overview
- 15.2.10.2. Products
- 15.2.10.3. SWOT Analysis
- 15.2.10.4. Recent Developments
- 15.2.10.5. Financials (Based on Availability)
- 15.2.11 Fujifilm Holdings Corporation
- 15.2.11.1. Overview
- 15.2.11.2. Products
- 15.2.11.3. SWOT Analysis
- 15.2.11.4. Recent Developments
- 15.2.11.5. Financials (Based on Availability)
- 15.2.1 Quest Diagnostics Incorporated
List of Figures
- Figure 1: Global Breast Cancer Screening Tests Industry Revenue Breakdown (Million, %) by Region 2024 & 2032
- Figure 2: Global Breast Cancer Screening Tests Industry Volume Breakdown (K Unit, %) by Region 2024 & 2032
- Figure 3: North America Breast Cancer Screening Tests Industry Revenue (Million), by Country 2024 & 2032
- Figure 4: North America Breast Cancer Screening Tests Industry Volume (K Unit), by Country 2024 & 2032
- Figure 5: North America Breast Cancer Screening Tests Industry Revenue Share (%), by Country 2024 & 2032
- Figure 6: North America Breast Cancer Screening Tests Industry Volume Share (%), by Country 2024 & 2032
- Figure 7: Europe Breast Cancer Screening Tests Industry Revenue (Million), by Country 2024 & 2032
- Figure 8: Europe Breast Cancer Screening Tests Industry Volume (K Unit), by Country 2024 & 2032
- Figure 9: Europe Breast Cancer Screening Tests Industry Revenue Share (%), by Country 2024 & 2032
- Figure 10: Europe Breast Cancer Screening Tests Industry Volume Share (%), by Country 2024 & 2032
- Figure 11: Asia Pacific Breast Cancer Screening Tests Industry Revenue (Million), by Country 2024 & 2032
- Figure 12: Asia Pacific Breast Cancer Screening Tests Industry Volume (K Unit), by Country 2024 & 2032
- Figure 13: Asia Pacific Breast Cancer Screening Tests Industry Revenue Share (%), by Country 2024 & 2032
- Figure 14: Asia Pacific Breast Cancer Screening Tests Industry Volume Share (%), by Country 2024 & 2032
- Figure 15: South America Breast Cancer Screening Tests Industry Revenue (Million), by Country 2024 & 2032
- Figure 16: South America Breast Cancer Screening Tests Industry Volume (K Unit), by Country 2024 & 2032
- Figure 17: South America Breast Cancer Screening Tests Industry Revenue Share (%), by Country 2024 & 2032
- Figure 18: South America Breast Cancer Screening Tests Industry Volume Share (%), by Country 2024 & 2032
- Figure 19: North America Breast Cancer Screening Tests Industry Revenue (Million), by Country 2024 & 2032
- Figure 20: North America Breast Cancer Screening Tests Industry Volume (K Unit), by Country 2024 & 2032
- Figure 21: North America Breast Cancer Screening Tests Industry Revenue Share (%), by Country 2024 & 2032
- Figure 22: North America Breast Cancer Screening Tests Industry Volume Share (%), by Country 2024 & 2032
- Figure 23: MEA Breast Cancer Screening Tests Industry Revenue (Million), by Country 2024 & 2032
- Figure 24: MEA Breast Cancer Screening Tests Industry Volume (K Unit), by Country 2024 & 2032
- Figure 25: MEA Breast Cancer Screening Tests Industry Revenue Share (%), by Country 2024 & 2032
- Figure 26: MEA Breast Cancer Screening Tests Industry Volume Share (%), by Country 2024 & 2032
- Figure 27: United States Breast Cancer Screening Tests Industry Revenue (Million), by Test 2024 & 2032
- Figure 28: United States Breast Cancer Screening Tests Industry Volume (K Unit), by Test 2024 & 2032
- Figure 29: United States Breast Cancer Screening Tests Industry Revenue Share (%), by Test 2024 & 2032
- Figure 30: United States Breast Cancer Screening Tests Industry Volume Share (%), by Test 2024 & 2032
- Figure 31: United States Breast Cancer Screening Tests Industry Revenue (Million), by Geography 2024 & 2032
- Figure 32: United States Breast Cancer Screening Tests Industry Volume (K Unit), by Geography 2024 & 2032
- Figure 33: United States Breast Cancer Screening Tests Industry Revenue Share (%), by Geography 2024 & 2032
- Figure 34: United States Breast Cancer Screening Tests Industry Volume Share (%), by Geography 2024 & 2032
- Figure 35: United States Breast Cancer Screening Tests Industry Revenue (Million), by Country 2024 & 2032
- Figure 36: United States Breast Cancer Screening Tests Industry Volume (K Unit), by Country 2024 & 2032
- Figure 37: United States Breast Cancer Screening Tests Industry Revenue Share (%), by Country 2024 & 2032
- Figure 38: United States Breast Cancer Screening Tests Industry Volume Share (%), by Country 2024 & 2032
- Figure 39: Canada Breast Cancer Screening Tests Industry Revenue (Million), by Test 2024 & 2032
- Figure 40: Canada Breast Cancer Screening Tests Industry Volume (K Unit), by Test 2024 & 2032
- Figure 41: Canada Breast Cancer Screening Tests Industry Revenue Share (%), by Test 2024 & 2032
- Figure 42: Canada Breast Cancer Screening Tests Industry Volume Share (%), by Test 2024 & 2032
- Figure 43: Canada Breast Cancer Screening Tests Industry Revenue (Million), by Geography 2024 & 2032
- Figure 44: Canada Breast Cancer Screening Tests Industry Volume (K Unit), by Geography 2024 & 2032
- Figure 45: Canada Breast Cancer Screening Tests Industry Revenue Share (%), by Geography 2024 & 2032
- Figure 46: Canada Breast Cancer Screening Tests Industry Volume Share (%), by Geography 2024 & 2032
- Figure 47: Canada Breast Cancer Screening Tests Industry Revenue (Million), by Country 2024 & 2032
- Figure 48: Canada Breast Cancer Screening Tests Industry Volume (K Unit), by Country 2024 & 2032
- Figure 49: Canada Breast Cancer Screening Tests Industry Revenue Share (%), by Country 2024 & 2032
- Figure 50: Canada Breast Cancer Screening Tests Industry Volume Share (%), by Country 2024 & 2032
- Figure 51: Mexico Breast Cancer Screening Tests Industry Revenue (Million), by Test 2024 & 2032
- Figure 52: Mexico Breast Cancer Screening Tests Industry Volume (K Unit), by Test 2024 & 2032
- Figure 53: Mexico Breast Cancer Screening Tests Industry Revenue Share (%), by Test 2024 & 2032
- Figure 54: Mexico Breast Cancer Screening Tests Industry Volume Share (%), by Test 2024 & 2032
- Figure 55: Mexico Breast Cancer Screening Tests Industry Revenue (Million), by Geography 2024 & 2032
- Figure 56: Mexico Breast Cancer Screening Tests Industry Volume (K Unit), by Geography 2024 & 2032
- Figure 57: Mexico Breast Cancer Screening Tests Industry Revenue Share (%), by Geography 2024 & 2032
- Figure 58: Mexico Breast Cancer Screening Tests Industry Volume Share (%), by Geography 2024 & 2032
- Figure 59: Mexico Breast Cancer Screening Tests Industry Revenue (Million), by Country 2024 & 2032
- Figure 60: Mexico Breast Cancer Screening Tests Industry Volume (K Unit), by Country 2024 & 2032
- Figure 61: Mexico Breast Cancer Screening Tests Industry Revenue Share (%), by Country 2024 & 2032
- Figure 62: Mexico Breast Cancer Screening Tests Industry Volume Share (%), by Country 2024 & 2032
List of Tables
- Table 1: Global Breast Cancer Screening Tests Industry Revenue Million Forecast, by Region 2019 & 2032
- Table 2: Global Breast Cancer Screening Tests Industry Volume K Unit Forecast, by Region 2019 & 2032
- Table 3: Global Breast Cancer Screening Tests Industry Revenue Million Forecast, by Test 2019 & 2032
- Table 4: Global Breast Cancer Screening Tests Industry Volume K Unit Forecast, by Test 2019 & 2032
- Table 5: Global Breast Cancer Screening Tests Industry Revenue Million Forecast, by Geography 2019 & 2032
- Table 6: Global Breast Cancer Screening Tests Industry Volume K Unit Forecast, by Geography 2019 & 2032
- Table 7: Global Breast Cancer Screening Tests Industry Revenue Million Forecast, by Region 2019 & 2032
- Table 8: Global Breast Cancer Screening Tests Industry Volume K Unit Forecast, by Region 2019 & 2032
- Table 9: Global Breast Cancer Screening Tests Industry Revenue Million Forecast, by Country 2019 & 2032
- Table 10: Global Breast Cancer Screening Tests Industry Volume K Unit Forecast, by Country 2019 & 2032
- Table 11: United States Breast Cancer Screening Tests Industry Revenue (Million) Forecast, by Application 2019 & 2032
- Table 12: United States Breast Cancer Screening Tests Industry Volume (K Unit) Forecast, by Application 2019 & 2032
- Table 13: Canada Breast Cancer Screening Tests Industry Revenue (Million) Forecast, by Application 2019 & 2032
- Table 14: Canada Breast Cancer Screening Tests Industry Volume (K Unit) Forecast, by Application 2019 & 2032
- Table 15: Mexico Breast Cancer Screening Tests Industry Revenue (Million) Forecast, by Application 2019 & 2032
- Table 16: Mexico Breast Cancer Screening Tests Industry Volume (K Unit) Forecast, by Application 2019 & 2032
- Table 17: Global Breast Cancer Screening Tests Industry Revenue Million Forecast, by Country 2019 & 2032
- Table 18: Global Breast Cancer Screening Tests Industry Volume K Unit Forecast, by Country 2019 & 2032
- Table 19: Germany Breast Cancer Screening Tests Industry Revenue (Million) Forecast, by Application 2019 & 2032
- Table 20: Germany Breast Cancer Screening Tests Industry Volume (K Unit) Forecast, by Application 2019 & 2032
- Table 21: United Kingdom Breast Cancer Screening Tests Industry Revenue (Million) Forecast, by Application 2019 & 2032
- Table 22: United Kingdom Breast Cancer Screening Tests Industry Volume (K Unit) Forecast, by Application 2019 & 2032
- Table 23: France Breast Cancer Screening Tests Industry Revenue (Million) Forecast, by Application 2019 & 2032
- Table 24: France Breast Cancer Screening Tests Industry Volume (K Unit) Forecast, by Application 2019 & 2032
- Table 25: Spain Breast Cancer Screening Tests Industry Revenue (Million) Forecast, by Application 2019 & 2032
- Table 26: Spain Breast Cancer Screening Tests Industry Volume (K Unit) Forecast, by Application 2019 & 2032
- Table 27: Italy Breast Cancer Screening Tests Industry Revenue (Million) Forecast, by Application 2019 & 2032
- Table 28: Italy Breast Cancer Screening Tests Industry Volume (K Unit) Forecast, by Application 2019 & 2032
- Table 29: Spain Breast Cancer Screening Tests Industry Revenue (Million) Forecast, by Application 2019 & 2032
- Table 30: Spain Breast Cancer Screening Tests Industry Volume (K Unit) Forecast, by Application 2019 & 2032
- Table 31: Belgium Breast Cancer Screening Tests Industry Revenue (Million) Forecast, by Application 2019 & 2032
- Table 32: Belgium Breast Cancer Screening Tests Industry Volume (K Unit) Forecast, by Application 2019 & 2032
- Table 33: Netherland Breast Cancer Screening Tests Industry Revenue (Million) Forecast, by Application 2019 & 2032
- Table 34: Netherland Breast Cancer Screening Tests Industry Volume (K Unit) Forecast, by Application 2019 & 2032
- Table 35: Nordics Breast Cancer Screening Tests Industry Revenue (Million) Forecast, by Application 2019 & 2032
- Table 36: Nordics Breast Cancer Screening Tests Industry Volume (K Unit) Forecast, by Application 2019 & 2032
- Table 37: Rest of Europe Breast Cancer Screening Tests Industry Revenue (Million) Forecast, by Application 2019 & 2032
- Table 38: Rest of Europe Breast Cancer Screening Tests Industry Volume (K Unit) Forecast, by Application 2019 & 2032
- Table 39: Global Breast Cancer Screening Tests Industry Revenue Million Forecast, by Country 2019 & 2032
- Table 40: Global Breast Cancer Screening Tests Industry Volume K Unit Forecast, by Country 2019 & 2032
- Table 41: China Breast Cancer Screening Tests Industry Revenue (Million) Forecast, by Application 2019 & 2032
- Table 42: China Breast Cancer Screening Tests Industry Volume (K Unit) Forecast, by Application 2019 & 2032
- Table 43: Japan Breast Cancer Screening Tests Industry Revenue (Million) Forecast, by Application 2019 & 2032
- Table 44: Japan Breast Cancer Screening Tests Industry Volume (K Unit) Forecast, by Application 2019 & 2032
- Table 45: India Breast Cancer Screening Tests Industry Revenue (Million) Forecast, by Application 2019 & 2032
- Table 46: India Breast Cancer Screening Tests Industry Volume (K Unit) Forecast, by Application 2019 & 2032
- Table 47: South Korea Breast Cancer Screening Tests Industry Revenue (Million) Forecast, by Application 2019 & 2032
- Table 48: South Korea Breast Cancer Screening Tests Industry Volume (K Unit) Forecast, by Application 2019 & 2032
- Table 49: Southeast Asia Breast Cancer Screening Tests Industry Revenue (Million) Forecast, by Application 2019 & 2032
- Table 50: Southeast Asia Breast Cancer Screening Tests Industry Volume (K Unit) Forecast, by Application 2019 & 2032
- Table 51: Australia Breast Cancer Screening Tests Industry Revenue (Million) Forecast, by Application 2019 & 2032
- Table 52: Australia Breast Cancer Screening Tests Industry Volume (K Unit) Forecast, by Application 2019 & 2032
- Table 53: Indonesia Breast Cancer Screening Tests Industry Revenue (Million) Forecast, by Application 2019 & 2032
- Table 54: Indonesia Breast Cancer Screening Tests Industry Volume (K Unit) Forecast, by Application 2019 & 2032
- Table 55: Phillipes Breast Cancer Screening Tests Industry Revenue (Million) Forecast, by Application 2019 & 2032
- Table 56: Phillipes Breast Cancer Screening Tests Industry Volume (K Unit) Forecast, by Application 2019 & 2032
- Table 57: Singapore Breast Cancer Screening Tests Industry Revenue (Million) Forecast, by Application 2019 & 2032
- Table 58: Singapore Breast Cancer Screening Tests Industry Volume (K Unit) Forecast, by Application 2019 & 2032
- Table 59: Thailandc Breast Cancer Screening Tests Industry Revenue (Million) Forecast, by Application 2019 & 2032
- Table 60: Thailandc Breast Cancer Screening Tests Industry Volume (K Unit) Forecast, by Application 2019 & 2032
- Table 61: Rest of Asia Pacific Breast Cancer Screening Tests Industry Revenue (Million) Forecast, by Application 2019 & 2032
- Table 62: Rest of Asia Pacific Breast Cancer Screening Tests Industry Volume (K Unit) Forecast, by Application 2019 & 2032
- Table 63: Global Breast Cancer Screening Tests Industry Revenue Million Forecast, by Country 2019 & 2032
- Table 64: Global Breast Cancer Screening Tests Industry Volume K Unit Forecast, by Country 2019 & 2032
- Table 65: Brazil Breast Cancer Screening Tests Industry Revenue (Million) Forecast, by Application 2019 & 2032
- Table 66: Brazil Breast Cancer Screening Tests Industry Volume (K Unit) Forecast, by Application 2019 & 2032
- Table 67: Argentina Breast Cancer Screening Tests Industry Revenue (Million) Forecast, by Application 2019 & 2032
- Table 68: Argentina Breast Cancer Screening Tests Industry Volume (K Unit) Forecast, by Application 2019 & 2032
- Table 69: Peru Breast Cancer Screening Tests Industry Revenue (Million) Forecast, by Application 2019 & 2032
- Table 70: Peru Breast Cancer Screening Tests Industry Volume (K Unit) Forecast, by Application 2019 & 2032
- Table 71: Chile Breast Cancer Screening Tests Industry Revenue (Million) Forecast, by Application 2019 & 2032
- Table 72: Chile Breast Cancer Screening Tests Industry Volume (K Unit) Forecast, by Application 2019 & 2032
- Table 73: Colombia Breast Cancer Screening Tests Industry Revenue (Million) Forecast, by Application 2019 & 2032
- Table 74: Colombia Breast Cancer Screening Tests Industry Volume (K Unit) Forecast, by Application 2019 & 2032
- Table 75: Ecuador Breast Cancer Screening Tests Industry Revenue (Million) Forecast, by Application 2019 & 2032
- Table 76: Ecuador Breast Cancer Screening Tests Industry Volume (K Unit) Forecast, by Application 2019 & 2032
- Table 77: Venezuela Breast Cancer Screening Tests Industry Revenue (Million) Forecast, by Application 2019 & 2032
- Table 78: Venezuela Breast Cancer Screening Tests Industry Volume (K Unit) Forecast, by Application 2019 & 2032
- Table 79: Rest of South America Breast Cancer Screening Tests Industry Revenue (Million) Forecast, by Application 2019 & 2032
- Table 80: Rest of South America Breast Cancer Screening Tests Industry Volume (K Unit) Forecast, by Application 2019 & 2032
- Table 81: Global Breast Cancer Screening Tests Industry Revenue Million Forecast, by Country 2019 & 2032
- Table 82: Global Breast Cancer Screening Tests Industry Volume K Unit Forecast, by Country 2019 & 2032
- Table 83: United States Breast Cancer Screening Tests Industry Revenue (Million) Forecast, by Application 2019 & 2032
- Table 84: United States Breast Cancer Screening Tests Industry Volume (K Unit) Forecast, by Application 2019 & 2032
- Table 85: Canada Breast Cancer Screening Tests Industry Revenue (Million) Forecast, by Application 2019 & 2032
- Table 86: Canada Breast Cancer Screening Tests Industry Volume (K Unit) Forecast, by Application 2019 & 2032
- Table 87: Mexico Breast Cancer Screening Tests Industry Revenue (Million) Forecast, by Application 2019 & 2032
- Table 88: Mexico Breast Cancer Screening Tests Industry Volume (K Unit) Forecast, by Application 2019 & 2032
- Table 89: Global Breast Cancer Screening Tests Industry Revenue Million Forecast, by Country 2019 & 2032
- Table 90: Global Breast Cancer Screening Tests Industry Volume K Unit Forecast, by Country 2019 & 2032
- Table 91: United Arab Emirates Breast Cancer Screening Tests Industry Revenue (Million) Forecast, by Application 2019 & 2032
- Table 92: United Arab Emirates Breast Cancer Screening Tests Industry Volume (K Unit) Forecast, by Application 2019 & 2032
- Table 93: Saudi Arabia Breast Cancer Screening Tests Industry Revenue (Million) Forecast, by Application 2019 & 2032
- Table 94: Saudi Arabia Breast Cancer Screening Tests Industry Volume (K Unit) Forecast, by Application 2019 & 2032
- Table 95: South Africa Breast Cancer Screening Tests Industry Revenue (Million) Forecast, by Application 2019 & 2032
- Table 96: South Africa Breast Cancer Screening Tests Industry Volume (K Unit) Forecast, by Application 2019 & 2032
- Table 97: Rest of Middle East and Africa Breast Cancer Screening Tests Industry Revenue (Million) Forecast, by Application 2019 & 2032
- Table 98: Rest of Middle East and Africa Breast Cancer Screening Tests Industry Volume (K Unit) Forecast, by Application 2019 & 2032
- Table 99: Global Breast Cancer Screening Tests Industry Revenue Million Forecast, by Test 2019 & 2032
- Table 100: Global Breast Cancer Screening Tests Industry Volume K Unit Forecast, by Test 2019 & 2032
- Table 101: Global Breast Cancer Screening Tests Industry Revenue Million Forecast, by Geography 2019 & 2032
- Table 102: Global Breast Cancer Screening Tests Industry Volume K Unit Forecast, by Geography 2019 & 2032
- Table 103: Global Breast Cancer Screening Tests Industry Revenue Million Forecast, by Country 2019 & 2032
- Table 104: Global Breast Cancer Screening Tests Industry Volume K Unit Forecast, by Country 2019 & 2032
- Table 105: Global Breast Cancer Screening Tests Industry Revenue Million Forecast, by Test 2019 & 2032
- Table 106: Global Breast Cancer Screening Tests Industry Volume K Unit Forecast, by Test 2019 & 2032
- Table 107: Global Breast Cancer Screening Tests Industry Revenue Million Forecast, by Geography 2019 & 2032
- Table 108: Global Breast Cancer Screening Tests Industry Volume K Unit Forecast, by Geography 2019 & 2032
- Table 109: Global Breast Cancer Screening Tests Industry Revenue Million Forecast, by Country 2019 & 2032
- Table 110: Global Breast Cancer Screening Tests Industry Volume K Unit Forecast, by Country 2019 & 2032
- Table 111: Global Breast Cancer Screening Tests Industry Revenue Million Forecast, by Test 2019 & 2032
- Table 112: Global Breast Cancer Screening Tests Industry Volume K Unit Forecast, by Test 2019 & 2032
- Table 113: Global Breast Cancer Screening Tests Industry Revenue Million Forecast, by Geography 2019 & 2032
- Table 114: Global Breast Cancer Screening Tests Industry Volume K Unit Forecast, by Geography 2019 & 2032
- Table 115: Global Breast Cancer Screening Tests Industry Revenue Million Forecast, by Country 2019 & 2032
- Table 116: Global Breast Cancer Screening Tests Industry Volume K Unit Forecast, by Country 2019 & 2032
Frequently Asked Questions
1. What is the projected Compound Annual Growth Rate (CAGR) of the Breast Cancer Screening Tests Industry?
The projected CAGR is approximately 8.44%.
2. Which companies are prominent players in the Breast Cancer Screening Tests Industry?
Key companies in the market include Quest Diagnostics Incorporated, QIAGEN NV, Aurora Healthcare US Corp, Siemens Healthineers, GE Healthcare, Hologic Inc, Analogic Corporation, Agendia Inc , Myriad Genetics, Allengers Medical Systems Limited, Fujifilm Holdings Corporation.
3. What are the main segments of the Breast Cancer Screening Tests Industry?
The market segments include Test, Geography.
4. Can you provide details about the market size?
The market size is estimated to be USD XX Million as of 2022.
5. What are some drivers contributing to market growth?
Rising Incidence of Breast Cancer; Technological Advancements in Breast Cancer Screening.
6. What are the notable trends driving market growth?
Mammogram is Expected to Hold a Significant Share Over the Forecast Period.
7. Are there any restraints impacting market growth?
Controversies Related to Mammography; Side Effects of Radiation during Screening Tests and Errors in Screening.
8. Can you provide examples of recent developments in the market?
February 2023: To transform breast care with automated imaging and artificial intelligence (AI), Abdul Latif Jameel Health signed a distribution agreement with iSono Health, a medical technology company in San Francisco, US.
9. What pricing options are available for accessing the report?
Pricing options include single-user, multi-user, and enterprise licenses priced at USD 4750, USD 5250, and USD 8750 respectively.
10. Is the market size provided in terms of value or volume?
The market size is provided in terms of value, measured in Million and volume, measured in K Unit.
11. Are there any specific market keywords associated with the report?
Yes, the market keyword associated with the report is "Breast Cancer Screening Tests Industry," which aids in identifying and referencing the specific market segment covered.
12. How do I determine which pricing option suits my needs best?
The pricing options vary based on user requirements and access needs. Individual users may opt for single-user licenses, while businesses requiring broader access may choose multi-user or enterprise licenses for cost-effective access to the report.
13. Are there any additional resources or data provided in the Breast Cancer Screening Tests Industry report?
While the report offers comprehensive insights, it's advisable to review the specific contents or supplementary materials provided to ascertain if additional resources or data are available.
14. How can I stay updated on further developments or reports in the Breast Cancer Screening Tests Industry?
To stay informed about further developments, trends, and reports in the Breast Cancer Screening Tests Industry, consider subscribing to industry newsletters, following relevant companies and organizations, or regularly checking reputable industry news sources and publications.
Methodology
Step 1 - Identification of Relevant Samples Size from Population Database


Step 2 - Approaches for Defining Global Market Size (Value, Volume* & Price*)

Note*: In applicable scenarios
Step 3 - Data Sources
Primary Research
- Web Analytics
- Survey Reports
- Research Institute
- Latest Research Reports
- Opinion Leaders
Secondary Research
- Annual Reports
- White Paper
- Latest Press Release
- Industry Association
- Paid Database
- Investor Presentations

Step 4 - Data Triangulation
Involves using different sources of information in order to increase the validity of a study
These sources are likely to be stakeholders in a program - participants, other researchers, program staff, other community members, and so on.
Then we put all data in single framework & apply various statistical tools to find out the dynamic on the market.
During the analysis stage, feedback from the stakeholder groups would be compared to determine areas of agreement as well as areas of divergence
