

Key Insights
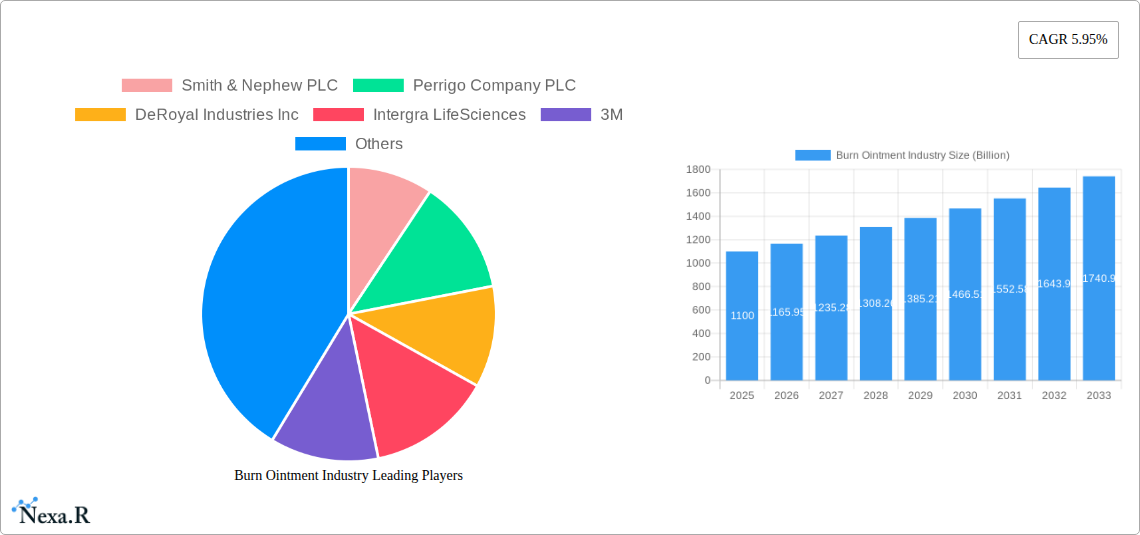
The global burn ointment market, valued at $1.1 billion in 2025, is projected to experience robust growth, driven by a compound annual growth rate (CAGR) of 5.95% from 2025 to 2033. This expansion is fueled by several key factors. Firstly, the increasing prevalence of burn injuries globally, stemming from accidents, natural disasters, and industrial incidents, creates significant demand for effective burn treatment solutions. Secondly, advancements in burn ointment formulations, including the development of products with enhanced antimicrobial properties and improved wound healing capabilities, are attracting wider adoption among healthcare professionals. The market is segmented by product type (topical antibiotics, silver, iodine), burn depth (minor, partial thickness, full thickness), and end-user (hospitals and clinics, other end-users). Hospitals and clinics represent a significant portion of the market due to the specialized care required for severe burns. The increasing preference for minimally invasive treatments and outpatient care is also contributing to the market growth. Furthermore, rising healthcare expenditure and improved healthcare infrastructure in developing economies are further stimulating market expansion.
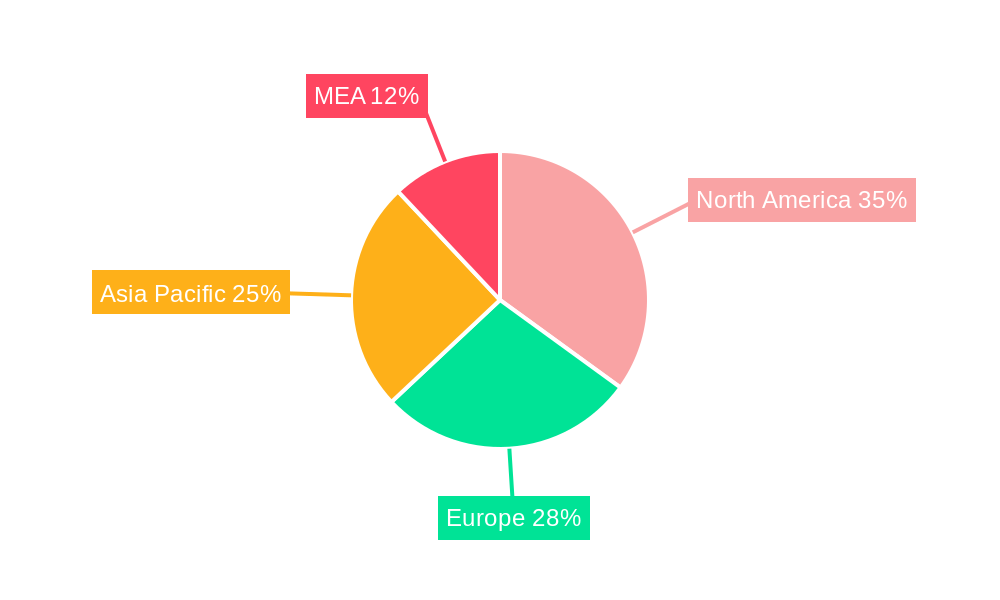
Geographic distribution shows a diversified market, with North America, Europe, and Asia Pacific representing major regions. North America's dominance is attributed to factors such as advanced healthcare infrastructure, high burn injury rates, and significant R&D investments. However, Asia Pacific is expected to witness faster growth during the forecast period, driven by increasing awareness about burn wound management, rising disposable incomes, and a growing geriatric population susceptible to burn injuries. Competition within the market is intense, with major players such as Smith & Nephew, Perrigo, 3M, and Johnson & Johnson focusing on product innovation, strategic partnerships, and geographic expansion to maintain a strong market presence. The competitive landscape is expected to remain highly dynamic, characterized by continuous innovation, mergers and acquisitions, and market penetration strategies.
This comprehensive report provides a detailed analysis of the global burn ointment market, encompassing market dynamics, growth trends, regional segmentation, product landscape, key players, and future outlook. The study period covers 2019-2033, with 2025 as the base year and a forecast period of 2025-2033. The market is segmented by product type (Topical Antibiotics, Silver, Iodine), depth of burn (Minor Burns, Partial Thickness Burns, Full Thickness Burns), and end-user (Hospitals and Clinics, Other End Users). The total market size is projected to reach XX Billion by 2033.
Burn Ointment Industry Market Dynamics & Structure
The burn ointment market is characterized by a moderately concentrated structure with key players like Smith & Nephew PLC, Johnson & Johnson, and 3M holding significant market shares. Technological innovation, particularly in wound healing technologies and advanced formulations, is a major driver. Stringent regulatory frameworks, varying across regions, influence product approvals and market access. Competitive pressure from generic and substitute products exists. The market is driven by a growing geriatric population, increasing incidence of burn injuries, and rising healthcare expenditure. M&A activities are moderate, with a focus on expanding product portfolios and geographic reach. An estimated xx Billion in M&A deals occurred between 2019 and 2024.
- Market Concentration: Moderately concentrated, with top 5 players holding approximately xx% market share.
- Technological Innovation: Focus on advanced formulations, antimicrobial agents, and pain management.
- Regulatory Landscape: Stringent regulations impacting product approvals and market entry.
- Competitive Substitutes: Over-the-counter remedies and traditional wound care methods pose competition.
- End-User Demographics: Aging population and rising incidence of burn injuries drive demand.
- M&A Activity: Moderate activity, driven by expansion strategies and portfolio diversification.
Burn Ointment Industry Growth Trends & Insights
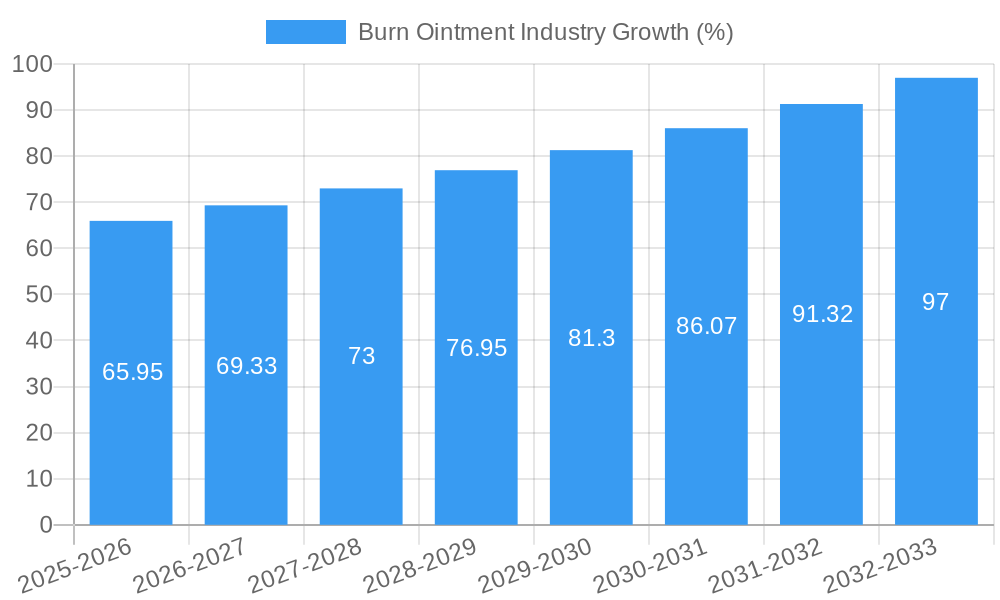
The global burn ointment market experienced steady growth during the historical period (2019-2024), driven by increasing burn injury cases, particularly in developing economies. The market is projected to witness a CAGR of xx% during the forecast period (2025-2033), reaching a value of XX Billion by 2033. Technological advancements, such as the introduction of novel formulations with enhanced efficacy and reduced side effects, are contributing to market expansion. Consumer awareness regarding burn wound care and the increasing preference for effective and convenient treatment options are fueling market growth. Market penetration of advanced burn ointments remains relatively low, offering significant growth potential.
Dominant Regions, Countries, or Segments in Burn Ointment Industry
North America currently dominates the burn ointment market, driven by high healthcare expenditure, advanced medical infrastructure, and a high prevalence of burn injuries. However, Asia-Pacific is expected to witness the fastest growth during the forecast period, fueled by rising disposable incomes, increasing awareness of burn wound care, and expanding healthcare infrastructure. Within product types, silver-based ointments hold a significant market share due to their broad-spectrum antimicrobial properties. Hospitals and clinics remain the primary end-users, accounting for the largest share of market revenue.
- North America: High healthcare expenditure and advanced medical infrastructure drive market dominance.
- Asia-Pacific: Fastest-growing region, driven by rising disposable incomes and expanding healthcare.
- Europe: Steady growth, influenced by government initiatives and healthcare reforms.
- Silver-based Ointments: Largest market share due to effective antimicrobial properties.
- Hospitals and Clinics: Primary end-users, accounting for a significant portion of market revenue.
Burn Ointment Industry Product Landscape
The burn ointment market offers a diverse range of products, including topical antibiotics, silver-based ointments, and iodine-based preparations. Innovations focus on improving efficacy, reducing side effects, and enhancing patient comfort. Products are differentiated based on their active ingredients, formulation, and mode of action. Unique selling propositions include enhanced wound healing properties, reduced pain and inflammation, and ease of application. Technological advancements are leading to the development of bioengineered ointments and advanced drug delivery systems.
Key Drivers, Barriers & Challenges in Burn Ointment Industry
Key Drivers:
- Increasing incidence of burn injuries globally.
- Growing geriatric population (increased susceptibility to burns).
- Rising healthcare expenditure and improved access to healthcare.
- Technological advancements leading to improved product efficacy and safety.
Key Barriers and Challenges:
- Stringent regulatory approvals impacting market entry for new products.
- High manufacturing costs impacting product pricing and accessibility.
- Potential side effects associated with certain burn ointments limiting market adoption.
- Intense competition from generic and substitute products.
Emerging Opportunities in Burn Ointment Industry
- Untapped markets in developing economies offer significant growth potential.
- Development of novel formulations with enhanced efficacy and reduced side effects.
- Increasing demand for home-based burn wound care products.
- Growing focus on personalized medicine and targeted therapies for burn wound management.
Growth Accelerators in the Burn Ointment Industry Industry
Technological advancements in wound healing, particularly in nanotechnology and biomaterials, are key growth accelerators. Strategic collaborations between pharmaceutical companies and research institutions are fostering innovation. Expansion into emerging markets through strategic partnerships and distribution agreements will drive market growth. Government initiatives supporting burn injury prevention and treatment will further accelerate market expansion.
Key Players Shaping the Burn Ointment Industry Market
- Smith & Nephew PLC
- Perrigo Company PLC
- DeRoyal Industries Inc
- Intergra LifeSciences
- 3M
- ConvaTec Group PLC
- Dr Morepen
- Mankind Pharma
- Cardinal Health
- Cipla Limited
- Trio Lifescience Pvt Ltd
- Johnson & Johnson
- Sun Pharmaceutical Industries Ltd (Ranbaxy Laboratories Limited)
- GlaxoSmithKline PLC
- Pfizer Inc
Notable Milestones in Burn Ointment Industry Sector
- May 2022: Molnlycke Healthcare submitted clinical evidence on Mediplex Ag for partial-thickness burns at Wound International 2022.
- April 2022: Hospices Civils de Lyon sponsored a clinical trial on silver sulphadiazine for second-degree burns (estimated start: September 2022).
In-Depth Burn Ointment Industry Market Outlook
The burn ointment market is poised for significant growth driven by technological innovation, expanding healthcare infrastructure in emerging markets, and rising awareness of effective burn wound management. Strategic partnerships, product diversification, and focused marketing efforts will be crucial for companies to capitalize on the market's future potential. The increasing prevalence of chronic wounds and the demand for advanced wound care solutions present significant opportunities for market expansion and innovation.
Burn Ointment Industry Segmentation
-
1. Product Type
- 1.1. Topical Antibiotics
- 1.2. Silver
- 1.3. Iodine
-
2. Depth of Burn
- 2.1. Minor Burns
- 2.2. Partial Thickness Burns
- 2.3. Full Thickness Burns
-
3. End User
- 3.1. Hospitals and Clinics
- 3.2. Other End Users
Burn Ointment Industry Segmentation By Geography
-
1. North America
- 1.1. United States
- 1.2. Canada
- 1.3. Mexico
-
2. Europe
- 2.1. Germany
- 2.2. United Kingdom
- 2.3. France
- 2.4. Italy
- 2.5. Spain
- 2.6. Rest of Europe
-
3. Asia Pacific
- 3.1. China
- 3.2. Japan
- 3.3. India
- 3.4. Australia
- 3.5. South Korea
- 3.6. Rest of Asia Pacific
-
4. Middle East and Africa
- 4.1. GCC
- 4.2. South Africa
- 4.3. Rest of Middle East and Africa
-
5. South America
- 5.1. Brazil
- 5.2. Argentina
- 5.3. Rest of South America
Burn Ointment Industry REPORT HIGHLIGHTS
| Aspects | Details |
|---|---|
| Study Period | 2019-2033 |
| Base Year | 2024 |
| Estimated Year | 2025 |
| Forecast Period | 2025-2033 |
| Historical Period | 2019-2024 |
| Growth Rate | CAGR of 5.95% from 2019-2033 |
| Segmentation |
|
Table of Contents
- 1. Introduction
- 1.1. Research Scope
- 1.2. Market Segmentation
- 1.3. Research Methodology
- 1.4. Definitions and Assumptions
- 2. Executive Summary
- 2.1. Introduction
- 3. Market Dynamics
- 3.1. Introduction
- 3.2. Market Drivers
- 3.2.1. Rising Incidences of Burn; Increasing Awareness Regarding Treatment Options
- 3.3. Market Restrains
- 3.3.1. Side Effects Associated with Burn Ointment
- 3.4. Market Trends
- 3.4.1. The Topical Antibiotics Segment is Expected to Hold a Significant Market Share Over the Forecast Period
- 4. Market Factor Analysis
- 4.1. Porters Five Forces
- 4.2. Supply/Value Chain
- 4.3. PESTEL analysis
- 4.4. Market Entropy
- 4.5. Patent/Trademark Analysis
- 5. Global Burn Ointment Industry Analysis, Insights and Forecast, 2019-2031
- 5.1. Market Analysis, Insights and Forecast - by Product Type
- 5.1.1. Topical Antibiotics
- 5.1.2. Silver
- 5.1.3. Iodine
- 5.2. Market Analysis, Insights and Forecast - by Depth of Burn
- 5.2.1. Minor Burns
- 5.2.2. Partial Thickness Burns
- 5.2.3. Full Thickness Burns
- 5.3. Market Analysis, Insights and Forecast - by End User
- 5.3.1. Hospitals and Clinics
- 5.3.2. Other End Users
- 5.4. Market Analysis, Insights and Forecast - by Region
- 5.4.1. North America
- 5.4.2. Europe
- 5.4.3. Asia Pacific
- 5.4.4. Middle East and Africa
- 5.4.5. South America
- 5.1. Market Analysis, Insights and Forecast - by Product Type
- 6. North America Burn Ointment Industry Analysis, Insights and Forecast, 2019-2031
- 6.1. Market Analysis, Insights and Forecast - by Product Type
- 6.1.1. Topical Antibiotics
- 6.1.2. Silver
- 6.1.3. Iodine
- 6.2. Market Analysis, Insights and Forecast - by Depth of Burn
- 6.2.1. Minor Burns
- 6.2.2. Partial Thickness Burns
- 6.2.3. Full Thickness Burns
- 6.3. Market Analysis, Insights and Forecast - by End User
- 6.3.1. Hospitals and Clinics
- 6.3.2. Other End Users
- 6.1. Market Analysis, Insights and Forecast - by Product Type
- 7. Europe Burn Ointment Industry Analysis, Insights and Forecast, 2019-2031
- 7.1. Market Analysis, Insights and Forecast - by Product Type
- 7.1.1. Topical Antibiotics
- 7.1.2. Silver
- 7.1.3. Iodine
- 7.2. Market Analysis, Insights and Forecast - by Depth of Burn
- 7.2.1. Minor Burns
- 7.2.2. Partial Thickness Burns
- 7.2.3. Full Thickness Burns
- 7.3. Market Analysis, Insights and Forecast - by End User
- 7.3.1. Hospitals and Clinics
- 7.3.2. Other End Users
- 7.1. Market Analysis, Insights and Forecast - by Product Type
- 8. Asia Pacific Burn Ointment Industry Analysis, Insights and Forecast, 2019-2031
- 8.1. Market Analysis, Insights and Forecast - by Product Type
- 8.1.1. Topical Antibiotics
- 8.1.2. Silver
- 8.1.3. Iodine
- 8.2. Market Analysis, Insights and Forecast - by Depth of Burn
- 8.2.1. Minor Burns
- 8.2.2. Partial Thickness Burns
- 8.2.3. Full Thickness Burns
- 8.3. Market Analysis, Insights and Forecast - by End User
- 8.3.1. Hospitals and Clinics
- 8.3.2. Other End Users
- 8.1. Market Analysis, Insights and Forecast - by Product Type
- 9. Middle East and Africa Burn Ointment Industry Analysis, Insights and Forecast, 2019-2031
- 9.1. Market Analysis, Insights and Forecast - by Product Type
- 9.1.1. Topical Antibiotics
- 9.1.2. Silver
- 9.1.3. Iodine
- 9.2. Market Analysis, Insights and Forecast - by Depth of Burn
- 9.2.1. Minor Burns
- 9.2.2. Partial Thickness Burns
- 9.2.3. Full Thickness Burns
- 9.3. Market Analysis, Insights and Forecast - by End User
- 9.3.1. Hospitals and Clinics
- 9.3.2. Other End Users
- 9.1. Market Analysis, Insights and Forecast - by Product Type
- 10. South America Burn Ointment Industry Analysis, Insights and Forecast, 2019-2031
- 10.1. Market Analysis, Insights and Forecast - by Product Type
- 10.1.1. Topical Antibiotics
- 10.1.2. Silver
- 10.1.3. Iodine
- 10.2. Market Analysis, Insights and Forecast - by Depth of Burn
- 10.2.1. Minor Burns
- 10.2.2. Partial Thickness Burns
- 10.2.3. Full Thickness Burns
- 10.3. Market Analysis, Insights and Forecast - by End User
- 10.3.1. Hospitals and Clinics
- 10.3.2. Other End Users
- 10.1. Market Analysis, Insights and Forecast - by Product Type
- 11. North America Burn Ointment Industry Analysis, Insights and Forecast, 2019-2031
- 11.1. Market Analysis, Insights and Forecast - By Country/Sub-region
- 11.1.1 United States
- 11.1.2 Canada
- 11.1.3 Mexico
- 12. South America Burn Ointment Industry Analysis, Insights and Forecast, 2019-2031
- 12.1. Market Analysis, Insights and Forecast - By Country/Sub-region
- 12.1.1 Brazil
- 12.1.2 Mexico
- 12.1.3 Rest of South America
- 13. Europe Burn Ointment Industry Analysis, Insights and Forecast, 2019-2031
- 13.1. Market Analysis, Insights and Forecast - By Country/Sub-region
- 13.1.1 United Kingdom
- 13.1.2 Germany
- 13.1.3 France
- 13.1.4 Italy
- 13.1.5 Spain
- 13.1.6 Russia
- 13.1.7 Rest of Europe
- 14. Asia Pacific Burn Ointment Industry Analysis, Insights and Forecast, 2019-2031
- 14.1. Market Analysis, Insights and Forecast - By Country/Sub-region
- 14.1.1 China
- 14.1.2 Japan
- 14.1.3 India
- 14.1.4 South Korea
- 14.1.5 Taiwan
- 14.1.6 Australia
- 14.1.7 Rest of Asia-Pacific
- 15. MEA Burn Ointment Industry Analysis, Insights and Forecast, 2019-2031
- 15.1. Market Analysis, Insights and Forecast - By Country/Sub-region
- 15.1.1 Middle East
- 15.1.2 Africa
- 16. Competitive Analysis
- 16.1. Global Market Share Analysis 2024
- 16.2. Company Profiles
- 16.2.1 Smith & Nephew PLC
- 16.2.1.1. Overview
- 16.2.1.2. Products
- 16.2.1.3. SWOT Analysis
- 16.2.1.4. Recent Developments
- 16.2.1.5. Financials (Based on Availability)
- 16.2.2 Perrigo Company PLC
- 16.2.2.1. Overview
- 16.2.2.2. Products
- 16.2.2.3. SWOT Analysis
- 16.2.2.4. Recent Developments
- 16.2.2.5. Financials (Based on Availability)
- 16.2.3 DeRoyal Industries Inc
- 16.2.3.1. Overview
- 16.2.3.2. Products
- 16.2.3.3. SWOT Analysis
- 16.2.3.4. Recent Developments
- 16.2.3.5. Financials (Based on Availability)
- 16.2.4 Intergra LifeSciences
- 16.2.4.1. Overview
- 16.2.4.2. Products
- 16.2.4.3. SWOT Analysis
- 16.2.4.4. Recent Developments
- 16.2.4.5. Financials (Based on Availability)
- 16.2.5 3M
- 16.2.5.1. Overview
- 16.2.5.2. Products
- 16.2.5.3. SWOT Analysis
- 16.2.5.4. Recent Developments
- 16.2.5.5. Financials (Based on Availability)
- 16.2.6 ConvaTec Group PLC
- 16.2.6.1. Overview
- 16.2.6.2. Products
- 16.2.6.3. SWOT Analysis
- 16.2.6.4. Recent Developments
- 16.2.6.5. Financials (Based on Availability)
- 16.2.7 Dr Morepen
- 16.2.7.1. Overview
- 16.2.7.2. Products
- 16.2.7.3. SWOT Analysis
- 16.2.7.4. Recent Developments
- 16.2.7.5. Financials (Based on Availability)
- 16.2.8 Mankind Pharma
- 16.2.8.1. Overview
- 16.2.8.2. Products
- 16.2.8.3. SWOT Analysis
- 16.2.8.4. Recent Developments
- 16.2.8.5. Financials (Based on Availability)
- 16.2.9 Cardinal Health
- 16.2.9.1. Overview
- 16.2.9.2. Products
- 16.2.9.3. SWOT Analysis
- 16.2.9.4. Recent Developments
- 16.2.9.5. Financials (Based on Availability)
- 16.2.10 Cipla Limited
- 16.2.10.1. Overview
- 16.2.10.2. Products
- 16.2.10.3. SWOT Analysis
- 16.2.10.4. Recent Developments
- 16.2.10.5. Financials (Based on Availability)
- 16.2.11 Trio Lifescience Pvt Ltd
- 16.2.11.1. Overview
- 16.2.11.2. Products
- 16.2.11.3. SWOT Analysis
- 16.2.11.4. Recent Developments
- 16.2.11.5. Financials (Based on Availability)
- 16.2.12 Johnson & Johnson
- 16.2.12.1. Overview
- 16.2.12.2. Products
- 16.2.12.3. SWOT Analysis
- 16.2.12.4. Recent Developments
- 16.2.12.5. Financials (Based on Availability)
- 16.2.13 Sun Pharmaceutical Industries Ltd (Ranbaxy Laboratories Limited)
- 16.2.13.1. Overview
- 16.2.13.2. Products
- 16.2.13.3. SWOT Analysis
- 16.2.13.4. Recent Developments
- 16.2.13.5. Financials (Based on Availability)
- 16.2.14 GlaxoSmithKline PLC
- 16.2.14.1. Overview
- 16.2.14.2. Products
- 16.2.14.3. SWOT Analysis
- 16.2.14.4. Recent Developments
- 16.2.14.5. Financials (Based on Availability)
- 16.2.15 Pfizer Inc
- 16.2.15.1. Overview
- 16.2.15.2. Products
- 16.2.15.3. SWOT Analysis
- 16.2.15.4. Recent Developments
- 16.2.15.5. Financials (Based on Availability)
- 16.2.1 Smith & Nephew PLC
List of Figures
- Figure 1: Global Burn Ointment Industry Revenue Breakdown (Billion, %) by Region 2024 & 2032
- Figure 2: Global Burn Ointment Industry Volume Breakdown (K Tons, %) by Region 2024 & 2032
- Figure 3: North America Burn Ointment Industry Revenue (Billion), by Country 2024 & 2032
- Figure 4: North America Burn Ointment Industry Volume (K Tons), by Country 2024 & 2032
- Figure 5: North America Burn Ointment Industry Revenue Share (%), by Country 2024 & 2032
- Figure 6: North America Burn Ointment Industry Volume Share (%), by Country 2024 & 2032
- Figure 7: South America Burn Ointment Industry Revenue (Billion), by Country 2024 & 2032
- Figure 8: South America Burn Ointment Industry Volume (K Tons), by Country 2024 & 2032
- Figure 9: South America Burn Ointment Industry Revenue Share (%), by Country 2024 & 2032
- Figure 10: South America Burn Ointment Industry Volume Share (%), by Country 2024 & 2032
- Figure 11: Europe Burn Ointment Industry Revenue (Billion), by Country 2024 & 2032
- Figure 12: Europe Burn Ointment Industry Volume (K Tons), by Country 2024 & 2032
- Figure 13: Europe Burn Ointment Industry Revenue Share (%), by Country 2024 & 2032
- Figure 14: Europe Burn Ointment Industry Volume Share (%), by Country 2024 & 2032
- Figure 15: Asia Pacific Burn Ointment Industry Revenue (Billion), by Country 2024 & 2032
- Figure 16: Asia Pacific Burn Ointment Industry Volume (K Tons), by Country 2024 & 2032
- Figure 17: Asia Pacific Burn Ointment Industry Revenue Share (%), by Country 2024 & 2032
- Figure 18: Asia Pacific Burn Ointment Industry Volume Share (%), by Country 2024 & 2032
- Figure 19: MEA Burn Ointment Industry Revenue (Billion), by Country 2024 & 2032
- Figure 20: MEA Burn Ointment Industry Volume (K Tons), by Country 2024 & 2032
- Figure 21: MEA Burn Ointment Industry Revenue Share (%), by Country 2024 & 2032
- Figure 22: MEA Burn Ointment Industry Volume Share (%), by Country 2024 & 2032
- Figure 23: North America Burn Ointment Industry Revenue (Billion), by Product Type 2024 & 2032
- Figure 24: North America Burn Ointment Industry Volume (K Tons), by Product Type 2024 & 2032
- Figure 25: North America Burn Ointment Industry Revenue Share (%), by Product Type 2024 & 2032
- Figure 26: North America Burn Ointment Industry Volume Share (%), by Product Type 2024 & 2032
- Figure 27: North America Burn Ointment Industry Revenue (Billion), by Depth of Burn 2024 & 2032
- Figure 28: North America Burn Ointment Industry Volume (K Tons), by Depth of Burn 2024 & 2032
- Figure 29: North America Burn Ointment Industry Revenue Share (%), by Depth of Burn 2024 & 2032
- Figure 30: North America Burn Ointment Industry Volume Share (%), by Depth of Burn 2024 & 2032
- Figure 31: North America Burn Ointment Industry Revenue (Billion), by End User 2024 & 2032
- Figure 32: North America Burn Ointment Industry Volume (K Tons), by End User 2024 & 2032
- Figure 33: North America Burn Ointment Industry Revenue Share (%), by End User 2024 & 2032
- Figure 34: North America Burn Ointment Industry Volume Share (%), by End User 2024 & 2032
- Figure 35: North America Burn Ointment Industry Revenue (Billion), by Country 2024 & 2032
- Figure 36: North America Burn Ointment Industry Volume (K Tons), by Country 2024 & 2032
- Figure 37: North America Burn Ointment Industry Revenue Share (%), by Country 2024 & 2032
- Figure 38: North America Burn Ointment Industry Volume Share (%), by Country 2024 & 2032
- Figure 39: Europe Burn Ointment Industry Revenue (Billion), by Product Type 2024 & 2032
- Figure 40: Europe Burn Ointment Industry Volume (K Tons), by Product Type 2024 & 2032
- Figure 41: Europe Burn Ointment Industry Revenue Share (%), by Product Type 2024 & 2032
- Figure 42: Europe Burn Ointment Industry Volume Share (%), by Product Type 2024 & 2032
- Figure 43: Europe Burn Ointment Industry Revenue (Billion), by Depth of Burn 2024 & 2032
- Figure 44: Europe Burn Ointment Industry Volume (K Tons), by Depth of Burn 2024 & 2032
- Figure 45: Europe Burn Ointment Industry Revenue Share (%), by Depth of Burn 2024 & 2032
- Figure 46: Europe Burn Ointment Industry Volume Share (%), by Depth of Burn 2024 & 2032
- Figure 47: Europe Burn Ointment Industry Revenue (Billion), by End User 2024 & 2032
- Figure 48: Europe Burn Ointment Industry Volume (K Tons), by End User 2024 & 2032
- Figure 49: Europe Burn Ointment Industry Revenue Share (%), by End User 2024 & 2032
- Figure 50: Europe Burn Ointment Industry Volume Share (%), by End User 2024 & 2032
- Figure 51: Europe Burn Ointment Industry Revenue (Billion), by Country 2024 & 2032
- Figure 52: Europe Burn Ointment Industry Volume (K Tons), by Country 2024 & 2032
- Figure 53: Europe Burn Ointment Industry Revenue Share (%), by Country 2024 & 2032
- Figure 54: Europe Burn Ointment Industry Volume Share (%), by Country 2024 & 2032
- Figure 55: Asia Pacific Burn Ointment Industry Revenue (Billion), by Product Type 2024 & 2032
- Figure 56: Asia Pacific Burn Ointment Industry Volume (K Tons), by Product Type 2024 & 2032
- Figure 57: Asia Pacific Burn Ointment Industry Revenue Share (%), by Product Type 2024 & 2032
- Figure 58: Asia Pacific Burn Ointment Industry Volume Share (%), by Product Type 2024 & 2032
- Figure 59: Asia Pacific Burn Ointment Industry Revenue (Billion), by Depth of Burn 2024 & 2032
- Figure 60: Asia Pacific Burn Ointment Industry Volume (K Tons), by Depth of Burn 2024 & 2032
- Figure 61: Asia Pacific Burn Ointment Industry Revenue Share (%), by Depth of Burn 2024 & 2032
- Figure 62: Asia Pacific Burn Ointment Industry Volume Share (%), by Depth of Burn 2024 & 2032
- Figure 63: Asia Pacific Burn Ointment Industry Revenue (Billion), by End User 2024 & 2032
- Figure 64: Asia Pacific Burn Ointment Industry Volume (K Tons), by End User 2024 & 2032
- Figure 65: Asia Pacific Burn Ointment Industry Revenue Share (%), by End User 2024 & 2032
- Figure 66: Asia Pacific Burn Ointment Industry Volume Share (%), by End User 2024 & 2032
- Figure 67: Asia Pacific Burn Ointment Industry Revenue (Billion), by Country 2024 & 2032
- Figure 68: Asia Pacific Burn Ointment Industry Volume (K Tons), by Country 2024 & 2032
- Figure 69: Asia Pacific Burn Ointment Industry Revenue Share (%), by Country 2024 & 2032
- Figure 70: Asia Pacific Burn Ointment Industry Volume Share (%), by Country 2024 & 2032
- Figure 71: Middle East and Africa Burn Ointment Industry Revenue (Billion), by Product Type 2024 & 2032
- Figure 72: Middle East and Africa Burn Ointment Industry Volume (K Tons), by Product Type 2024 & 2032
- Figure 73: Middle East and Africa Burn Ointment Industry Revenue Share (%), by Product Type 2024 & 2032
- Figure 74: Middle East and Africa Burn Ointment Industry Volume Share (%), by Product Type 2024 & 2032
- Figure 75: Middle East and Africa Burn Ointment Industry Revenue (Billion), by Depth of Burn 2024 & 2032
- Figure 76: Middle East and Africa Burn Ointment Industry Volume (K Tons), by Depth of Burn 2024 & 2032
- Figure 77: Middle East and Africa Burn Ointment Industry Revenue Share (%), by Depth of Burn 2024 & 2032
- Figure 78: Middle East and Africa Burn Ointment Industry Volume Share (%), by Depth of Burn 2024 & 2032
- Figure 79: Middle East and Africa Burn Ointment Industry Revenue (Billion), by End User 2024 & 2032
- Figure 80: Middle East and Africa Burn Ointment Industry Volume (K Tons), by End User 2024 & 2032
- Figure 81: Middle East and Africa Burn Ointment Industry Revenue Share (%), by End User 2024 & 2032
- Figure 82: Middle East and Africa Burn Ointment Industry Volume Share (%), by End User 2024 & 2032
- Figure 83: Middle East and Africa Burn Ointment Industry Revenue (Billion), by Country 2024 & 2032
- Figure 84: Middle East and Africa Burn Ointment Industry Volume (K Tons), by Country 2024 & 2032
- Figure 85: Middle East and Africa Burn Ointment Industry Revenue Share (%), by Country 2024 & 2032
- Figure 86: Middle East and Africa Burn Ointment Industry Volume Share (%), by Country 2024 & 2032
- Figure 87: South America Burn Ointment Industry Revenue (Billion), by Product Type 2024 & 2032
- Figure 88: South America Burn Ointment Industry Volume (K Tons), by Product Type 2024 & 2032
- Figure 89: South America Burn Ointment Industry Revenue Share (%), by Product Type 2024 & 2032
- Figure 90: South America Burn Ointment Industry Volume Share (%), by Product Type 2024 & 2032
- Figure 91: South America Burn Ointment Industry Revenue (Billion), by Depth of Burn 2024 & 2032
- Figure 92: South America Burn Ointment Industry Volume (K Tons), by Depth of Burn 2024 & 2032
- Figure 93: South America Burn Ointment Industry Revenue Share (%), by Depth of Burn 2024 & 2032
- Figure 94: South America Burn Ointment Industry Volume Share (%), by Depth of Burn 2024 & 2032
- Figure 95: South America Burn Ointment Industry Revenue (Billion), by End User 2024 & 2032
- Figure 96: South America Burn Ointment Industry Volume (K Tons), by End User 2024 & 2032
- Figure 97: South America Burn Ointment Industry Revenue Share (%), by End User 2024 & 2032
- Figure 98: South America Burn Ointment Industry Volume Share (%), by End User 2024 & 2032
- Figure 99: South America Burn Ointment Industry Revenue (Billion), by Country 2024 & 2032
- Figure 100: South America Burn Ointment Industry Volume (K Tons), by Country 2024 & 2032
- Figure 101: South America Burn Ointment Industry Revenue Share (%), by Country 2024 & 2032
- Figure 102: South America Burn Ointment Industry Volume Share (%), by Country 2024 & 2032
List of Tables
- Table 1: Global Burn Ointment Industry Revenue Billion Forecast, by Region 2019 & 2032
- Table 2: Global Burn Ointment Industry Volume K Tons Forecast, by Region 2019 & 2032
- Table 3: Global Burn Ointment Industry Revenue Billion Forecast, by Product Type 2019 & 2032
- Table 4: Global Burn Ointment Industry Volume K Tons Forecast, by Product Type 2019 & 2032
- Table 5: Global Burn Ointment Industry Revenue Billion Forecast, by Depth of Burn 2019 & 2032
- Table 6: Global Burn Ointment Industry Volume K Tons Forecast, by Depth of Burn 2019 & 2032
- Table 7: Global Burn Ointment Industry Revenue Billion Forecast, by End User 2019 & 2032
- Table 8: Global Burn Ointment Industry Volume K Tons Forecast, by End User 2019 & 2032
- Table 9: Global Burn Ointment Industry Revenue Billion Forecast, by Region 2019 & 2032
- Table 10: Global Burn Ointment Industry Volume K Tons Forecast, by Region 2019 & 2032
- Table 11: Global Burn Ointment Industry Revenue Billion Forecast, by Country 2019 & 2032
- Table 12: Global Burn Ointment Industry Volume K Tons Forecast, by Country 2019 & 2032
- Table 13: United States Burn Ointment Industry Revenue (Billion) Forecast, by Application 2019 & 2032
- Table 14: United States Burn Ointment Industry Volume (K Tons) Forecast, by Application 2019 & 2032
- Table 15: Canada Burn Ointment Industry Revenue (Billion) Forecast, by Application 2019 & 2032
- Table 16: Canada Burn Ointment Industry Volume (K Tons) Forecast, by Application 2019 & 2032
- Table 17: Mexico Burn Ointment Industry Revenue (Billion) Forecast, by Application 2019 & 2032
- Table 18: Mexico Burn Ointment Industry Volume (K Tons) Forecast, by Application 2019 & 2032
- Table 19: Global Burn Ointment Industry Revenue Billion Forecast, by Country 2019 & 2032
- Table 20: Global Burn Ointment Industry Volume K Tons Forecast, by Country 2019 & 2032
- Table 21: Brazil Burn Ointment Industry Revenue (Billion) Forecast, by Application 2019 & 2032
- Table 22: Brazil Burn Ointment Industry Volume (K Tons) Forecast, by Application 2019 & 2032
- Table 23: Mexico Burn Ointment Industry Revenue (Billion) Forecast, by Application 2019 & 2032
- Table 24: Mexico Burn Ointment Industry Volume (K Tons) Forecast, by Application 2019 & 2032
- Table 25: Rest of South America Burn Ointment Industry Revenue (Billion) Forecast, by Application 2019 & 2032
- Table 26: Rest of South America Burn Ointment Industry Volume (K Tons) Forecast, by Application 2019 & 2032
- Table 27: Global Burn Ointment Industry Revenue Billion Forecast, by Country 2019 & 2032
- Table 28: Global Burn Ointment Industry Volume K Tons Forecast, by Country 2019 & 2032
- Table 29: United Kingdom Burn Ointment Industry Revenue (Billion) Forecast, by Application 2019 & 2032
- Table 30: United Kingdom Burn Ointment Industry Volume (K Tons) Forecast, by Application 2019 & 2032
- Table 31: Germany Burn Ointment Industry Revenue (Billion) Forecast, by Application 2019 & 2032
- Table 32: Germany Burn Ointment Industry Volume (K Tons) Forecast, by Application 2019 & 2032
- Table 33: France Burn Ointment Industry Revenue (Billion) Forecast, by Application 2019 & 2032
- Table 34: France Burn Ointment Industry Volume (K Tons) Forecast, by Application 2019 & 2032
- Table 35: Italy Burn Ointment Industry Revenue (Billion) Forecast, by Application 2019 & 2032
- Table 36: Italy Burn Ointment Industry Volume (K Tons) Forecast, by Application 2019 & 2032
- Table 37: Spain Burn Ointment Industry Revenue (Billion) Forecast, by Application 2019 & 2032
- Table 38: Spain Burn Ointment Industry Volume (K Tons) Forecast, by Application 2019 & 2032
- Table 39: Russia Burn Ointment Industry Revenue (Billion) Forecast, by Application 2019 & 2032
- Table 40: Russia Burn Ointment Industry Volume (K Tons) Forecast, by Application 2019 & 2032
- Table 41: Rest of Europe Burn Ointment Industry Revenue (Billion) Forecast, by Application 2019 & 2032
- Table 42: Rest of Europe Burn Ointment Industry Volume (K Tons) Forecast, by Application 2019 & 2032
- Table 43: Global Burn Ointment Industry Revenue Billion Forecast, by Country 2019 & 2032
- Table 44: Global Burn Ointment Industry Volume K Tons Forecast, by Country 2019 & 2032
- Table 45: China Burn Ointment Industry Revenue (Billion) Forecast, by Application 2019 & 2032
- Table 46: China Burn Ointment Industry Volume (K Tons) Forecast, by Application 2019 & 2032
- Table 47: Japan Burn Ointment Industry Revenue (Billion) Forecast, by Application 2019 & 2032
- Table 48: Japan Burn Ointment Industry Volume (K Tons) Forecast, by Application 2019 & 2032
- Table 49: India Burn Ointment Industry Revenue (Billion) Forecast, by Application 2019 & 2032
- Table 50: India Burn Ointment Industry Volume (K Tons) Forecast, by Application 2019 & 2032
- Table 51: South Korea Burn Ointment Industry Revenue (Billion) Forecast, by Application 2019 & 2032
- Table 52: South Korea Burn Ointment Industry Volume (K Tons) Forecast, by Application 2019 & 2032
- Table 53: Taiwan Burn Ointment Industry Revenue (Billion) Forecast, by Application 2019 & 2032
- Table 54: Taiwan Burn Ointment Industry Volume (K Tons) Forecast, by Application 2019 & 2032
- Table 55: Australia Burn Ointment Industry Revenue (Billion) Forecast, by Application 2019 & 2032
- Table 56: Australia Burn Ointment Industry Volume (K Tons) Forecast, by Application 2019 & 2032
- Table 57: Rest of Asia-Pacific Burn Ointment Industry Revenue (Billion) Forecast, by Application 2019 & 2032
- Table 58: Rest of Asia-Pacific Burn Ointment Industry Volume (K Tons) Forecast, by Application 2019 & 2032
- Table 59: Global Burn Ointment Industry Revenue Billion Forecast, by Country 2019 & 2032
- Table 60: Global Burn Ointment Industry Volume K Tons Forecast, by Country 2019 & 2032
- Table 61: Middle East Burn Ointment Industry Revenue (Billion) Forecast, by Application 2019 & 2032
- Table 62: Middle East Burn Ointment Industry Volume (K Tons) Forecast, by Application 2019 & 2032
- Table 63: Africa Burn Ointment Industry Revenue (Billion) Forecast, by Application 2019 & 2032
- Table 64: Africa Burn Ointment Industry Volume (K Tons) Forecast, by Application 2019 & 2032
- Table 65: Global Burn Ointment Industry Revenue Billion Forecast, by Product Type 2019 & 2032
- Table 66: Global Burn Ointment Industry Volume K Tons Forecast, by Product Type 2019 & 2032
- Table 67: Global Burn Ointment Industry Revenue Billion Forecast, by Depth of Burn 2019 & 2032
- Table 68: Global Burn Ointment Industry Volume K Tons Forecast, by Depth of Burn 2019 & 2032
- Table 69: Global Burn Ointment Industry Revenue Billion Forecast, by End User 2019 & 2032
- Table 70: Global Burn Ointment Industry Volume K Tons Forecast, by End User 2019 & 2032
- Table 71: Global Burn Ointment Industry Revenue Billion Forecast, by Country 2019 & 2032
- Table 72: Global Burn Ointment Industry Volume K Tons Forecast, by Country 2019 & 2032
- Table 73: United States Burn Ointment Industry Revenue (Billion) Forecast, by Application 2019 & 2032
- Table 74: United States Burn Ointment Industry Volume (K Tons) Forecast, by Application 2019 & 2032
- Table 75: Canada Burn Ointment Industry Revenue (Billion) Forecast, by Application 2019 & 2032
- Table 76: Canada Burn Ointment Industry Volume (K Tons) Forecast, by Application 2019 & 2032
- Table 77: Mexico Burn Ointment Industry Revenue (Billion) Forecast, by Application 2019 & 2032
- Table 78: Mexico Burn Ointment Industry Volume (K Tons) Forecast, by Application 2019 & 2032
- Table 79: Global Burn Ointment Industry Revenue Billion Forecast, by Product Type 2019 & 2032
- Table 80: Global Burn Ointment Industry Volume K Tons Forecast, by Product Type 2019 & 2032
- Table 81: Global Burn Ointment Industry Revenue Billion Forecast, by Depth of Burn 2019 & 2032
- Table 82: Global Burn Ointment Industry Volume K Tons Forecast, by Depth of Burn 2019 & 2032
- Table 83: Global Burn Ointment Industry Revenue Billion Forecast, by End User 2019 & 2032
- Table 84: Global Burn Ointment Industry Volume K Tons Forecast, by End User 2019 & 2032
- Table 85: Global Burn Ointment Industry Revenue Billion Forecast, by Country 2019 & 2032
- Table 86: Global Burn Ointment Industry Volume K Tons Forecast, by Country 2019 & 2032
- Table 87: Germany Burn Ointment Industry Revenue (Billion) Forecast, by Application 2019 & 2032
- Table 88: Germany Burn Ointment Industry Volume (K Tons) Forecast, by Application 2019 & 2032
- Table 89: United Kingdom Burn Ointment Industry Revenue (Billion) Forecast, by Application 2019 & 2032
- Table 90: United Kingdom Burn Ointment Industry Volume (K Tons) Forecast, by Application 2019 & 2032
- Table 91: France Burn Ointment Industry Revenue (Billion) Forecast, by Application 2019 & 2032
- Table 92: France Burn Ointment Industry Volume (K Tons) Forecast, by Application 2019 & 2032
- Table 93: Italy Burn Ointment Industry Revenue (Billion) Forecast, by Application 2019 & 2032
- Table 94: Italy Burn Ointment Industry Volume (K Tons) Forecast, by Application 2019 & 2032
- Table 95: Spain Burn Ointment Industry Revenue (Billion) Forecast, by Application 2019 & 2032
- Table 96: Spain Burn Ointment Industry Volume (K Tons) Forecast, by Application 2019 & 2032
- Table 97: Rest of Europe Burn Ointment Industry Revenue (Billion) Forecast, by Application 2019 & 2032
- Table 98: Rest of Europe Burn Ointment Industry Volume (K Tons) Forecast, by Application 2019 & 2032
- Table 99: Global Burn Ointment Industry Revenue Billion Forecast, by Product Type 2019 & 2032
- Table 100: Global Burn Ointment Industry Volume K Tons Forecast, by Product Type 2019 & 2032
- Table 101: Global Burn Ointment Industry Revenue Billion Forecast, by Depth of Burn 2019 & 2032
- Table 102: Global Burn Ointment Industry Volume K Tons Forecast, by Depth of Burn 2019 & 2032
- Table 103: Global Burn Ointment Industry Revenue Billion Forecast, by End User 2019 & 2032
- Table 104: Global Burn Ointment Industry Volume K Tons Forecast, by End User 2019 & 2032
- Table 105: Global Burn Ointment Industry Revenue Billion Forecast, by Country 2019 & 2032
- Table 106: Global Burn Ointment Industry Volume K Tons Forecast, by Country 2019 & 2032
- Table 107: China Burn Ointment Industry Revenue (Billion) Forecast, by Application 2019 & 2032
- Table 108: China Burn Ointment Industry Volume (K Tons) Forecast, by Application 2019 & 2032
- Table 109: Japan Burn Ointment Industry Revenue (Billion) Forecast, by Application 2019 & 2032
- Table 110: Japan Burn Ointment Industry Volume (K Tons) Forecast, by Application 2019 & 2032
- Table 111: India Burn Ointment Industry Revenue (Billion) Forecast, by Application 2019 & 2032
- Table 112: India Burn Ointment Industry Volume (K Tons) Forecast, by Application 2019 & 2032
- Table 113: Australia Burn Ointment Industry Revenue (Billion) Forecast, by Application 2019 & 2032
- Table 114: Australia Burn Ointment Industry Volume (K Tons) Forecast, by Application 2019 & 2032
- Table 115: South Korea Burn Ointment Industry Revenue (Billion) Forecast, by Application 2019 & 2032
- Table 116: South Korea Burn Ointment Industry Volume (K Tons) Forecast, by Application 2019 & 2032
- Table 117: Rest of Asia Pacific Burn Ointment Industry Revenue (Billion) Forecast, by Application 2019 & 2032
- Table 118: Rest of Asia Pacific Burn Ointment Industry Volume (K Tons) Forecast, by Application 2019 & 2032
- Table 119: Global Burn Ointment Industry Revenue Billion Forecast, by Product Type 2019 & 2032
- Table 120: Global Burn Ointment Industry Volume K Tons Forecast, by Product Type 2019 & 2032
- Table 121: Global Burn Ointment Industry Revenue Billion Forecast, by Depth of Burn 2019 & 2032
- Table 122: Global Burn Ointment Industry Volume K Tons Forecast, by Depth of Burn 2019 & 2032
- Table 123: Global Burn Ointment Industry Revenue Billion Forecast, by End User 2019 & 2032
- Table 124: Global Burn Ointment Industry Volume K Tons Forecast, by End User 2019 & 2032
- Table 125: Global Burn Ointment Industry Revenue Billion Forecast, by Country 2019 & 2032
- Table 126: Global Burn Ointment Industry Volume K Tons Forecast, by Country 2019 & 2032
- Table 127: GCC Burn Ointment Industry Revenue (Billion) Forecast, by Application 2019 & 2032
- Table 128: GCC Burn Ointment Industry Volume (K Tons) Forecast, by Application 2019 & 2032
- Table 129: South Africa Burn Ointment Industry Revenue (Billion) Forecast, by Application 2019 & 2032
- Table 130: South Africa Burn Ointment Industry Volume (K Tons) Forecast, by Application 2019 & 2032
- Table 131: Rest of Middle East and Africa Burn Ointment Industry Revenue (Billion) Forecast, by Application 2019 & 2032
- Table 132: Rest of Middle East and Africa Burn Ointment Industry Volume (K Tons) Forecast, by Application 2019 & 2032
- Table 133: Global Burn Ointment Industry Revenue Billion Forecast, by Product Type 2019 & 2032
- Table 134: Global Burn Ointment Industry Volume K Tons Forecast, by Product Type 2019 & 2032
- Table 135: Global Burn Ointment Industry Revenue Billion Forecast, by Depth of Burn 2019 & 2032
- Table 136: Global Burn Ointment Industry Volume K Tons Forecast, by Depth of Burn 2019 & 2032
- Table 137: Global Burn Ointment Industry Revenue Billion Forecast, by End User 2019 & 2032
- Table 138: Global Burn Ointment Industry Volume K Tons Forecast, by End User 2019 & 2032
- Table 139: Global Burn Ointment Industry Revenue Billion Forecast, by Country 2019 & 2032
- Table 140: Global Burn Ointment Industry Volume K Tons Forecast, by Country 2019 & 2032
- Table 141: Brazil Burn Ointment Industry Revenue (Billion) Forecast, by Application 2019 & 2032
- Table 142: Brazil Burn Ointment Industry Volume (K Tons) Forecast, by Application 2019 & 2032
- Table 143: Argentina Burn Ointment Industry Revenue (Billion) Forecast, by Application 2019 & 2032
- Table 144: Argentina Burn Ointment Industry Volume (K Tons) Forecast, by Application 2019 & 2032
- Table 145: Rest of South America Burn Ointment Industry Revenue (Billion) Forecast, by Application 2019 & 2032
- Table 146: Rest of South America Burn Ointment Industry Volume (K Tons) Forecast, by Application 2019 & 2032
Frequently Asked Questions
1. What is the projected Compound Annual Growth Rate (CAGR) of the Burn Ointment Industry?
The projected CAGR is approximately 5.95%.
2. Which companies are prominent players in the Burn Ointment Industry?
Key companies in the market include Smith & Nephew PLC, Perrigo Company PLC, DeRoyal Industries Inc, Intergra LifeSciences, 3M, ConvaTec Group PLC, Dr Morepen, Mankind Pharma, Cardinal Health, Cipla Limited, Trio Lifescience Pvt Ltd, Johnson & Johnson, Sun Pharmaceutical Industries Ltd (Ranbaxy Laboratories Limited), GlaxoSmithKline PLC, Pfizer Inc.
3. What are the main segments of the Burn Ointment Industry?
The market segments include Product Type, Depth of Burn, End User.
4. Can you provide details about the market size?
The market size is estimated to be USD 1.1 Billion as of 2022.
5. What are some drivers contributing to market growth?
Rising Incidences of Burn; Increasing Awareness Regarding Treatment Options.
6. What are the notable trends driving market growth?
The Topical Antibiotics Segment is Expected to Hold a Significant Market Share Over the Forecast Period.
7. Are there any restraints impacting market growth?
Side Effects Associated with Burn Ointment.
8. Can you provide examples of recent developments in the market?
In May 2022, Molncyke Healthcare sunmitted the clinical evidence in Wound International 2022 on the use of Mediplex Ag for the management of partial thickness burns. The soft silicone wound contact layer in Mediplex designed to help minimise wound and peri-wound trauma and associated pain aided in the burn healing.
9. What pricing options are available for accessing the report?
Pricing options include single-user, multi-user, and enterprise licenses priced at USD 4750, USD 5250, and USD 8750 respectively.
10. Is the market size provided in terms of value or volume?
The market size is provided in terms of value, measured in Billion and volume, measured in K Tons.
11. Are there any specific market keywords associated with the report?
Yes, the market keyword associated with the report is "Burn Ointment Industry," which aids in identifying and referencing the specific market segment covered.
12. How do I determine which pricing option suits my needs best?
The pricing options vary based on user requirements and access needs. Individual users may opt for single-user licenses, while businesses requiring broader access may choose multi-user or enterprise licenses for cost-effective access to the report.
13. Are there any additional resources or data provided in the Burn Ointment Industry report?
While the report offers comprehensive insights, it's advisable to review the specific contents or supplementary materials provided to ascertain if additional resources or data are available.
14. How can I stay updated on further developments or reports in the Burn Ointment Industry?
To stay informed about further developments, trends, and reports in the Burn Ointment Industry, consider subscribing to industry newsletters, following relevant companies and organizations, or regularly checking reputable industry news sources and publications.
Methodology
Step 1 - Identification of Relevant Samples Size from Population Database


Step 2 - Approaches for Defining Global Market Size (Value, Volume* & Price*)

Note*: In applicable scenarios
Step 3 - Data Sources
Primary Research
- Web Analytics
- Survey Reports
- Research Institute
- Latest Research Reports
- Opinion Leaders
Secondary Research
- Annual Reports
- White Paper
- Latest Press Release
- Industry Association
- Paid Database
- Investor Presentations

Step 4 - Data Triangulation
Involves using different sources of information in order to increase the validity of a study
These sources are likely to be stakeholders in a program - participants, other researchers, program staff, other community members, and so on.
Then we put all data in single framework & apply various statistical tools to find out the dynamic on the market.
During the analysis stage, feedback from the stakeholder groups would be compared to determine areas of agreement as well as areas of divergence
