

Key Insights
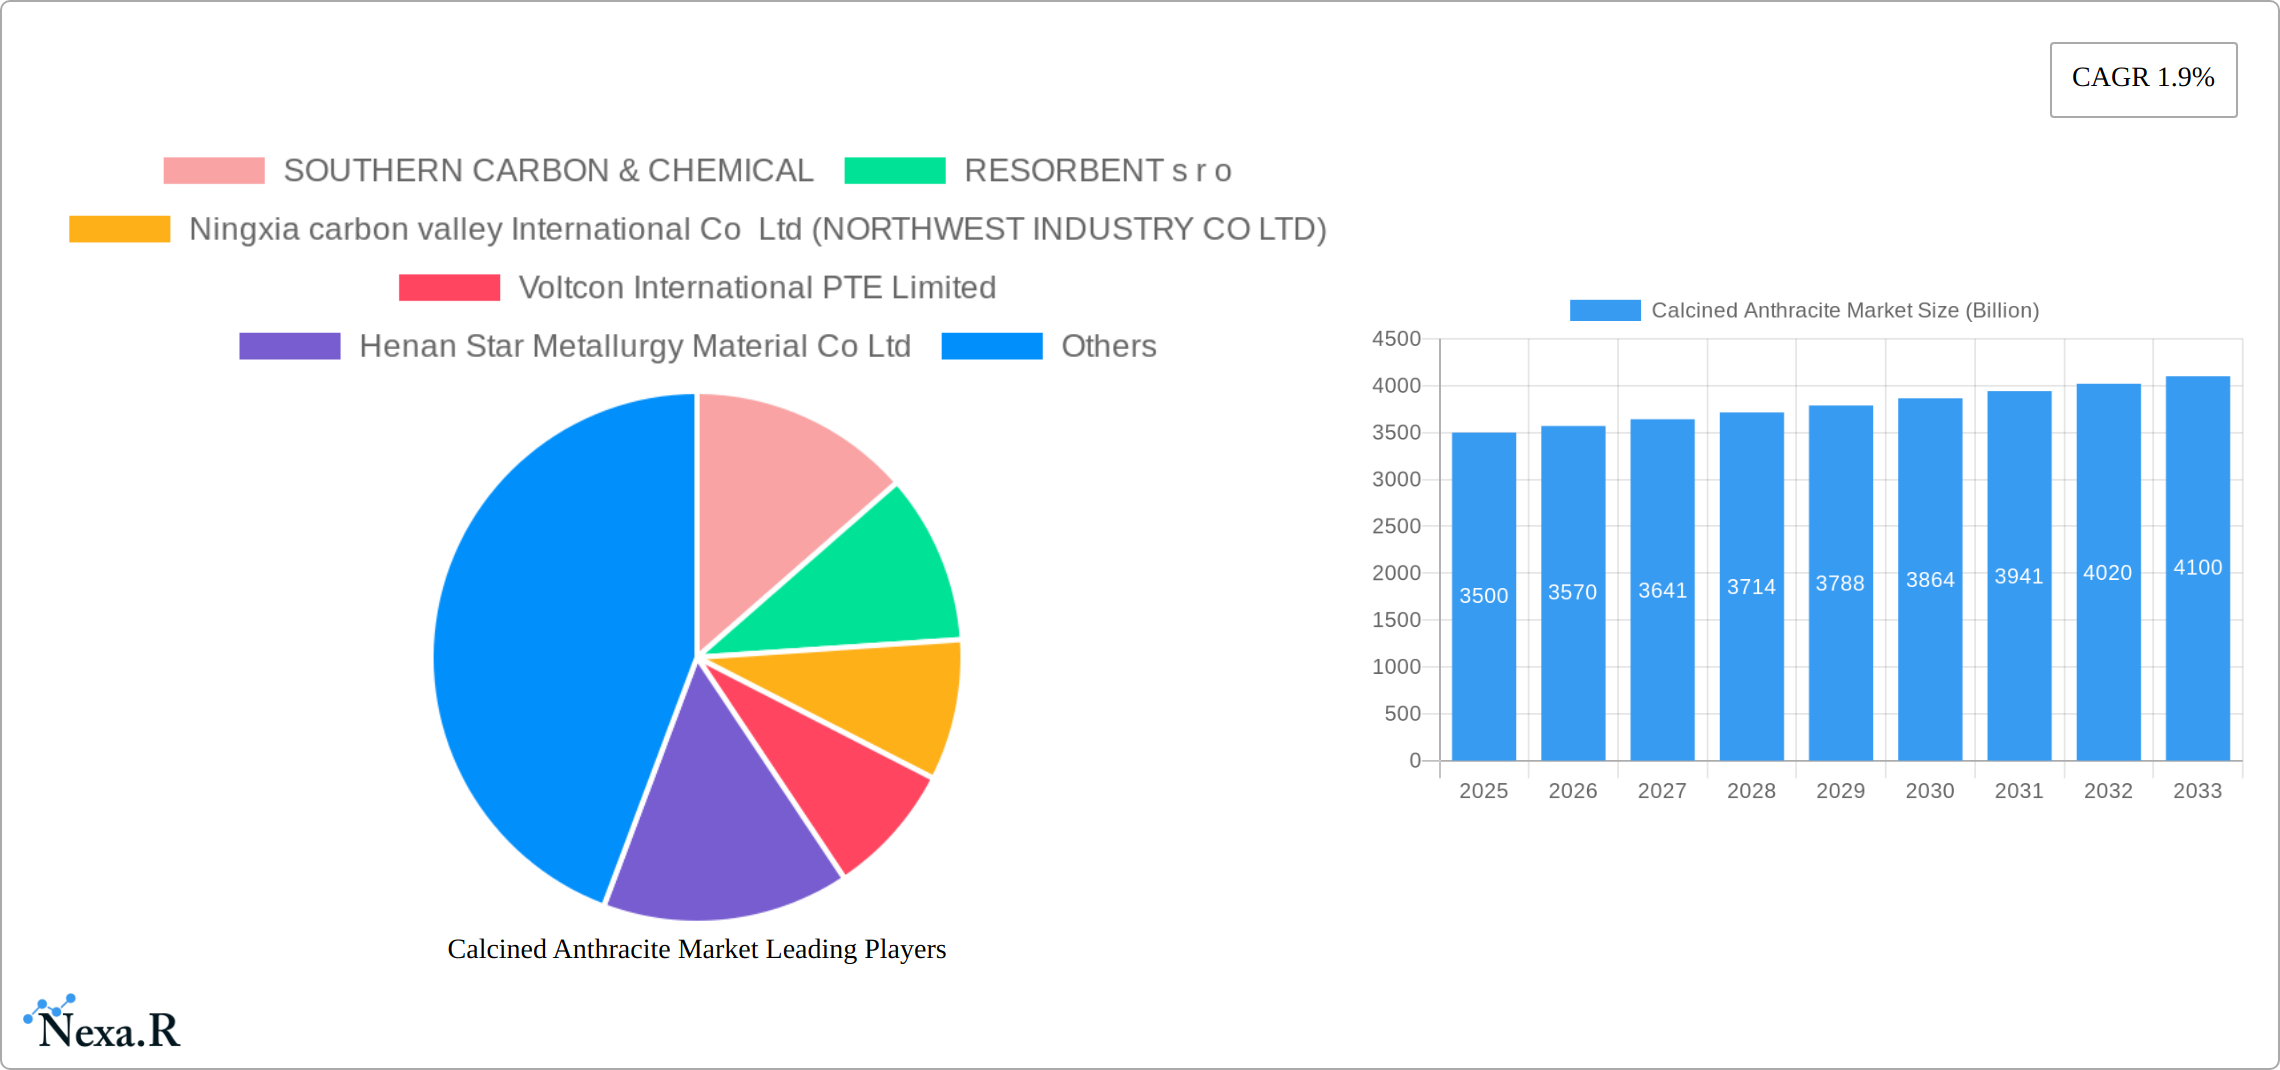
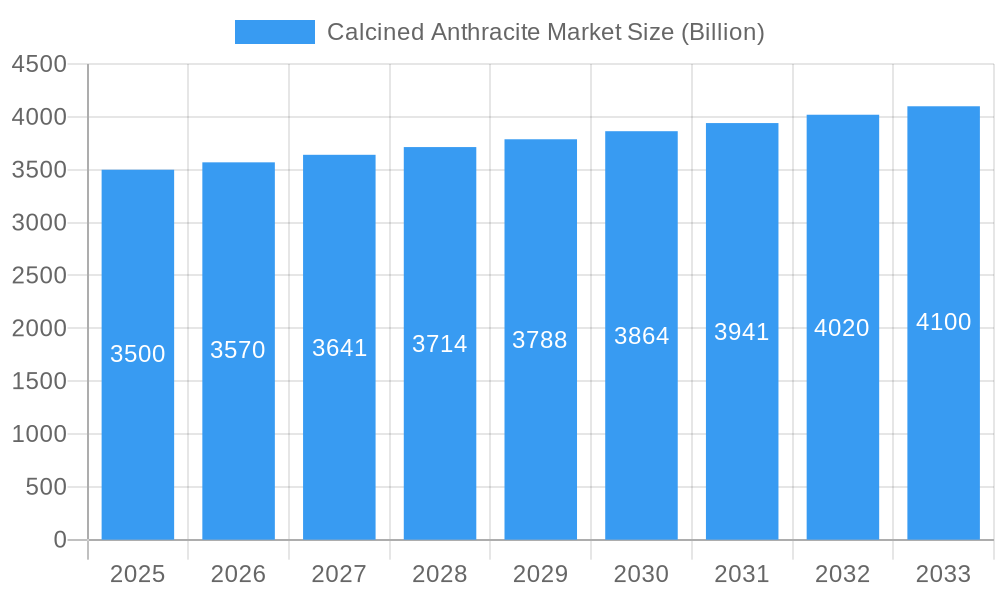
The calcined anthracite market, valued at $3.5 billion in 2025, is projected to experience steady growth, driven by increasing demand from key industries such as steelmaking and filtration. A compound annual growth rate (CAGR) of 1.9% from 2025 to 2033 indicates a continued, albeit moderate, expansion. This growth is fueled by the unique properties of calcined anthracite, including its high purity, reactivity, and abrasion resistance, making it a preferred material in various applications. The steel industry, specifically blast furnaces, basic oxygen steelmaking (BOS), and electric arc furnaces, represents a significant portion of the market. The increasing adoption of environmentally friendly steel production methods further contributes to the demand for calcined anthracite, as it offers advantages in terms of reducing emissions. Growth is also expected from other applications such as electrode manufacturing and as a filter medium, reflecting its versatility and performance across diverse sectors. Regional variations in market growth are anticipated, with Asia-Pacific, particularly China, expected to dominate due to its large steel production capacity. However, growth in other regions, including North America and Europe, is projected to be driven by increasing industrial activity and infrastructural development.
Calcined Anthracite Market Market Size (In Billion)
While the market enjoys steady growth, challenges remain. Fluctuations in raw material prices (anthracite) and energy costs can impact profitability. Competition from alternative materials, such as petroleum coke, may also pose a challenge. Furthermore, stricter environmental regulations in certain regions could potentially lead to increased production costs and compliance burdens. Nevertheless, the calcined anthracite market is positioned for continued growth, driven by its inherent material properties and enduring applications in vital industrial sectors. Technological advancements focusing on improving production efficiency and reducing environmental impact could further enhance the market outlook.
Calcined Anthracite Market Company Market Share
Calcined Anthracite Market: A Comprehensive Report (2019-2033)
This comprehensive report offers a detailed analysis of the global Calcined Anthracite market, providing invaluable insights for industry professionals, investors, and stakeholders. The report covers the period from 2019 to 2033, with a focus on the forecast period from 2025 to 2033 and a base year of 2025. The market is segmented by calcination type (Gas, Electrical) and application (Pulverized Coal Injection (Blast furnace), Basic Oxygen Steel Making (BOS), Electric Arc Furnace, Others (Electrodes, Filter Medium, etc.)), offering a granular understanding of market dynamics and growth potential. The total market size is projected to reach xx Billion by 2033.
Calcined Anthracite Market Market Dynamics & Structure
The Calcined Anthracite market exhibits a moderately consolidated structure, with key players holding significant market share. Technological innovation, particularly in calcination processes and application optimization, plays a crucial role in shaping market dynamics. Stringent environmental regulations and evolving industry standards are significantly impacting manufacturing processes and product development. The market faces competition from alternative materials, particularly in specific applications. End-user demographics, primarily concentrated in the steel and metal industries, are key drivers of market demand. M&A activity has been relatively moderate, with xx deals recorded in the historical period, driving consolidation and market share shifts.
- Market Concentration: Moderately consolidated, with top 5 players holding approximately xx% market share in 2024.
- Technological Innovation: Focus on energy efficiency and reduced emissions driving innovation in calcination techniques.
- Regulatory Framework: Stringent environmental regulations shaping product development and manufacturing processes.
- Competitive Substitutes: Alternative materials (e.g., graphite) posing competition in specific applications.
- End-User Demographics: Primarily steel and metal industries driving demand.
- M&A Trends: xx M&A deals recorded between 2019 and 2024, indicating moderate consolidation.
Calcined Anthracite Market Growth Trends & Insights
The Calcined Anthracite market experienced a compound annual growth rate (CAGR) of xx% during the historical period (2019-2024). Market size was valued at xx Billion in 2024 and is projected to reach xx Billion by 2033, exhibiting a CAGR of xx% during the forecast period. This growth is fueled by increasing steel production globally, particularly in developing economies. Technological advancements leading to improved product quality and efficiency are driving adoption rates across various applications. Consumer behavior shifts towards sustainability and environmental responsibility are also influencing market dynamics, fostering demand for eco-friendly production methods. Market penetration in emerging regions remains relatively low, presenting significant growth opportunities.
Dominant Regions, Countries, or Segments in Calcined Anthracite Market
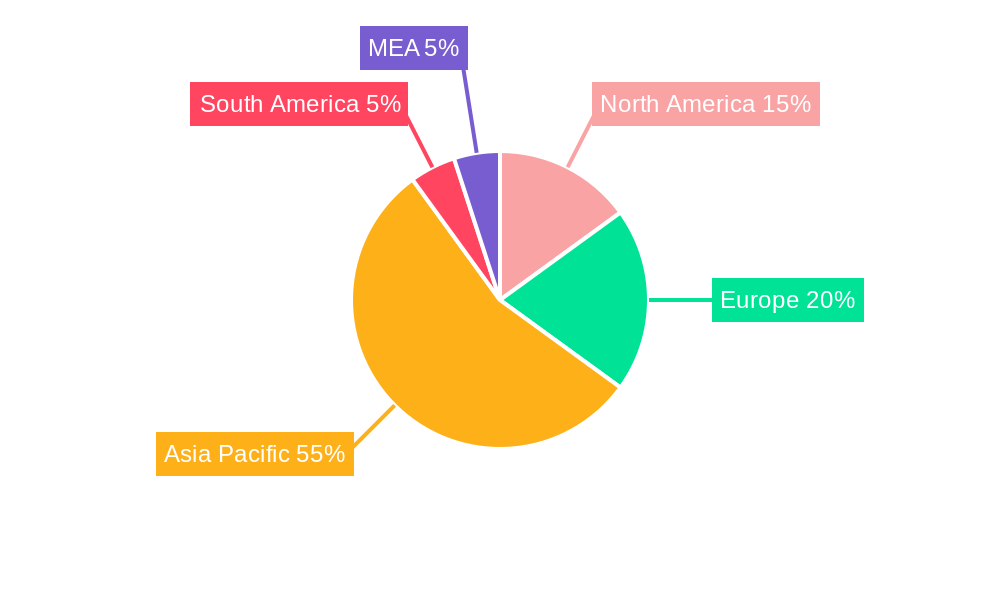
The [Specify Region, e.g., Asia-Pacific] region dominates the Calcined Anthracite market, accounting for approximately xx% of the global market share in 2024. This dominance is largely attributable to the region's robust steel industry and expanding manufacturing sector. Within the region, [Specify Country, e.g., China] stands as the leading country, driven by its substantial steel production capacity and supportive government policies.
The Gas calcination type segment holds the largest market share due to its cost-effectiveness and established infrastructure. However, the Electrical calcination type segment is experiencing rapid growth, driven by increasing demand for higher-quality products and environmental concerns related to gas-based calcination. The Pulverized Coal Injection (Blast furnace) application dominates in terms of volume, reflecting the significant role of calcined anthracite in blast furnace operations.
- Key Drivers in Asia-Pacific:
- Robust steel production capacity.
- Expanding manufacturing sector.
- Supportive government policies (e.g., infrastructure development).
- Dominance Factors:
- High steel production volume.
- Established industrial infrastructure.
- Availability of raw materials.
Calcined Anthracite Market Product Landscape
The product landscape for calcined anthracite is characterized by a strong emphasis on technological advancement and application-specific tailoring. Manufacturers are continuously innovating to achieve higher levels of purity, refine particle size distribution for optimized flow and reactivity, and enhance overall performance across a diverse range of industrial applications. Recent developments highlight the creation of specialized grades meticulously designed to meet the stringent requirements of sectors like aluminum smelting (for electrodes) and advanced water filtration systems. Key selling propositions revolve around demonstrably superior performance characteristics, including improved energy efficiency in end-use processes and a reduced environmental footprint when contrasted with conventional materials. The market is clearly trending towards a higher demand for premium, specialized calcined anthracite products, as end-users increasingly prioritize enhanced operational effectiveness and a commitment to sustainability in their material choices.
Key Drivers, Barriers & Challenges in Calcined Anthracite Market
Key Drivers: The primary drivers include increasing global steel production, growing demand for high-quality calcined anthracite in various applications (e.g., electric arc furnaces), and ongoing technological advancements leading to improved product efficiency. Government initiatives promoting sustainable industrial practices are also fostering market growth.
Key Challenges: Supply chain disruptions, particularly related to raw material sourcing and transportation, pose a significant challenge. Stricter environmental regulations in various regions are leading to increased production costs and compliance challenges. Intense competition among existing players and the emergence of new entrants create pricing pressure and limit profitability.
Emerging Opportunities in Calcined Anthracite Market
Significant growth avenues are emerging within the calcined anthracite market, particularly in currently underserved regions such as developing economies across Africa and Latin America, which represent substantial untapped potential. Furthermore, innovative and niche applications are gaining considerable momentum, including the integration of calcined anthracite into the development of advanced composite materials and highly specialized industrial filtration systems. In parallel, the global shift in consumer and industrial preferences towards eco-friendly and sustainable products is acting as a powerful catalyst, driving the imperative for and adoption of environmentally responsible calcination processes and product life cycles.
Growth Accelerators in the Calcined Anthracite Market Industry
The calcined anthracite industry's growth trajectory is being significantly accelerated by several key factors. Technological breakthroughs in calcination processes are at the forefront, leading to enhanced production efficiencies, reduced energy consumption, and a minimized environmental impact. Strategic partnerships are proving instrumental, fostering crucial collaborations between raw material suppliers, calcined anthracite producers, and the diverse array of end-users, thereby enabling the co-development of highly tailored and effective solutions. Complementing these are proactive market expansion strategies, which encompass geographical diversification into new and promising regions, alongside penetration into novel and emerging application segments, all of which are collectively driving sustained long-term growth for the industry.
Key Players Shaping the Calcined Anthracite Market Market
- SOUTHERN CARBON & CHEMICAL
- RESORBENT s r o
- Ningxia carbon valley International Co Ltd (NORTHWEST INDUSTRY CO LTD)
- Voltcon International PTE Limited
- Henan Star Metallurgy Material Co Ltd
- Black Diamond
- JH CARBON
- Kingstone Group
- Aluminium Rheinfelden GmbH
Notable Milestones in Calcined Anthracite Market Sector
- 2021: [Company Name] launched a new line of high-purity calcined anthracite for electric arc furnaces.
- 2022: A significant merger between two major players resulted in increased market consolidation.
- 2023: [Company Name] introduced a new sustainable calcination process with reduced carbon emissions.
- 2024: [Government/Regulatory body] implemented new environmental standards affecting the production of calcined anthracite.
In-Depth Calcined Anthracite Market Market Outlook
The outlook for the Calcined Anthracite market remains robust and indicative of continued expansion. The synergistic interplay of ongoing technological advancements, strategic collaborative efforts, and aggressive market penetration into new geographical territories and diverse application domains will continue to be the primary architects of the market's evolution. Companies that proactively embrace and champion sustainability initiatives and prioritize continuous innovation are exceptionally well-positioned to secure a significant competitive advantage. Therefore, strategic investment in research and development, coupled with the implementation of highly efficient and resilient supply chain management systems, are identified as critical success factors for navigating and thriving within this dynamic and progressively evolving market landscape.
Calcined Anthracite Market Segmentation
-
1. Calcination Type
- 1.1. Gas
- 1.2. Electrical
-
2. Application
- 2.1. Pulverized Coal Injection (Blast furnace)
- 2.2. Basic Oxygen Steel Making (BOS)
- 2.3. Electric Arc Furnace
- 2.4. Others (Electrodes, Filter Medium, etc.,)
Calcined Anthracite Market Segmentation By Geography
-
1. Asia Pacific
- 1.1. China
- 1.2. India
- 1.3. Japan
- 1.4. South Korea
- 1.5. Rest of Asia Pacific
-
2. North America
- 2.1. United States
- 2.2. Canada
- 2.3. Mexico
-
3. Europe
- 3.1. Germany
- 3.2. United Kingdom
- 3.3. Italy
- 3.4. France
- 3.5. Rest of Europe
-
4. South America
- 4.1. Brazil
- 4.2. Argentina
- 4.3. Rest of South America
-
5. Middle East and Africa
- 5.1. Saudi Arabia
- 5.2. South Africa
- 5.3. Rest of Middle East and Africa
Calcined Anthracite Market Regional Market Share
Geographic Coverage of Calcined Anthracite Market
Calcined Anthracite Market REPORT HIGHLIGHTS
| Aspects | Details |
|---|---|
| Study Period | 2020-2034 |
| Base Year | 2025 |
| Estimated Year | 2026 |
| Forecast Period | 2026-2034 |
| Historical Period | 2020-2025 |
| Growth Rate | CAGR of 1.9% from 2020-2034 |
| Segmentation |
|
Table of Contents
- 1. Introduction
- 1.1. Research Scope
- 1.2. Market Segmentation
- 1.3. Research Objective
- 1.4. Definitions and Assumptions
- 2. Executive Summary
- 2.1. Market Snapshot
- 3. Market Dynamics
- 3.1. Market Drivers
- 3.2. Market Restrains
- 3.3. Market Trends
- 3.4. Market Opportunities
- 4. Market Factor Analysis
- 4.1. Porters Five Forces
- 4.1.1. Bargaining Power of Suppliers
- 4.1.2. Bargaining Power of Buyers
- 4.1.3. Threat of New Entrants
- 4.1.4. Threat of Substitutes
- 4.1.5. Competitive Rivalry
- 4.2. PESTEL analysis
- 4.3. BCG Analysis
- 4.3.1. Stars (High Growth, High Market Share)
- 4.3.2. Cash Cows (Low Growth, High Market Share)
- 4.3.3. Question Mark (High Growth, Low Market Share)
- 4.3.4. Dogs (Low Growth, Low Market Share)
- 4.4. Ansoff Matrix Analysis
- 4.5. Supply Chain Analysis
- 4.6. Regulatory Landscape
- 4.7. Current Market Potential and Opportunity Assessment (TAM–SAM–SOM Framework)
- 4.8. NRP Analyst Note
- 4.1. Porters Five Forces
- 5. Market Analysis, Insights and Forecast 2021-2033
- 5.1. Market Analysis, Insights and Forecast - by Calcination Type
- 5.1.1. Gas
- 5.1.2. Electrical
- 5.2. Market Analysis, Insights and Forecast - by Application
- 5.2.1. Pulverized Coal Injection (Blast furnace)
- 5.2.2. Basic Oxygen Steel Making (BOS)
- 5.2.3. Electric Arc Furnace
- 5.2.4. Others (Electrodes, Filter Medium, etc.,)
- 5.3. Market Analysis, Insights and Forecast - by Region
- 5.3.1. Asia Pacific
- 5.3.2. North America
- 5.3.3. Europe
- 5.3.4. South America
- 5.3.5. Middle East and Africa
- 5.1. Market Analysis, Insights and Forecast - by Calcination Type
- 6. Global Calcined Anthracite Market Analysis, Insights and Forecast, 2021-2033
- 6.1. Market Analysis, Insights and Forecast - by Calcination Type
- 6.1.1. Gas
- 6.1.2. Electrical
- 6.2. Market Analysis, Insights and Forecast - by Application
- 6.2.1. Pulverized Coal Injection (Blast furnace)
- 6.2.2. Basic Oxygen Steel Making (BOS)
- 6.2.3. Electric Arc Furnace
- 6.2.4. Others (Electrodes, Filter Medium, etc.,)
- 6.1. Market Analysis, Insights and Forecast - by Calcination Type
- 7. Asia Pacific Calcined Anthracite Market Analysis, Insights and Forecast, 2020-2032
- 7.1. Market Analysis, Insights and Forecast - by Calcination Type
- 7.1.1. Gas
- 7.1.2. Electrical
- 7.2. Market Analysis, Insights and Forecast - by Application
- 7.2.1. Pulverized Coal Injection (Blast furnace)
- 7.2.2. Basic Oxygen Steel Making (BOS)
- 7.2.3. Electric Arc Furnace
- 7.2.4. Others (Electrodes, Filter Medium, etc.,)
- 7.1. Market Analysis, Insights and Forecast - by Calcination Type
- 8. North America Calcined Anthracite Market Analysis, Insights and Forecast, 2020-2032
- 8.1. Market Analysis, Insights and Forecast - by Calcination Type
- 8.1.1. Gas
- 8.1.2. Electrical
- 8.2. Market Analysis, Insights and Forecast - by Application
- 8.2.1. Pulverized Coal Injection (Blast furnace)
- 8.2.2. Basic Oxygen Steel Making (BOS)
- 8.2.3. Electric Arc Furnace
- 8.2.4. Others (Electrodes, Filter Medium, etc.,)
- 8.1. Market Analysis, Insights and Forecast - by Calcination Type
- 9. Europe Calcined Anthracite Market Analysis, Insights and Forecast, 2020-2032
- 9.1. Market Analysis, Insights and Forecast - by Calcination Type
- 9.1.1. Gas
- 9.1.2. Electrical
- 9.2. Market Analysis, Insights and Forecast - by Application
- 9.2.1. Pulverized Coal Injection (Blast furnace)
- 9.2.2. Basic Oxygen Steel Making (BOS)
- 9.2.3. Electric Arc Furnace
- 9.2.4. Others (Electrodes, Filter Medium, etc.,)
- 9.1. Market Analysis, Insights and Forecast - by Calcination Type
- 10. South America Calcined Anthracite Market Analysis, Insights and Forecast, 2020-2032
- 10.1. Market Analysis, Insights and Forecast - by Calcination Type
- 10.1.1. Gas
- 10.1.2. Electrical
- 10.2. Market Analysis, Insights and Forecast - by Application
- 10.2.1. Pulverized Coal Injection (Blast furnace)
- 10.2.2. Basic Oxygen Steel Making (BOS)
- 10.2.3. Electric Arc Furnace
- 10.2.4. Others (Electrodes, Filter Medium, etc.,)
- 10.1. Market Analysis, Insights and Forecast - by Calcination Type
- 11. Middle East and Africa Calcined Anthracite Market Analysis, Insights and Forecast, 2020-2032
- 11.1. Market Analysis, Insights and Forecast - by Calcination Type
- 11.1.1. Gas
- 11.1.2. Electrical
- 11.2. Market Analysis, Insights and Forecast - by Application
- 11.2.1. Pulverized Coal Injection (Blast furnace)
- 11.2.2. Basic Oxygen Steel Making (BOS)
- 11.2.3. Electric Arc Furnace
- 11.2.4. Others (Electrodes, Filter Medium, etc.,)
- 11.1. Market Analysis, Insights and Forecast - by Calcination Type
- 12. Competitive Analysis
- 12.1. Company Profiles
- 12.1.1 SOUTHERN CARBON & CHEMICAL
- 12.1.1.1. Company Overview
- 12.1.1.2. Products
- 12.1.1.3. Company Financials
- 12.1.1.4. SWOT Analysis
- 12.1.2 RESORBENT s r o
- 12.1.2.1. Company Overview
- 12.1.2.2. Products
- 12.1.2.3. Company Financials
- 12.1.2.4. SWOT Analysis
- 12.1.3 Ningxia carbon valley International Co Ltd (NORTHWEST INDUSTRY CO LTD)
- 12.1.3.1. Company Overview
- 12.1.3.2. Products
- 12.1.3.3. Company Financials
- 12.1.3.4. SWOT Analysis
- 12.1.4 Voltcon International PTE Limited
- 12.1.4.1. Company Overview
- 12.1.4.2. Products
- 12.1.4.3. Company Financials
- 12.1.4.4. SWOT Analysis
- 12.1.5 Henan Star Metallurgy Material Co Ltd
- 12.1.5.1. Company Overview
- 12.1.5.2. Products
- 12.1.5.3. Company Financials
- 12.1.5.4. SWOT Analysis
- 12.1.6 Black Diamond
- 12.1.6.1. Company Overview
- 12.1.6.2. Products
- 12.1.6.3. Company Financials
- 12.1.6.4. SWOT Analysis
- 12.1.7 JH CARBON
- 12.1.7.1. Company Overview
- 12.1.7.2. Products
- 12.1.7.3. Company Financials
- 12.1.7.4. SWOT Analysis
- 12.1.8 Kingstone Group
- 12.1.8.1. Company Overview
- 12.1.8.2. Products
- 12.1.8.3. Company Financials
- 12.1.8.4. SWOT Analysis
- 12.1.9 Aluminium Rheinfelden GmbH
- 12.1.9.1. Company Overview
- 12.1.9.2. Products
- 12.1.9.3. Company Financials
- 12.1.9.4. SWOT Analysis
- 12.1.1 SOUTHERN CARBON & CHEMICAL
- 12.2. Market Entropy
- 12.2.1 Company's Key Areas Served
- 12.2.2 Recent Developments
- 12.3. Company Market Share Analysis 2025
- 12.3.1 Top 5 Companies Market Share Analysis
- 12.3.2 Top 3 Companies Market Share Analysis
- 12.4. List of Potential Customers
- 13. Research Methodology
List of Figures
- Figure 1: Global Calcined Anthracite Market Revenue Breakdown (Billion, %) by Region 2025 & 2033
- Figure 2: Global Calcined Anthracite Market Volume Breakdown (K Tons, %) by Region 2025 & 2033
- Figure 3: Asia Pacific Calcined Anthracite Market Revenue (Billion), by Calcination Type 2025 & 2033
- Figure 4: Asia Pacific Calcined Anthracite Market Volume (K Tons), by Calcination Type 2025 & 2033
- Figure 5: Asia Pacific Calcined Anthracite Market Revenue Share (%), by Calcination Type 2025 & 2033
- Figure 6: Asia Pacific Calcined Anthracite Market Volume Share (%), by Calcination Type 2025 & 2033
- Figure 7: Asia Pacific Calcined Anthracite Market Revenue (Billion), by Application 2025 & 2033
- Figure 8: Asia Pacific Calcined Anthracite Market Volume (K Tons), by Application 2025 & 2033
- Figure 9: Asia Pacific Calcined Anthracite Market Revenue Share (%), by Application 2025 & 2033
- Figure 10: Asia Pacific Calcined Anthracite Market Volume Share (%), by Application 2025 & 2033
- Figure 11: Asia Pacific Calcined Anthracite Market Revenue (Billion), by Country 2025 & 2033
- Figure 12: Asia Pacific Calcined Anthracite Market Volume (K Tons), by Country 2025 & 2033
- Figure 13: Asia Pacific Calcined Anthracite Market Revenue Share (%), by Country 2025 & 2033
- Figure 14: Asia Pacific Calcined Anthracite Market Volume Share (%), by Country 2025 & 2033
- Figure 15: North America Calcined Anthracite Market Revenue (Billion), by Calcination Type 2025 & 2033
- Figure 16: North America Calcined Anthracite Market Volume (K Tons), by Calcination Type 2025 & 2033
- Figure 17: North America Calcined Anthracite Market Revenue Share (%), by Calcination Type 2025 & 2033
- Figure 18: North America Calcined Anthracite Market Volume Share (%), by Calcination Type 2025 & 2033
- Figure 19: North America Calcined Anthracite Market Revenue (Billion), by Application 2025 & 2033
- Figure 20: North America Calcined Anthracite Market Volume (K Tons), by Application 2025 & 2033
- Figure 21: North America Calcined Anthracite Market Revenue Share (%), by Application 2025 & 2033
- Figure 22: North America Calcined Anthracite Market Volume Share (%), by Application 2025 & 2033
- Figure 23: North America Calcined Anthracite Market Revenue (Billion), by Country 2025 & 2033
- Figure 24: North America Calcined Anthracite Market Volume (K Tons), by Country 2025 & 2033
- Figure 25: North America Calcined Anthracite Market Revenue Share (%), by Country 2025 & 2033
- Figure 26: North America Calcined Anthracite Market Volume Share (%), by Country 2025 & 2033
- Figure 27: Europe Calcined Anthracite Market Revenue (Billion), by Calcination Type 2025 & 2033
- Figure 28: Europe Calcined Anthracite Market Volume (K Tons), by Calcination Type 2025 & 2033
- Figure 29: Europe Calcined Anthracite Market Revenue Share (%), by Calcination Type 2025 & 2033
- Figure 30: Europe Calcined Anthracite Market Volume Share (%), by Calcination Type 2025 & 2033
- Figure 31: Europe Calcined Anthracite Market Revenue (Billion), by Application 2025 & 2033
- Figure 32: Europe Calcined Anthracite Market Volume (K Tons), by Application 2025 & 2033
- Figure 33: Europe Calcined Anthracite Market Revenue Share (%), by Application 2025 & 2033
- Figure 34: Europe Calcined Anthracite Market Volume Share (%), by Application 2025 & 2033
- Figure 35: Europe Calcined Anthracite Market Revenue (Billion), by Country 2025 & 2033
- Figure 36: Europe Calcined Anthracite Market Volume (K Tons), by Country 2025 & 2033
- Figure 37: Europe Calcined Anthracite Market Revenue Share (%), by Country 2025 & 2033
- Figure 38: Europe Calcined Anthracite Market Volume Share (%), by Country 2025 & 2033
- Figure 39: South America Calcined Anthracite Market Revenue (Billion), by Calcination Type 2025 & 2033
- Figure 40: South America Calcined Anthracite Market Volume (K Tons), by Calcination Type 2025 & 2033
- Figure 41: South America Calcined Anthracite Market Revenue Share (%), by Calcination Type 2025 & 2033
- Figure 42: South America Calcined Anthracite Market Volume Share (%), by Calcination Type 2025 & 2033
- Figure 43: South America Calcined Anthracite Market Revenue (Billion), by Application 2025 & 2033
- Figure 44: South America Calcined Anthracite Market Volume (K Tons), by Application 2025 & 2033
- Figure 45: South America Calcined Anthracite Market Revenue Share (%), by Application 2025 & 2033
- Figure 46: South America Calcined Anthracite Market Volume Share (%), by Application 2025 & 2033
- Figure 47: South America Calcined Anthracite Market Revenue (Billion), by Country 2025 & 2033
- Figure 48: South America Calcined Anthracite Market Volume (K Tons), by Country 2025 & 2033
- Figure 49: South America Calcined Anthracite Market Revenue Share (%), by Country 2025 & 2033
- Figure 50: South America Calcined Anthracite Market Volume Share (%), by Country 2025 & 2033
- Figure 51: Middle East and Africa Calcined Anthracite Market Revenue (Billion), by Calcination Type 2025 & 2033
- Figure 52: Middle East and Africa Calcined Anthracite Market Volume (K Tons), by Calcination Type 2025 & 2033
- Figure 53: Middle East and Africa Calcined Anthracite Market Revenue Share (%), by Calcination Type 2025 & 2033
- Figure 54: Middle East and Africa Calcined Anthracite Market Volume Share (%), by Calcination Type 2025 & 2033
- Figure 55: Middle East and Africa Calcined Anthracite Market Revenue (Billion), by Application 2025 & 2033
- Figure 56: Middle East and Africa Calcined Anthracite Market Volume (K Tons), by Application 2025 & 2033
- Figure 57: Middle East and Africa Calcined Anthracite Market Revenue Share (%), by Application 2025 & 2033
- Figure 58: Middle East and Africa Calcined Anthracite Market Volume Share (%), by Application 2025 & 2033
- Figure 59: Middle East and Africa Calcined Anthracite Market Revenue (Billion), by Country 2025 & 2033
- Figure 60: Middle East and Africa Calcined Anthracite Market Volume (K Tons), by Country 2025 & 2033
- Figure 61: Middle East and Africa Calcined Anthracite Market Revenue Share (%), by Country 2025 & 2033
- Figure 62: Middle East and Africa Calcined Anthracite Market Volume Share (%), by Country 2025 & 2033
List of Tables
- Table 1: Global Calcined Anthracite Market Revenue Billion Forecast, by Calcination Type 2020 & 2033
- Table 2: Global Calcined Anthracite Market Volume K Tons Forecast, by Calcination Type 2020 & 2033
- Table 3: Global Calcined Anthracite Market Revenue Billion Forecast, by Application 2020 & 2033
- Table 4: Global Calcined Anthracite Market Volume K Tons Forecast, by Application 2020 & 2033
- Table 5: Global Calcined Anthracite Market Revenue Billion Forecast, by Region 2020 & 2033
- Table 6: Global Calcined Anthracite Market Volume K Tons Forecast, by Region 2020 & 2033
- Table 7: Global Calcined Anthracite Market Revenue Billion Forecast, by Calcination Type 2020 & 2033
- Table 8: Global Calcined Anthracite Market Volume K Tons Forecast, by Calcination Type 2020 & 2033
- Table 9: Global Calcined Anthracite Market Revenue Billion Forecast, by Application 2020 & 2033
- Table 10: Global Calcined Anthracite Market Volume K Tons Forecast, by Application 2020 & 2033
- Table 11: Global Calcined Anthracite Market Revenue Billion Forecast, by Country 2020 & 2033
- Table 12: Global Calcined Anthracite Market Volume K Tons Forecast, by Country 2020 & 2033
- Table 13: China Calcined Anthracite Market Revenue (Billion) Forecast, by Application 2020 & 2033
- Table 14: China Calcined Anthracite Market Volume (K Tons) Forecast, by Application 2020 & 2033
- Table 15: India Calcined Anthracite Market Revenue (Billion) Forecast, by Application 2020 & 2033
- Table 16: India Calcined Anthracite Market Volume (K Tons) Forecast, by Application 2020 & 2033
- Table 17: Japan Calcined Anthracite Market Revenue (Billion) Forecast, by Application 2020 & 2033
- Table 18: Japan Calcined Anthracite Market Volume (K Tons) Forecast, by Application 2020 & 2033
- Table 19: South Korea Calcined Anthracite Market Revenue (Billion) Forecast, by Application 2020 & 2033
- Table 20: South Korea Calcined Anthracite Market Volume (K Tons) Forecast, by Application 2020 & 2033
- Table 21: Rest of Asia Pacific Calcined Anthracite Market Revenue (Billion) Forecast, by Application 2020 & 2033
- Table 22: Rest of Asia Pacific Calcined Anthracite Market Volume (K Tons) Forecast, by Application 2020 & 2033
- Table 23: Global Calcined Anthracite Market Revenue Billion Forecast, by Calcination Type 2020 & 2033
- Table 24: Global Calcined Anthracite Market Volume K Tons Forecast, by Calcination Type 2020 & 2033
- Table 25: Global Calcined Anthracite Market Revenue Billion Forecast, by Application 2020 & 2033
- Table 26: Global Calcined Anthracite Market Volume K Tons Forecast, by Application 2020 & 2033
- Table 27: Global Calcined Anthracite Market Revenue Billion Forecast, by Country 2020 & 2033
- Table 28: Global Calcined Anthracite Market Volume K Tons Forecast, by Country 2020 & 2033
- Table 29: United States Calcined Anthracite Market Revenue (Billion) Forecast, by Application 2020 & 2033
- Table 30: United States Calcined Anthracite Market Volume (K Tons) Forecast, by Application 2020 & 2033
- Table 31: Canada Calcined Anthracite Market Revenue (Billion) Forecast, by Application 2020 & 2033
- Table 32: Canada Calcined Anthracite Market Volume (K Tons) Forecast, by Application 2020 & 2033
- Table 33: Mexico Calcined Anthracite Market Revenue (Billion) Forecast, by Application 2020 & 2033
- Table 34: Mexico Calcined Anthracite Market Volume (K Tons) Forecast, by Application 2020 & 2033
- Table 35: Global Calcined Anthracite Market Revenue Billion Forecast, by Calcination Type 2020 & 2033
- Table 36: Global Calcined Anthracite Market Volume K Tons Forecast, by Calcination Type 2020 & 2033
- Table 37: Global Calcined Anthracite Market Revenue Billion Forecast, by Application 2020 & 2033
- Table 38: Global Calcined Anthracite Market Volume K Tons Forecast, by Application 2020 & 2033
- Table 39: Global Calcined Anthracite Market Revenue Billion Forecast, by Country 2020 & 2033
- Table 40: Global Calcined Anthracite Market Volume K Tons Forecast, by Country 2020 & 2033
- Table 41: Germany Calcined Anthracite Market Revenue (Billion) Forecast, by Application 2020 & 2033
- Table 42: Germany Calcined Anthracite Market Volume (K Tons) Forecast, by Application 2020 & 2033
- Table 43: United Kingdom Calcined Anthracite Market Revenue (Billion) Forecast, by Application 2020 & 2033
- Table 44: United Kingdom Calcined Anthracite Market Volume (K Tons) Forecast, by Application 2020 & 2033
- Table 45: Italy Calcined Anthracite Market Revenue (Billion) Forecast, by Application 2020 & 2033
- Table 46: Italy Calcined Anthracite Market Volume (K Tons) Forecast, by Application 2020 & 2033
- Table 47: France Calcined Anthracite Market Revenue (Billion) Forecast, by Application 2020 & 2033
- Table 48: France Calcined Anthracite Market Volume (K Tons) Forecast, by Application 2020 & 2033
- Table 49: Rest of Europe Calcined Anthracite Market Revenue (Billion) Forecast, by Application 2020 & 2033
- Table 50: Rest of Europe Calcined Anthracite Market Volume (K Tons) Forecast, by Application 2020 & 2033
- Table 51: Global Calcined Anthracite Market Revenue Billion Forecast, by Calcination Type 2020 & 2033
- Table 52: Global Calcined Anthracite Market Volume K Tons Forecast, by Calcination Type 2020 & 2033
- Table 53: Global Calcined Anthracite Market Revenue Billion Forecast, by Application 2020 & 2033
- Table 54: Global Calcined Anthracite Market Volume K Tons Forecast, by Application 2020 & 2033
- Table 55: Global Calcined Anthracite Market Revenue Billion Forecast, by Country 2020 & 2033
- Table 56: Global Calcined Anthracite Market Volume K Tons Forecast, by Country 2020 & 2033
- Table 57: Brazil Calcined Anthracite Market Revenue (Billion) Forecast, by Application 2020 & 2033
- Table 58: Brazil Calcined Anthracite Market Volume (K Tons) Forecast, by Application 2020 & 2033
- Table 59: Argentina Calcined Anthracite Market Revenue (Billion) Forecast, by Application 2020 & 2033
- Table 60: Argentina Calcined Anthracite Market Volume (K Tons) Forecast, by Application 2020 & 2033
- Table 61: Rest of South America Calcined Anthracite Market Revenue (Billion) Forecast, by Application 2020 & 2033
- Table 62: Rest of South America Calcined Anthracite Market Volume (K Tons) Forecast, by Application 2020 & 2033
- Table 63: Global Calcined Anthracite Market Revenue Billion Forecast, by Calcination Type 2020 & 2033
- Table 64: Global Calcined Anthracite Market Volume K Tons Forecast, by Calcination Type 2020 & 2033
- Table 65: Global Calcined Anthracite Market Revenue Billion Forecast, by Application 2020 & 2033
- Table 66: Global Calcined Anthracite Market Volume K Tons Forecast, by Application 2020 & 2033
- Table 67: Global Calcined Anthracite Market Revenue Billion Forecast, by Country 2020 & 2033
- Table 68: Global Calcined Anthracite Market Volume K Tons Forecast, by Country 2020 & 2033
- Table 69: Saudi Arabia Calcined Anthracite Market Revenue (Billion) Forecast, by Application 2020 & 2033
- Table 70: Saudi Arabia Calcined Anthracite Market Volume (K Tons) Forecast, by Application 2020 & 2033
- Table 71: South Africa Calcined Anthracite Market Revenue (Billion) Forecast, by Application 2020 & 2033
- Table 72: South Africa Calcined Anthracite Market Volume (K Tons) Forecast, by Application 2020 & 2033
- Table 73: Rest of Middle East and Africa Calcined Anthracite Market Revenue (Billion) Forecast, by Application 2020 & 2033
- Table 74: Rest of Middle East and Africa Calcined Anthracite Market Volume (K Tons) Forecast, by Application 2020 & 2033
Frequently Asked Questions
1. What is the projected Compound Annual Growth Rate (CAGR) of the Calcined Anthracite Market?
The projected CAGR is approximately 1.9%.
2. Which companies are prominent players in the Calcined Anthracite Market?
Key companies in the market include SOUTHERN CARBON & CHEMICAL, RESORBENT s r o, Ningxia carbon valley International Co Ltd (NORTHWEST INDUSTRY CO LTD), Voltcon International PTE Limited, Henan Star Metallurgy Material Co Ltd, Black Diamond, JH CARBON, Kingstone Group, Aluminium Rheinfelden GmbH.
3. What are the main segments of the Calcined Anthracite Market?
The market segments include Calcination Type, Application.
4. Can you provide details about the market size?
The market size is estimated to be USD 3.50 Billion as of 2022.
5. What are some drivers contributing to market growth?
; Growing Demand form Steel Manufacturing Industries; Other Drivers.
6. What are the notable trends driving market growth?
Growing Demand from Steel Manufacturing Industries.
7. Are there any restraints impacting market growth?
; Depletion & Volatile Process of Raw Materials; Unfavorable Conditions Arising Due to the COVID-19 Outbreak.
8. Can you provide examples of recent developments in the market?
N/A
9. What pricing options are available for accessing the report?
Pricing options include single-user, multi-user, and enterprise licenses priced at USD 4750, USD 5250, and USD 8750 respectively.
10. Is the market size provided in terms of value or volume?
The market size is provided in terms of value, measured in Billion and volume, measured in K Tons.
11. Are there any specific market keywords associated with the report?
Yes, the market keyword associated with the report is "Calcined Anthracite Market," which aids in identifying and referencing the specific market segment covered.
12. How do I determine which pricing option suits my needs best?
The pricing options vary based on user requirements and access needs. Individual users may opt for single-user licenses, while businesses requiring broader access may choose multi-user or enterprise licenses for cost-effective access to the report.
13. Are there any additional resources or data provided in the Calcined Anthracite Market report?
While the report offers comprehensive insights, it's advisable to review the specific contents or supplementary materials provided to ascertain if additional resources or data are available.
14. How can I stay updated on further developments or reports in the Calcined Anthracite Market?
To stay informed about further developments, trends, and reports in the Calcined Anthracite Market, consider subscribing to industry newsletters, following relevant companies and organizations, or regularly checking reputable industry news sources and publications.
Methodology
Step 1 - Identification of Relevant Samples Size from Population Database


Step 2 - Approaches for Defining Global Market Size (Value, Volume* & Price*)

Note*: In applicable scenarios
Step 3 - Data Sources
Primary Research
- Web Analytics
- Survey Reports
- Research Institute
- Latest Research Reports
- Opinion Leaders
Secondary Research
- Annual Reports
- White Paper
- Latest Press Release
- Industry Association
- Paid Database
- Investor Presentations

Step 4 - Data Triangulation
Involves using different sources of information in order to increase the validity of a study
These sources are likely to be stakeholders in a program - participants, other researchers, program staff, other community members, and so on.
Then we put all data in single framework & apply various statistical tools to find out the dynamic on the market.
During the analysis stage, feedback from the stakeholder groups would be compared to determine areas of agreement as well as areas of divergence