

Key Insights
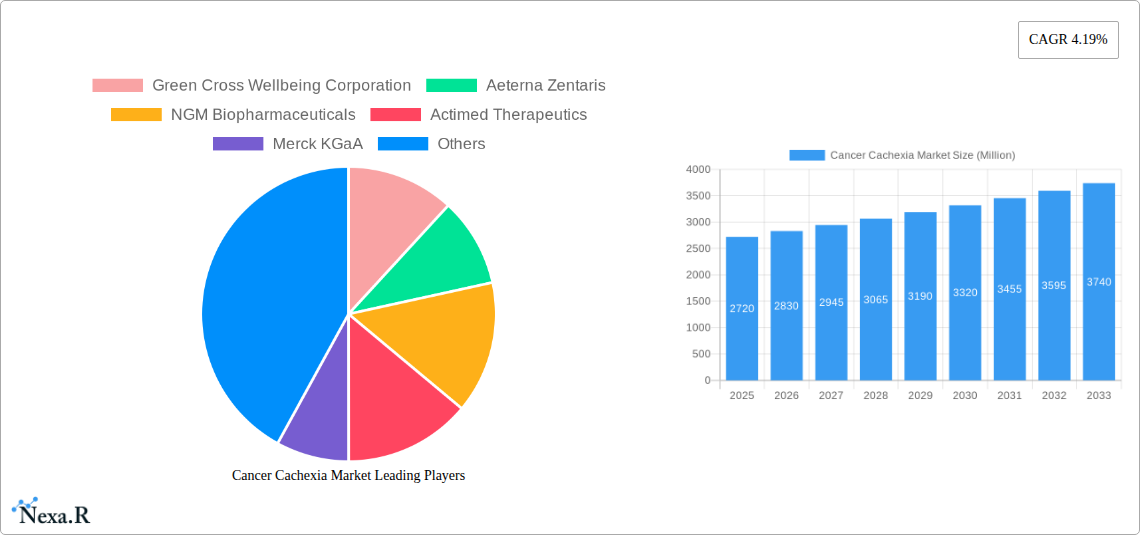
The Cancer Cachexia market, valued at $2.72 billion in 2025, is projected to experience robust growth, driven by increasing cancer prevalence, rising geriatric population, and a growing awareness of cachexia's debilitating effects. The market's Compound Annual Growth Rate (CAGR) of 4.19% from 2025 to 2033 indicates a steady expansion, fueled by advancements in therapeutics and a greater understanding of the underlying mechanisms of cachexia. Key segments within the market include Progestogens, Corticosteroids, and Combination therapies, reflecting the diverse approaches to managing this complex condition. The development of novel appetite stimulants and weight loss stabilizers, targeting the core pathophysiological pathways of cachexia, will likely further stimulate market growth. Competitive intensity is high, with established pharmaceutical companies like Merck KGaA, Pfizer Inc., and Bristol-Myers Squibb Company alongside emerging biotech firms like Aeterna Zentaris and NGM Biopharmaceuticals actively engaged in research and development. Geographical distribution reflects global cancer incidence patterns, with North America and Europe anticipated to maintain significant market shares due to established healthcare infrastructure and higher cancer diagnosis rates. However, the Asia Pacific region is projected to witness substantial growth owing to increasing awareness, improved healthcare access, and a rapidly expanding population.
The ongoing research and development efforts focusing on targeted therapies, personalized medicine approaches, and the exploration of novel drug classes are expected to significantly influence the market landscape in the coming years. Regulatory approvals of new treatments and the increasing focus on improving patient outcomes through supportive care will contribute to market expansion. While challenges remain, such as the complexity of cachexia's pathophysiology and the need for more effective treatments, the overall outlook for the Cancer Cachexia market remains positive, driven by a confluence of scientific advancements and a growing unmet medical need. The market is likely to see a shift towards more targeted and personalized therapies, leading to better treatment outcomes and improved patient quality of life.
This comprehensive report provides a detailed analysis of the Cancer Cachexia Market, encompassing market dynamics, growth trends, regional analysis, product landscape, key players, and future outlook. The study period covers 2019-2033, with 2025 as the base and estimated year. The report leverages extensive data analysis and expert insights to offer a 360-degree view of this vital sector within the larger Oncology market. The total market size is predicted to reach xx Million by 2033.
Cancer Cachexia Market Dynamics & Structure
The Cancer Cachexia Market is characterized by a moderately concentrated landscape with several key players vying for market share. Technological innovation, particularly in targeted therapies and novel drug delivery systems, is a significant driver. Stringent regulatory frameworks governing drug approval impact market entry and expansion. The market witnesses constant evolution with the emergence of competitive product substitutes and ongoing mergers & acquisitions (M&A) activity. End-user demographics, heavily influenced by the aging global population and increasing cancer incidence, significantly contribute to market growth.
- Market Concentration: Moderately concentrated, with top 5 players holding approximately xx% market share in 2025.
- Technological Innovation: Focus on targeted therapies, improved drug delivery, and biomarker identification.
- Regulatory Landscape: Stringent FDA and EMA approvals influence market entry and speed of innovation.
- Competitive Substitutes: Emerging therapies and supportive care measures pose competitive challenges.
- M&A Activity: Moderate level of M&A activity, driven by the need for expansion and technological advancements. An estimated xx M&A deals occurred between 2019-2024.
- End-User Demographics: Aging population and rising cancer incidence are key growth drivers.
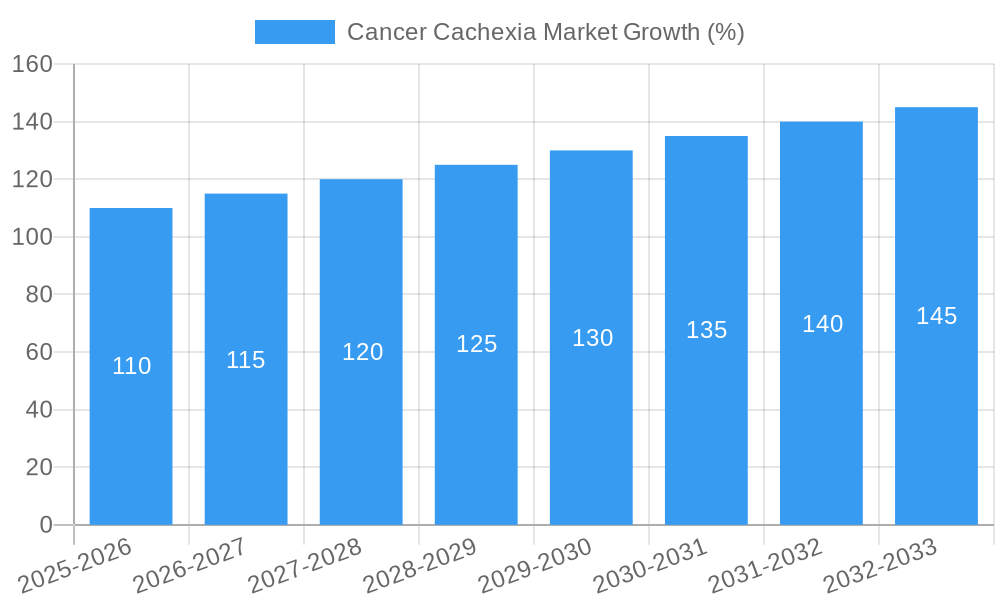
Cancer Cachexia Market Growth Trends & Insights
The Cancer Cachexia Market exhibits robust growth, driven by increasing cancer prevalence, improved diagnostics, and the development of novel therapies. The market size is projected to experience a CAGR of xx% during the forecast period (2025-2033), reaching xx Million by 2033 from xx Million in 2025. Adoption rates of new therapies are influenced by factors such as efficacy, safety profiles, and reimbursement policies. Technological disruptions, such as the development of personalized medicine approaches, are shaping market dynamics. Consumer behavior shifts, including greater awareness and demand for improved quality of life, are further driving market expansion. Increased investment in R&D, particularly in areas like appetite stimulants and weight loss stabilizers, is accelerating the development of more effective treatments.
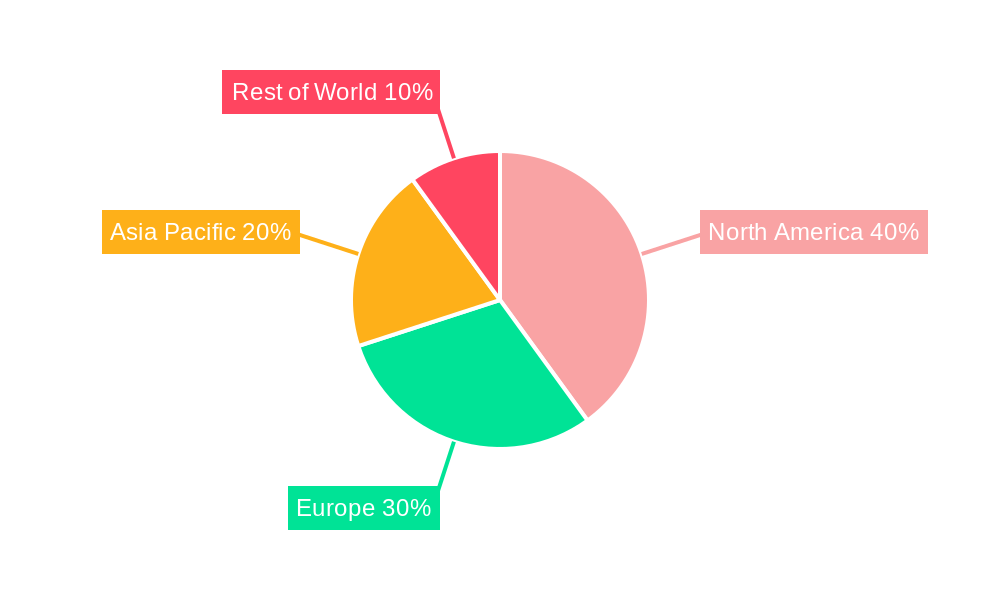
Dominant Regions, Countries, or Segments in Cancer Cachexia Market
North America currently holds the largest market share, driven by factors such as high healthcare expenditure, advanced healthcare infrastructure, and increased cancer prevalence. Europe follows as a significant market, while the Asia-Pacific region exhibits high growth potential due to rising awareness and increasing healthcare spending. Within therapeutic segments, Combination Therapy shows the highest growth, followed by Other Therapeutics and Corticosteroids. Appetite Stimulators lead in the mechanism of action segment due to their established role in managing cachexia symptoms.
- Key Drivers:
- North America: High healthcare spending, advanced infrastructure, strong R&D investments.
- Europe: Established healthcare systems, growing awareness of cachexia, increasing investment in targeted therapies.
- Asia-Pacific: Rising disposable incomes, growing awareness, increasing healthcare expenditure.
- Dominant Segments:
- Therapeutics: Combination Therapy, Other Therapeutics.
- Mechanism of Action: Appetite Stimulators, Weight Loss Stabilizers.
Cancer Cachexia Market Product Landscape
The Cancer Cachexia market encompasses a range of therapeutic products including progestogens, corticosteroids, appetite stimulants, and other supportive care medications. Recent innovations focus on targeted drug delivery systems for enhanced efficacy and reduced side effects. These products are characterized by their unique selling propositions, such as improved tolerability, better efficacy in specific patient populations, and enhanced patient compliance. Technological advancements are continually improving the treatment outcomes and offering personalized medicine solutions.
Key Drivers, Barriers & Challenges in Cancer Cachexia Market
Key Drivers: Increasing cancer incidence globally, rising awareness among patients and healthcare professionals, advances in targeted therapy development, and increased investment in R&D. The growing prevalence of comorbidities associated with cancer is also a key driver.
Challenges & Barriers: High drug development costs, stringent regulatory pathways, and the complex pathophysiology of cancer cachexia pose significant challenges. Limited market access in developing countries, lack of awareness in some regions, and side effects associated with certain therapies also present barriers to market growth. The development of effective biomarkers to identify patients who will respond to specific treatments is a significant hurdle.
Emerging Opportunities in Cancer Cachexia Market
Emerging opportunities exist in developing novel therapeutic agents targeting specific molecular pathways involved in cachexia. Untapped markets in emerging economies present significant growth potential. The development of personalized medicine approaches tailored to specific cancer types and patient characteristics offers promising opportunities. Innovative combination therapies and improved drug delivery systems represent significant avenues for market expansion.
Growth Accelerators in the Cancer Cachexia Market Industry
Technological breakthroughs in targeted therapies, combined with a deeper understanding of the disease's pathophysiology, are key growth accelerators. Strategic partnerships between pharmaceutical companies and research institutions accelerate innovation and development. Expansion into emerging markets through increased awareness campaigns and collaborations with local healthcare providers is crucial for long-term growth.
Key Players Shaping the Cancer Cachexia Market Market
- Green Cross Wellbeing Corporation
- Aeterna Zentaris
- NGM Biopharmaceuticals
- Actimed Therapeutics
- Merck KGaA
- Fresenius Kabi
- Aavogen Inc
- TCI Peptide Therapeutics
- Cannabics Pharmaceuticals Inc
- Aveo Oncology
- Artelo Biosciences Inc
- Aphios Corporation
- Tetra Bio-Pharma
- Helsinn Group
- Bristol-Myers Squibb Company
- Pfizer Inc
Notable Milestones in Cancer Cachexia Market Sector
- June 2022: Rutgers Cancer Institute of New Jersey received a USD 25 million Cancer Grand Challenges grant to research cancer cachexia.
- August 2022: ARTHEx biotech launched ENTRY™, a platform advancing its pipeline of drugs for myotonic dystrophy, cancer cachexia, and osteoarthritis.
In-Depth Cancer Cachexia Market Market Outlook
The Cancer Cachexia Market is poised for significant growth, driven by ongoing research and development efforts focused on novel therapies and improved supportive care. Strategic acquisitions and partnerships are expected to further consolidate the market. The focus on personalized medicine and improved diagnostic tools will enhance the effectiveness of treatment and broaden market access. The development of more effective and tolerable therapies will ultimately improve patient outcomes and drive market expansion.
Cancer Cachexia Market Segmentation
-
1. Therapeutics
- 1.1. Progestogens
- 1.2. Corticosteroids
- 1.3. Combination Therapy
- 1.4. Other Therapeutics
-
2. Mechanism of Action
- 2.1. Appetite Stimulators
- 2.2. Weight Loss Stabilizers
Cancer Cachexia Market Segmentation By Geography
-
1. North America
- 1.1. United States
- 1.2. Canada
- 1.3. Mexico
-
2. Europe
- 2.1. Germany
- 2.2. United Kingdom
- 2.3. France
- 2.4. Italy
- 2.5. Spain
- 2.6. Rest of Europe
-
3. Asia Pacific
- 3.1. China
- 3.2. Japan
- 3.3. India
- 3.4. Australia
- 3.5. South Korea
- 3.6. Rest of Asia Pacific
-
4. Middle East and Africa
- 4.1. GCC
- 4.2. South Africa
- 4.3. Rest of Middle East and Africa
-
5. South America
- 5.1. Brazil
- 5.2. Argentina
- 5.3. Rest of South America
Cancer Cachexia Market REPORT HIGHLIGHTS
| Aspects | Details |
|---|---|
| Study Period | 2019-2033 |
| Base Year | 2024 |
| Estimated Year | 2025 |
| Forecast Period | 2025-2033 |
| Historical Period | 2019-2024 |
| Growth Rate | CAGR of 4.19% from 2019-2033 |
| Segmentation |
|
Table of Contents
- 1. Introduction
- 1.1. Research Scope
- 1.2. Market Segmentation
- 1.3. Research Methodology
- 1.4. Definitions and Assumptions
- 2. Executive Summary
- 2.1. Introduction
- 3. Market Dynamics
- 3.1. Introduction
- 3.2. Market Drivers
- 3.2.1. Increasing Prevalence of Cancer Cachexia; Strong R&D and Product Pipeline
- 3.3. Market Restrains
- 3.3.1. Stringent Regulatory Requirements
- 3.4. Market Trends
- 3.4.1. Appetite Stimulators is Expected to Grow Significantly in the Cancer Cachexia Market
- 4. Market Factor Analysis
- 4.1. Porters Five Forces
- 4.2. Supply/Value Chain
- 4.3. PESTEL analysis
- 4.4. Market Entropy
- 4.5. Patent/Trademark Analysis
- 5. Global Cancer Cachexia Market Analysis, Insights and Forecast, 2019-2031
- 5.1. Market Analysis, Insights and Forecast - by Therapeutics
- 5.1.1. Progestogens
- 5.1.2. Corticosteroids
- 5.1.3. Combination Therapy
- 5.1.4. Other Therapeutics
- 5.2. Market Analysis, Insights and Forecast - by Mechanism of Action
- 5.2.1. Appetite Stimulators
- 5.2.2. Weight Loss Stabilizers
- 5.3. Market Analysis, Insights and Forecast - by Region
- 5.3.1. North America
- 5.3.2. Europe
- 5.3.3. Asia Pacific
- 5.3.4. Middle East and Africa
- 5.3.5. South America
- 5.1. Market Analysis, Insights and Forecast - by Therapeutics
- 6. North America Cancer Cachexia Market Analysis, Insights and Forecast, 2019-2031
- 6.1. Market Analysis, Insights and Forecast - by Therapeutics
- 6.1.1. Progestogens
- 6.1.2. Corticosteroids
- 6.1.3. Combination Therapy
- 6.1.4. Other Therapeutics
- 6.2. Market Analysis, Insights and Forecast - by Mechanism of Action
- 6.2.1. Appetite Stimulators
- 6.2.2. Weight Loss Stabilizers
- 6.1. Market Analysis, Insights and Forecast - by Therapeutics
- 7. Europe Cancer Cachexia Market Analysis, Insights and Forecast, 2019-2031
- 7.1. Market Analysis, Insights and Forecast - by Therapeutics
- 7.1.1. Progestogens
- 7.1.2. Corticosteroids
- 7.1.3. Combination Therapy
- 7.1.4. Other Therapeutics
- 7.2. Market Analysis, Insights and Forecast - by Mechanism of Action
- 7.2.1. Appetite Stimulators
- 7.2.2. Weight Loss Stabilizers
- 7.1. Market Analysis, Insights and Forecast - by Therapeutics
- 8. Asia Pacific Cancer Cachexia Market Analysis, Insights and Forecast, 2019-2031
- 8.1. Market Analysis, Insights and Forecast - by Therapeutics
- 8.1.1. Progestogens
- 8.1.2. Corticosteroids
- 8.1.3. Combination Therapy
- 8.1.4. Other Therapeutics
- 8.2. Market Analysis, Insights and Forecast - by Mechanism of Action
- 8.2.1. Appetite Stimulators
- 8.2.2. Weight Loss Stabilizers
- 8.1. Market Analysis, Insights and Forecast - by Therapeutics
- 9. Middle East and Africa Cancer Cachexia Market Analysis, Insights and Forecast, 2019-2031
- 9.1. Market Analysis, Insights and Forecast - by Therapeutics
- 9.1.1. Progestogens
- 9.1.2. Corticosteroids
- 9.1.3. Combination Therapy
- 9.1.4. Other Therapeutics
- 9.2. Market Analysis, Insights and Forecast - by Mechanism of Action
- 9.2.1. Appetite Stimulators
- 9.2.2. Weight Loss Stabilizers
- 9.1. Market Analysis, Insights and Forecast - by Therapeutics
- 10. South America Cancer Cachexia Market Analysis, Insights and Forecast, 2019-2031
- 10.1. Market Analysis, Insights and Forecast - by Therapeutics
- 10.1.1. Progestogens
- 10.1.2. Corticosteroids
- 10.1.3. Combination Therapy
- 10.1.4. Other Therapeutics
- 10.2. Market Analysis, Insights and Forecast - by Mechanism of Action
- 10.2.1. Appetite Stimulators
- 10.2.2. Weight Loss Stabilizers
- 10.1. Market Analysis, Insights and Forecast - by Therapeutics
- 11. North America Cancer Cachexia Market Analysis, Insights and Forecast, 2019-2031
- 11.1. Market Analysis, Insights and Forecast - By Country/Sub-region
- 11.1.1 United States
- 11.1.2 Canada
- 11.1.3 Mexico
- 12. Europe Cancer Cachexia Market Analysis, Insights and Forecast, 2019-2031
- 12.1. Market Analysis, Insights and Forecast - By Country/Sub-region
- 12.1.1 Germany
- 12.1.2 United Kingdom
- 12.1.3 France
- 12.1.4 Italy
- 12.1.5 Spain
- 12.1.6 Rest of Europe
- 13. Asia Pacific Cancer Cachexia Market Analysis, Insights and Forecast, 2019-2031
- 13.1. Market Analysis, Insights and Forecast - By Country/Sub-region
- 13.1.1 China
- 13.1.2 Japan
- 13.1.3 India
- 13.1.4 Australia
- 13.1.5 South Korea
- 13.1.6 Rest of Asia Pacific
- 14. Middle East and Africa Cancer Cachexia Market Analysis, Insights and Forecast, 2019-2031
- 14.1. Market Analysis, Insights and Forecast - By Country/Sub-region
- 14.1.1 GCC
- 14.1.2 South Africa
- 14.1.3 Rest of Middle East and Africa
- 15. South America Cancer Cachexia Market Analysis, Insights and Forecast, 2019-2031
- 15.1. Market Analysis, Insights and Forecast - By Country/Sub-region
- 15.1.1 Brazil
- 15.1.2 Argentina
- 15.1.3 Rest of South America
- 16. Competitive Analysis
- 16.1. Global Market Share Analysis 2024
- 16.2. Company Profiles
- 16.2.1 Green Cross Wellbeing Corporation
- 16.2.1.1. Overview
- 16.2.1.2. Products
- 16.2.1.3. SWOT Analysis
- 16.2.1.4. Recent Developments
- 16.2.1.5. Financials (Based on Availability)
- 16.2.2 Aeterna Zentaris
- 16.2.2.1. Overview
- 16.2.2.2. Products
- 16.2.2.3. SWOT Analysis
- 16.2.2.4. Recent Developments
- 16.2.2.5. Financials (Based on Availability)
- 16.2.3 NGM Biopharmaceuticals
- 16.2.3.1. Overview
- 16.2.3.2. Products
- 16.2.3.3. SWOT Analysis
- 16.2.3.4. Recent Developments
- 16.2.3.5. Financials (Based on Availability)
- 16.2.4 Actimed Therapeutics
- 16.2.4.1. Overview
- 16.2.4.2. Products
- 16.2.4.3. SWOT Analysis
- 16.2.4.4. Recent Developments
- 16.2.4.5. Financials (Based on Availability)
- 16.2.5 Merck KGaA
- 16.2.5.1. Overview
- 16.2.5.2. Products
- 16.2.5.3. SWOT Analysis
- 16.2.5.4. Recent Developments
- 16.2.5.5. Financials (Based on Availability)
- 16.2.6 Fresenius Kabi
- 16.2.6.1. Overview
- 16.2.6.2. Products
- 16.2.6.3. SWOT Analysis
- 16.2.6.4. Recent Developments
- 16.2.6.5. Financials (Based on Availability)
- 16.2.7 Aavogen Inc
- 16.2.7.1. Overview
- 16.2.7.2. Products
- 16.2.7.3. SWOT Analysis
- 16.2.7.4. Recent Developments
- 16.2.7.5. Financials (Based on Availability)
- 16.2.8 TCI Peptide Therapeutics
- 16.2.8.1. Overview
- 16.2.8.2. Products
- 16.2.8.3. SWOT Analysis
- 16.2.8.4. Recent Developments
- 16.2.8.5. Financials (Based on Availability)
- 16.2.9 Cannabics Pharmaceuticals Inc
- 16.2.9.1. Overview
- 16.2.9.2. Products
- 16.2.9.3. SWOT Analysis
- 16.2.9.4. Recent Developments
- 16.2.9.5. Financials (Based on Availability)
- 16.2.10 Aveo Oncology
- 16.2.10.1. Overview
- 16.2.10.2. Products
- 16.2.10.3. SWOT Analysis
- 16.2.10.4. Recent Developments
- 16.2.10.5. Financials (Based on Availability)
- 16.2.11 Artelo Biosciences Inc
- 16.2.11.1. Overview
- 16.2.11.2. Products
- 16.2.11.3. SWOT Analysis
- 16.2.11.4. Recent Developments
- 16.2.11.5. Financials (Based on Availability)
- 16.2.12 Aphios Corporation
- 16.2.12.1. Overview
- 16.2.12.2. Products
- 16.2.12.3. SWOT Analysis
- 16.2.12.4. Recent Developments
- 16.2.12.5. Financials (Based on Availability)
- 16.2.13 Tetra Bio-Pharma
- 16.2.13.1. Overview
- 16.2.13.2. Products
- 16.2.13.3. SWOT Analysis
- 16.2.13.4. Recent Developments
- 16.2.13.5. Financials (Based on Availability)
- 16.2.14 Helsinn Group
- 16.2.14.1. Overview
- 16.2.14.2. Products
- 16.2.14.3. SWOT Analysis
- 16.2.14.4. Recent Developments
- 16.2.14.5. Financials (Based on Availability)
- 16.2.15 Bristol-Myers Squibb Company
- 16.2.15.1. Overview
- 16.2.15.2. Products
- 16.2.15.3. SWOT Analysis
- 16.2.15.4. Recent Developments
- 16.2.15.5. Financials (Based on Availability)
- 16.2.16 Pfizer Inc
- 16.2.16.1. Overview
- 16.2.16.2. Products
- 16.2.16.3. SWOT Analysis
- 16.2.16.4. Recent Developments
- 16.2.16.5. Financials (Based on Availability)
- 16.2.1 Green Cross Wellbeing Corporation
List of Figures
- Figure 1: Global Cancer Cachexia Market Revenue Breakdown (Million, %) by Region 2024 & 2032
- Figure 2: Global Cancer Cachexia Market Volume Breakdown (K Unit, %) by Region 2024 & 2032
- Figure 3: North America Cancer Cachexia Market Revenue (Million), by Country 2024 & 2032
- Figure 4: North America Cancer Cachexia Market Volume (K Unit), by Country 2024 & 2032
- Figure 5: North America Cancer Cachexia Market Revenue Share (%), by Country 2024 & 2032
- Figure 6: North America Cancer Cachexia Market Volume Share (%), by Country 2024 & 2032
- Figure 7: Europe Cancer Cachexia Market Revenue (Million), by Country 2024 & 2032
- Figure 8: Europe Cancer Cachexia Market Volume (K Unit), by Country 2024 & 2032
- Figure 9: Europe Cancer Cachexia Market Revenue Share (%), by Country 2024 & 2032
- Figure 10: Europe Cancer Cachexia Market Volume Share (%), by Country 2024 & 2032
- Figure 11: Asia Pacific Cancer Cachexia Market Revenue (Million), by Country 2024 & 2032
- Figure 12: Asia Pacific Cancer Cachexia Market Volume (K Unit), by Country 2024 & 2032
- Figure 13: Asia Pacific Cancer Cachexia Market Revenue Share (%), by Country 2024 & 2032
- Figure 14: Asia Pacific Cancer Cachexia Market Volume Share (%), by Country 2024 & 2032
- Figure 15: Middle East and Africa Cancer Cachexia Market Revenue (Million), by Country 2024 & 2032
- Figure 16: Middle East and Africa Cancer Cachexia Market Volume (K Unit), by Country 2024 & 2032
- Figure 17: Middle East and Africa Cancer Cachexia Market Revenue Share (%), by Country 2024 & 2032
- Figure 18: Middle East and Africa Cancer Cachexia Market Volume Share (%), by Country 2024 & 2032
- Figure 19: South America Cancer Cachexia Market Revenue (Million), by Country 2024 & 2032
- Figure 20: South America Cancer Cachexia Market Volume (K Unit), by Country 2024 & 2032
- Figure 21: South America Cancer Cachexia Market Revenue Share (%), by Country 2024 & 2032
- Figure 22: South America Cancer Cachexia Market Volume Share (%), by Country 2024 & 2032
- Figure 23: North America Cancer Cachexia Market Revenue (Million), by Therapeutics 2024 & 2032
- Figure 24: North America Cancer Cachexia Market Volume (K Unit), by Therapeutics 2024 & 2032
- Figure 25: North America Cancer Cachexia Market Revenue Share (%), by Therapeutics 2024 & 2032
- Figure 26: North America Cancer Cachexia Market Volume Share (%), by Therapeutics 2024 & 2032
- Figure 27: North America Cancer Cachexia Market Revenue (Million), by Mechanism of Action 2024 & 2032
- Figure 28: North America Cancer Cachexia Market Volume (K Unit), by Mechanism of Action 2024 & 2032
- Figure 29: North America Cancer Cachexia Market Revenue Share (%), by Mechanism of Action 2024 & 2032
- Figure 30: North America Cancer Cachexia Market Volume Share (%), by Mechanism of Action 2024 & 2032
- Figure 31: North America Cancer Cachexia Market Revenue (Million), by Country 2024 & 2032
- Figure 32: North America Cancer Cachexia Market Volume (K Unit), by Country 2024 & 2032
- Figure 33: North America Cancer Cachexia Market Revenue Share (%), by Country 2024 & 2032
- Figure 34: North America Cancer Cachexia Market Volume Share (%), by Country 2024 & 2032
- Figure 35: Europe Cancer Cachexia Market Revenue (Million), by Therapeutics 2024 & 2032
- Figure 36: Europe Cancer Cachexia Market Volume (K Unit), by Therapeutics 2024 & 2032
- Figure 37: Europe Cancer Cachexia Market Revenue Share (%), by Therapeutics 2024 & 2032
- Figure 38: Europe Cancer Cachexia Market Volume Share (%), by Therapeutics 2024 & 2032
- Figure 39: Europe Cancer Cachexia Market Revenue (Million), by Mechanism of Action 2024 & 2032
- Figure 40: Europe Cancer Cachexia Market Volume (K Unit), by Mechanism of Action 2024 & 2032
- Figure 41: Europe Cancer Cachexia Market Revenue Share (%), by Mechanism of Action 2024 & 2032
- Figure 42: Europe Cancer Cachexia Market Volume Share (%), by Mechanism of Action 2024 & 2032
- Figure 43: Europe Cancer Cachexia Market Revenue (Million), by Country 2024 & 2032
- Figure 44: Europe Cancer Cachexia Market Volume (K Unit), by Country 2024 & 2032
- Figure 45: Europe Cancer Cachexia Market Revenue Share (%), by Country 2024 & 2032
- Figure 46: Europe Cancer Cachexia Market Volume Share (%), by Country 2024 & 2032
- Figure 47: Asia Pacific Cancer Cachexia Market Revenue (Million), by Therapeutics 2024 & 2032
- Figure 48: Asia Pacific Cancer Cachexia Market Volume (K Unit), by Therapeutics 2024 & 2032
- Figure 49: Asia Pacific Cancer Cachexia Market Revenue Share (%), by Therapeutics 2024 & 2032
- Figure 50: Asia Pacific Cancer Cachexia Market Volume Share (%), by Therapeutics 2024 & 2032
- Figure 51: Asia Pacific Cancer Cachexia Market Revenue (Million), by Mechanism of Action 2024 & 2032
- Figure 52: Asia Pacific Cancer Cachexia Market Volume (K Unit), by Mechanism of Action 2024 & 2032
- Figure 53: Asia Pacific Cancer Cachexia Market Revenue Share (%), by Mechanism of Action 2024 & 2032
- Figure 54: Asia Pacific Cancer Cachexia Market Volume Share (%), by Mechanism of Action 2024 & 2032
- Figure 55: Asia Pacific Cancer Cachexia Market Revenue (Million), by Country 2024 & 2032
- Figure 56: Asia Pacific Cancer Cachexia Market Volume (K Unit), by Country 2024 & 2032
- Figure 57: Asia Pacific Cancer Cachexia Market Revenue Share (%), by Country 2024 & 2032
- Figure 58: Asia Pacific Cancer Cachexia Market Volume Share (%), by Country 2024 & 2032
- Figure 59: Middle East and Africa Cancer Cachexia Market Revenue (Million), by Therapeutics 2024 & 2032
- Figure 60: Middle East and Africa Cancer Cachexia Market Volume (K Unit), by Therapeutics 2024 & 2032
- Figure 61: Middle East and Africa Cancer Cachexia Market Revenue Share (%), by Therapeutics 2024 & 2032
- Figure 62: Middle East and Africa Cancer Cachexia Market Volume Share (%), by Therapeutics 2024 & 2032
- Figure 63: Middle East and Africa Cancer Cachexia Market Revenue (Million), by Mechanism of Action 2024 & 2032
- Figure 64: Middle East and Africa Cancer Cachexia Market Volume (K Unit), by Mechanism of Action 2024 & 2032
- Figure 65: Middle East and Africa Cancer Cachexia Market Revenue Share (%), by Mechanism of Action 2024 & 2032
- Figure 66: Middle East and Africa Cancer Cachexia Market Volume Share (%), by Mechanism of Action 2024 & 2032
- Figure 67: Middle East and Africa Cancer Cachexia Market Revenue (Million), by Country 2024 & 2032
- Figure 68: Middle East and Africa Cancer Cachexia Market Volume (K Unit), by Country 2024 & 2032
- Figure 69: Middle East and Africa Cancer Cachexia Market Revenue Share (%), by Country 2024 & 2032
- Figure 70: Middle East and Africa Cancer Cachexia Market Volume Share (%), by Country 2024 & 2032
- Figure 71: South America Cancer Cachexia Market Revenue (Million), by Therapeutics 2024 & 2032
- Figure 72: South America Cancer Cachexia Market Volume (K Unit), by Therapeutics 2024 & 2032
- Figure 73: South America Cancer Cachexia Market Revenue Share (%), by Therapeutics 2024 & 2032
- Figure 74: South America Cancer Cachexia Market Volume Share (%), by Therapeutics 2024 & 2032
- Figure 75: South America Cancer Cachexia Market Revenue (Million), by Mechanism of Action 2024 & 2032
- Figure 76: South America Cancer Cachexia Market Volume (K Unit), by Mechanism of Action 2024 & 2032
- Figure 77: South America Cancer Cachexia Market Revenue Share (%), by Mechanism of Action 2024 & 2032
- Figure 78: South America Cancer Cachexia Market Volume Share (%), by Mechanism of Action 2024 & 2032
- Figure 79: South America Cancer Cachexia Market Revenue (Million), by Country 2024 & 2032
- Figure 80: South America Cancer Cachexia Market Volume (K Unit), by Country 2024 & 2032
- Figure 81: South America Cancer Cachexia Market Revenue Share (%), by Country 2024 & 2032
- Figure 82: South America Cancer Cachexia Market Volume Share (%), by Country 2024 & 2032
List of Tables
- Table 1: Global Cancer Cachexia Market Revenue Million Forecast, by Region 2019 & 2032
- Table 2: Global Cancer Cachexia Market Volume K Unit Forecast, by Region 2019 & 2032
- Table 3: Global Cancer Cachexia Market Revenue Million Forecast, by Therapeutics 2019 & 2032
- Table 4: Global Cancer Cachexia Market Volume K Unit Forecast, by Therapeutics 2019 & 2032
- Table 5: Global Cancer Cachexia Market Revenue Million Forecast, by Mechanism of Action 2019 & 2032
- Table 6: Global Cancer Cachexia Market Volume K Unit Forecast, by Mechanism of Action 2019 & 2032
- Table 7: Global Cancer Cachexia Market Revenue Million Forecast, by Region 2019 & 2032
- Table 8: Global Cancer Cachexia Market Volume K Unit Forecast, by Region 2019 & 2032
- Table 9: Global Cancer Cachexia Market Revenue Million Forecast, by Country 2019 & 2032
- Table 10: Global Cancer Cachexia Market Volume K Unit Forecast, by Country 2019 & 2032
- Table 11: United States Cancer Cachexia Market Revenue (Million) Forecast, by Application 2019 & 2032
- Table 12: United States Cancer Cachexia Market Volume (K Unit) Forecast, by Application 2019 & 2032
- Table 13: Canada Cancer Cachexia Market Revenue (Million) Forecast, by Application 2019 & 2032
- Table 14: Canada Cancer Cachexia Market Volume (K Unit) Forecast, by Application 2019 & 2032
- Table 15: Mexico Cancer Cachexia Market Revenue (Million) Forecast, by Application 2019 & 2032
- Table 16: Mexico Cancer Cachexia Market Volume (K Unit) Forecast, by Application 2019 & 2032
- Table 17: Global Cancer Cachexia Market Revenue Million Forecast, by Country 2019 & 2032
- Table 18: Global Cancer Cachexia Market Volume K Unit Forecast, by Country 2019 & 2032
- Table 19: Germany Cancer Cachexia Market Revenue (Million) Forecast, by Application 2019 & 2032
- Table 20: Germany Cancer Cachexia Market Volume (K Unit) Forecast, by Application 2019 & 2032
- Table 21: United Kingdom Cancer Cachexia Market Revenue (Million) Forecast, by Application 2019 & 2032
- Table 22: United Kingdom Cancer Cachexia Market Volume (K Unit) Forecast, by Application 2019 & 2032
- Table 23: France Cancer Cachexia Market Revenue (Million) Forecast, by Application 2019 & 2032
- Table 24: France Cancer Cachexia Market Volume (K Unit) Forecast, by Application 2019 & 2032
- Table 25: Italy Cancer Cachexia Market Revenue (Million) Forecast, by Application 2019 & 2032
- Table 26: Italy Cancer Cachexia Market Volume (K Unit) Forecast, by Application 2019 & 2032
- Table 27: Spain Cancer Cachexia Market Revenue (Million) Forecast, by Application 2019 & 2032
- Table 28: Spain Cancer Cachexia Market Volume (K Unit) Forecast, by Application 2019 & 2032
- Table 29: Rest of Europe Cancer Cachexia Market Revenue (Million) Forecast, by Application 2019 & 2032
- Table 30: Rest of Europe Cancer Cachexia Market Volume (K Unit) Forecast, by Application 2019 & 2032
- Table 31: Global Cancer Cachexia Market Revenue Million Forecast, by Country 2019 & 2032
- Table 32: Global Cancer Cachexia Market Volume K Unit Forecast, by Country 2019 & 2032
- Table 33: China Cancer Cachexia Market Revenue (Million) Forecast, by Application 2019 & 2032
- Table 34: China Cancer Cachexia Market Volume (K Unit) Forecast, by Application 2019 & 2032
- Table 35: Japan Cancer Cachexia Market Revenue (Million) Forecast, by Application 2019 & 2032
- Table 36: Japan Cancer Cachexia Market Volume (K Unit) Forecast, by Application 2019 & 2032
- Table 37: India Cancer Cachexia Market Revenue (Million) Forecast, by Application 2019 & 2032
- Table 38: India Cancer Cachexia Market Volume (K Unit) Forecast, by Application 2019 & 2032
- Table 39: Australia Cancer Cachexia Market Revenue (Million) Forecast, by Application 2019 & 2032
- Table 40: Australia Cancer Cachexia Market Volume (K Unit) Forecast, by Application 2019 & 2032
- Table 41: South Korea Cancer Cachexia Market Revenue (Million) Forecast, by Application 2019 & 2032
- Table 42: South Korea Cancer Cachexia Market Volume (K Unit) Forecast, by Application 2019 & 2032
- Table 43: Rest of Asia Pacific Cancer Cachexia Market Revenue (Million) Forecast, by Application 2019 & 2032
- Table 44: Rest of Asia Pacific Cancer Cachexia Market Volume (K Unit) Forecast, by Application 2019 & 2032
- Table 45: Global Cancer Cachexia Market Revenue Million Forecast, by Country 2019 & 2032
- Table 46: Global Cancer Cachexia Market Volume K Unit Forecast, by Country 2019 & 2032
- Table 47: GCC Cancer Cachexia Market Revenue (Million) Forecast, by Application 2019 & 2032
- Table 48: GCC Cancer Cachexia Market Volume (K Unit) Forecast, by Application 2019 & 2032
- Table 49: South Africa Cancer Cachexia Market Revenue (Million) Forecast, by Application 2019 & 2032
- Table 50: South Africa Cancer Cachexia Market Volume (K Unit) Forecast, by Application 2019 & 2032
- Table 51: Rest of Middle East and Africa Cancer Cachexia Market Revenue (Million) Forecast, by Application 2019 & 2032
- Table 52: Rest of Middle East and Africa Cancer Cachexia Market Volume (K Unit) Forecast, by Application 2019 & 2032
- Table 53: Global Cancer Cachexia Market Revenue Million Forecast, by Country 2019 & 2032
- Table 54: Global Cancer Cachexia Market Volume K Unit Forecast, by Country 2019 & 2032
- Table 55: Brazil Cancer Cachexia Market Revenue (Million) Forecast, by Application 2019 & 2032
- Table 56: Brazil Cancer Cachexia Market Volume (K Unit) Forecast, by Application 2019 & 2032
- Table 57: Argentina Cancer Cachexia Market Revenue (Million) Forecast, by Application 2019 & 2032
- Table 58: Argentina Cancer Cachexia Market Volume (K Unit) Forecast, by Application 2019 & 2032
- Table 59: Rest of South America Cancer Cachexia Market Revenue (Million) Forecast, by Application 2019 & 2032
- Table 60: Rest of South America Cancer Cachexia Market Volume (K Unit) Forecast, by Application 2019 & 2032
- Table 61: Global Cancer Cachexia Market Revenue Million Forecast, by Therapeutics 2019 & 2032
- Table 62: Global Cancer Cachexia Market Volume K Unit Forecast, by Therapeutics 2019 & 2032
- Table 63: Global Cancer Cachexia Market Revenue Million Forecast, by Mechanism of Action 2019 & 2032
- Table 64: Global Cancer Cachexia Market Volume K Unit Forecast, by Mechanism of Action 2019 & 2032
- Table 65: Global Cancer Cachexia Market Revenue Million Forecast, by Country 2019 & 2032
- Table 66: Global Cancer Cachexia Market Volume K Unit Forecast, by Country 2019 & 2032
- Table 67: United States Cancer Cachexia Market Revenue (Million) Forecast, by Application 2019 & 2032
- Table 68: United States Cancer Cachexia Market Volume (K Unit) Forecast, by Application 2019 & 2032
- Table 69: Canada Cancer Cachexia Market Revenue (Million) Forecast, by Application 2019 & 2032
- Table 70: Canada Cancer Cachexia Market Volume (K Unit) Forecast, by Application 2019 & 2032
- Table 71: Mexico Cancer Cachexia Market Revenue (Million) Forecast, by Application 2019 & 2032
- Table 72: Mexico Cancer Cachexia Market Volume (K Unit) Forecast, by Application 2019 & 2032
- Table 73: Global Cancer Cachexia Market Revenue Million Forecast, by Therapeutics 2019 & 2032
- Table 74: Global Cancer Cachexia Market Volume K Unit Forecast, by Therapeutics 2019 & 2032
- Table 75: Global Cancer Cachexia Market Revenue Million Forecast, by Mechanism of Action 2019 & 2032
- Table 76: Global Cancer Cachexia Market Volume K Unit Forecast, by Mechanism of Action 2019 & 2032
- Table 77: Global Cancer Cachexia Market Revenue Million Forecast, by Country 2019 & 2032
- Table 78: Global Cancer Cachexia Market Volume K Unit Forecast, by Country 2019 & 2032
- Table 79: Germany Cancer Cachexia Market Revenue (Million) Forecast, by Application 2019 & 2032
- Table 80: Germany Cancer Cachexia Market Volume (K Unit) Forecast, by Application 2019 & 2032
- Table 81: United Kingdom Cancer Cachexia Market Revenue (Million) Forecast, by Application 2019 & 2032
- Table 82: United Kingdom Cancer Cachexia Market Volume (K Unit) Forecast, by Application 2019 & 2032
- Table 83: France Cancer Cachexia Market Revenue (Million) Forecast, by Application 2019 & 2032
- Table 84: France Cancer Cachexia Market Volume (K Unit) Forecast, by Application 2019 & 2032
- Table 85: Italy Cancer Cachexia Market Revenue (Million) Forecast, by Application 2019 & 2032
- Table 86: Italy Cancer Cachexia Market Volume (K Unit) Forecast, by Application 2019 & 2032
- Table 87: Spain Cancer Cachexia Market Revenue (Million) Forecast, by Application 2019 & 2032
- Table 88: Spain Cancer Cachexia Market Volume (K Unit) Forecast, by Application 2019 & 2032
- Table 89: Rest of Europe Cancer Cachexia Market Revenue (Million) Forecast, by Application 2019 & 2032
- Table 90: Rest of Europe Cancer Cachexia Market Volume (K Unit) Forecast, by Application 2019 & 2032
- Table 91: Global Cancer Cachexia Market Revenue Million Forecast, by Therapeutics 2019 & 2032
- Table 92: Global Cancer Cachexia Market Volume K Unit Forecast, by Therapeutics 2019 & 2032
- Table 93: Global Cancer Cachexia Market Revenue Million Forecast, by Mechanism of Action 2019 & 2032
- Table 94: Global Cancer Cachexia Market Volume K Unit Forecast, by Mechanism of Action 2019 & 2032
- Table 95: Global Cancer Cachexia Market Revenue Million Forecast, by Country 2019 & 2032
- Table 96: Global Cancer Cachexia Market Volume K Unit Forecast, by Country 2019 & 2032
- Table 97: China Cancer Cachexia Market Revenue (Million) Forecast, by Application 2019 & 2032
- Table 98: China Cancer Cachexia Market Volume (K Unit) Forecast, by Application 2019 & 2032
- Table 99: Japan Cancer Cachexia Market Revenue (Million) Forecast, by Application 2019 & 2032
- Table 100: Japan Cancer Cachexia Market Volume (K Unit) Forecast, by Application 2019 & 2032
- Table 101: India Cancer Cachexia Market Revenue (Million) Forecast, by Application 2019 & 2032
- Table 102: India Cancer Cachexia Market Volume (K Unit) Forecast, by Application 2019 & 2032
- Table 103: Australia Cancer Cachexia Market Revenue (Million) Forecast, by Application 2019 & 2032
- Table 104: Australia Cancer Cachexia Market Volume (K Unit) Forecast, by Application 2019 & 2032
- Table 105: South Korea Cancer Cachexia Market Revenue (Million) Forecast, by Application 2019 & 2032
- Table 106: South Korea Cancer Cachexia Market Volume (K Unit) Forecast, by Application 2019 & 2032
- Table 107: Rest of Asia Pacific Cancer Cachexia Market Revenue (Million) Forecast, by Application 2019 & 2032
- Table 108: Rest of Asia Pacific Cancer Cachexia Market Volume (K Unit) Forecast, by Application 2019 & 2032
- Table 109: Global Cancer Cachexia Market Revenue Million Forecast, by Therapeutics 2019 & 2032
- Table 110: Global Cancer Cachexia Market Volume K Unit Forecast, by Therapeutics 2019 & 2032
- Table 111: Global Cancer Cachexia Market Revenue Million Forecast, by Mechanism of Action 2019 & 2032
- Table 112: Global Cancer Cachexia Market Volume K Unit Forecast, by Mechanism of Action 2019 & 2032
- Table 113: Global Cancer Cachexia Market Revenue Million Forecast, by Country 2019 & 2032
- Table 114: Global Cancer Cachexia Market Volume K Unit Forecast, by Country 2019 & 2032
- Table 115: GCC Cancer Cachexia Market Revenue (Million) Forecast, by Application 2019 & 2032
- Table 116: GCC Cancer Cachexia Market Volume (K Unit) Forecast, by Application 2019 & 2032
- Table 117: South Africa Cancer Cachexia Market Revenue (Million) Forecast, by Application 2019 & 2032
- Table 118: South Africa Cancer Cachexia Market Volume (K Unit) Forecast, by Application 2019 & 2032
- Table 119: Rest of Middle East and Africa Cancer Cachexia Market Revenue (Million) Forecast, by Application 2019 & 2032
- Table 120: Rest of Middle East and Africa Cancer Cachexia Market Volume (K Unit) Forecast, by Application 2019 & 2032
- Table 121: Global Cancer Cachexia Market Revenue Million Forecast, by Therapeutics 2019 & 2032
- Table 122: Global Cancer Cachexia Market Volume K Unit Forecast, by Therapeutics 2019 & 2032
- Table 123: Global Cancer Cachexia Market Revenue Million Forecast, by Mechanism of Action 2019 & 2032
- Table 124: Global Cancer Cachexia Market Volume K Unit Forecast, by Mechanism of Action 2019 & 2032
- Table 125: Global Cancer Cachexia Market Revenue Million Forecast, by Country 2019 & 2032
- Table 126: Global Cancer Cachexia Market Volume K Unit Forecast, by Country 2019 & 2032
- Table 127: Brazil Cancer Cachexia Market Revenue (Million) Forecast, by Application 2019 & 2032
- Table 128: Brazil Cancer Cachexia Market Volume (K Unit) Forecast, by Application 2019 & 2032
- Table 129: Argentina Cancer Cachexia Market Revenue (Million) Forecast, by Application 2019 & 2032
- Table 130: Argentina Cancer Cachexia Market Volume (K Unit) Forecast, by Application 2019 & 2032
- Table 131: Rest of South America Cancer Cachexia Market Revenue (Million) Forecast, by Application 2019 & 2032
- Table 132: Rest of South America Cancer Cachexia Market Volume (K Unit) Forecast, by Application 2019 & 2032
Frequently Asked Questions
1. What is the projected Compound Annual Growth Rate (CAGR) of the Cancer Cachexia Market?
The projected CAGR is approximately 4.19%.
2. Which companies are prominent players in the Cancer Cachexia Market?
Key companies in the market include Green Cross Wellbeing Corporation, Aeterna Zentaris, NGM Biopharmaceuticals, Actimed Therapeutics, Merck KGaA, Fresenius Kabi, Aavogen Inc, TCI Peptide Therapeutics, Cannabics Pharmaceuticals Inc, Aveo Oncology, Artelo Biosciences Inc, Aphios Corporation, Tetra Bio-Pharma, Helsinn Group, Bristol-Myers Squibb Company, Pfizer Inc.
3. What are the main segments of the Cancer Cachexia Market?
The market segments include Therapeutics, Mechanism of Action.
4. Can you provide details about the market size?
The market size is estimated to be USD 2.72 Million as of 2022.
5. What are some drivers contributing to market growth?
Increasing Prevalence of Cancer Cachexia; Strong R&D and Product Pipeline.
6. What are the notable trends driving market growth?
Appetite Stimulators is Expected to Grow Significantly in the Cancer Cachexia Market.
7. Are there any restraints impacting market growth?
Stringent Regulatory Requirements.
8. Can you provide examples of recent developments in the market?
August 2022: ARTHEx biotech launched ENTRYTM , a platform that will allow it to advance its pipeline of drugs that includes drugs for myotonic dystrophy, cancer cachexia, and osteoarthritis by providing tissue-enriched delivery of antimiRs.
9. What pricing options are available for accessing the report?
Pricing options include single-user, multi-user, and enterprise licenses priced at USD 4750, USD 5250, and USD 8750 respectively.
10. Is the market size provided in terms of value or volume?
The market size is provided in terms of value, measured in Million and volume, measured in K Unit.
11. Are there any specific market keywords associated with the report?
Yes, the market keyword associated with the report is "Cancer Cachexia Market," which aids in identifying and referencing the specific market segment covered.
12. How do I determine which pricing option suits my needs best?
The pricing options vary based on user requirements and access needs. Individual users may opt for single-user licenses, while businesses requiring broader access may choose multi-user or enterprise licenses for cost-effective access to the report.
13. Are there any additional resources or data provided in the Cancer Cachexia Market report?
While the report offers comprehensive insights, it's advisable to review the specific contents or supplementary materials provided to ascertain if additional resources or data are available.
14. How can I stay updated on further developments or reports in the Cancer Cachexia Market?
To stay informed about further developments, trends, and reports in the Cancer Cachexia Market, consider subscribing to industry newsletters, following relevant companies and organizations, or regularly checking reputable industry news sources and publications.
Methodology
Step 1 - Identification of Relevant Samples Size from Population Database


Step 2 - Approaches for Defining Global Market Size (Value, Volume* & Price*)

Note*: In applicable scenarios
Step 3 - Data Sources
Primary Research
- Web Analytics
- Survey Reports
- Research Institute
- Latest Research Reports
- Opinion Leaders
Secondary Research
- Annual Reports
- White Paper
- Latest Press Release
- Industry Association
- Paid Database
- Investor Presentations

Step 4 - Data Triangulation
Involves using different sources of information in order to increase the validity of a study
These sources are likely to be stakeholders in a program - participants, other researchers, program staff, other community members, and so on.
Then we put all data in single framework & apply various statistical tools to find out the dynamic on the market.
During the analysis stage, feedback from the stakeholder groups would be compared to determine areas of agreement as well as areas of divergence
