

Key Insights
The global carbon composites market is experiencing robust growth, driven by increasing demand across diverse sectors. The 7.68% CAGR from 2019-2033 signifies a substantial expansion, projecting significant market value increases over the forecast period (2025-2033). Key drivers include the automotive industry's push for lightweight vehicles to improve fuel efficiency and reduce emissions, the aerospace sector's adoption of carbon composites for enhanced aircraft performance and durability, and the expanding renewable energy sector utilizing these materials in wind turbine blades and solar panel components. Furthermore, the construction industry's growing interest in stronger, lighter, and more durable building materials contributes to market growth. Technological advancements leading to improved manufacturing processes and the development of high-performance composites further fuel market expansion. While supply chain disruptions and the price volatility of raw materials pose certain restraints, ongoing research and development efforts aimed at cost reduction and performance enhancement are expected to mitigate these challenges. Major players like Hexcel Corporation, Toray Industries Inc., and SGL Carbon are strategically investing in innovation and expanding their market presence, signifying the industry's competitive landscape and potential for future consolidation.
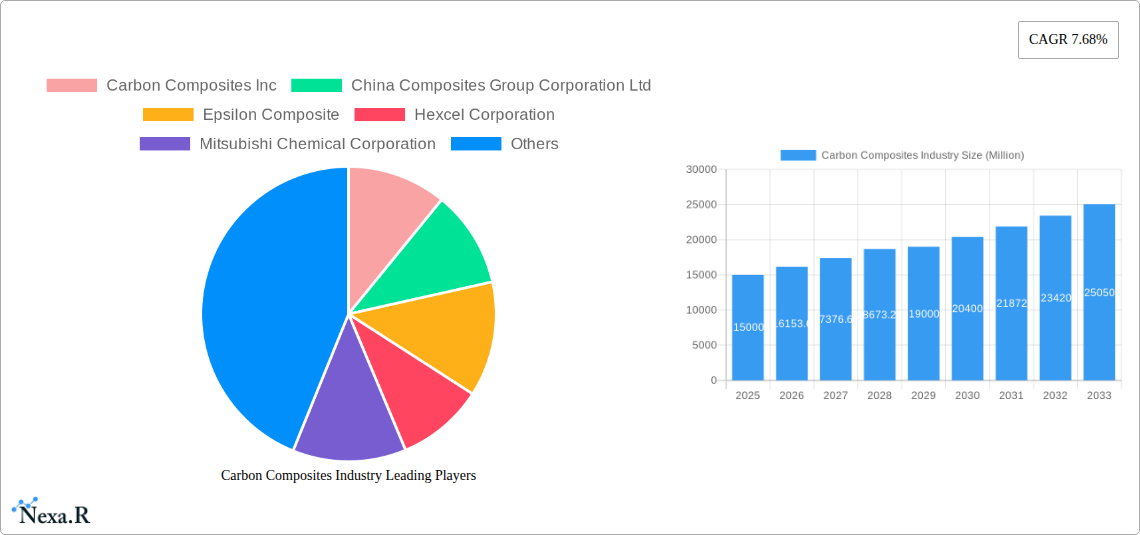
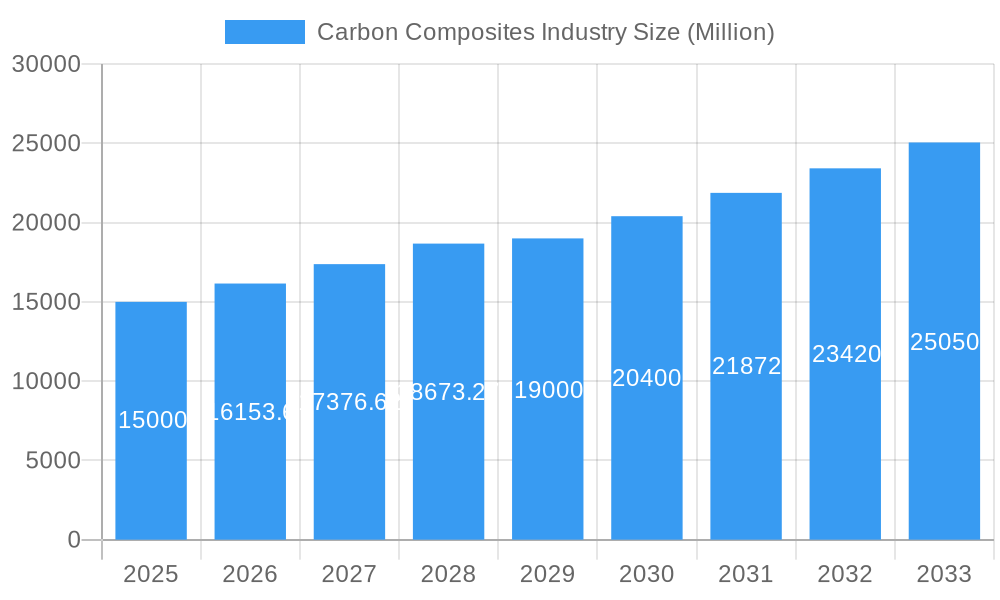
Carbon Composites Industry Market Size (In Billion)
The market segmentation is likely diverse, encompassing various types of carbon composites (e.g., carbon fiber reinforced polymers, carbon nanotubes) and applications (automotive, aerospace, wind energy, construction). Regional variations will exist, reflecting differing levels of industrial development and adoption rates. North America and Europe are likely to hold significant market shares due to established manufacturing bases and robust technological capabilities. However, rapidly developing economies in Asia-Pacific are projected to witness substantial growth in the coming years, presenting significant opportunities for market expansion. The competitive landscape involves both established multinational corporations and smaller specialized companies, resulting in a dynamic and innovative industry. The market's future trajectory is promising, contingent on ongoing technological advancements, government support for sustainable technologies, and strategic investments by key players. This consistent growth potential underscores the carbon composites market's importance in various strategic sectors.
Carbon Composites Industry Company Market Share
Carbon Composites Industry Market Report: 2019-2033
This comprehensive report provides an in-depth analysis of the Carbon Composites Industry, encompassing market dynamics, growth trends, regional dominance, product landscapes, key players, and future opportunities. The study period covers 2019-2033, with a focus on the base year 2025 and a forecast period from 2025-2033. This report is invaluable for industry professionals, investors, and strategic decision-makers seeking a clear understanding of this rapidly evolving market. The report covers parent markets such as advanced materials and child markets such as aerospace and automotive, delivering a granular view of market segmentation. The total market size in 2025 is estimated at xx Million.
Carbon Composites Industry Market Dynamics & Structure
This section analyzes the competitive landscape of the carbon composites industry, focusing on market concentration, technological innovation, regulatory influences, and market dynamics. The global market is characterized by a moderately concentrated structure, with key players such as Hexcel Corporation, Toray Industries Inc, and Solvay holding significant market share. The industry is witnessing intense competition, driven by technological advancements and a focus on cost reduction and performance enhancement.
- Market Concentration: xx% of the market is controlled by the top 5 players in 2025.
- Technological Innovation: Continuous R&D efforts are driving the development of lightweight, high-strength composites, leading to increased adoption across various end-use sectors.
- Regulatory Frameworks: Government regulations focusing on emissions reduction and sustainability are fostering growth in the carbon composites sector, particularly within automotive and aerospace applications.
- Competitive Product Substitutes: Materials like aluminum and steel pose competition; however, the superior strength-to-weight ratio of carbon composites drives their adoption in high-performance applications.
- End-User Demographics: The key end-use sectors include aerospace, automotive, wind energy, and sporting goods, with aerospace projected as the fastest-growing sector.
- M&A Trends: The industry has witnessed xx M&A deals in the past five years, indicating consolidation and strategic expansion among major players.
Carbon Composites Industry Growth Trends & Insights
The carbon composites market is experiencing robust growth, driven by increasing demand from various end-use sectors. From 2019 to 2024, the market witnessed a CAGR of xx%, reaching xx Million in 2024. The forecast period (2025-2033) projects a CAGR of xx%, with the market value projected to reach xx Million by 2033. This growth is primarily attributed to technological advancements, such as the development of improved manufacturing processes, leading to higher production volumes and reduced costs. The adoption of carbon composites is accelerating due to their superior mechanical properties, lightweight nature, and increasing demand for sustainable materials in various industries. Consumer preference shifts toward fuel efficiency in automobiles and lighter aircraft are key drivers. Emerging applications such as in construction and infrastructure also contribute significantly to market expansion.
Dominant Regions, Countries, or Segments in Carbon Composites Industry
North America and Europe currently dominate the carbon composites market, driven by strong aerospace and automotive sectors. However, the Asia-Pacific region is projected to witness the fastest growth due to rapid industrialization, increasing investments in infrastructure, and government support for renewable energy projects.
- North America: Strong presence of major players and high demand from the aerospace industry.
- Europe: Significant investments in research and development, combined with a focus on sustainable technologies.
- Asia-Pacific: Rapid industrial growth, increasing infrastructure development, and expanding automotive sector contribute to significant market expansion.
- Key Drivers: Government initiatives promoting sustainable technologies, growing investments in renewable energy infrastructure (particularly wind turbines), and increasing adoption of carbon composites in high-performance applications such as sports equipment.
Carbon Composites Industry Product Landscape
The carbon composites product landscape encompasses a variety of materials, including carbon fibers, prepregs, and finished parts. Ongoing innovations are focused on developing high-performance composites with improved properties such as strength, stiffness, and durability. Advancements in manufacturing technologies, such as automated fiber placement (AFP) and out-of-autoclave curing, are enabling high-volume production and reducing costs. Unique selling propositions include superior strength-to-weight ratio, high stiffness, and excellent fatigue resistance, making them attractive for demanding applications.
Key Drivers, Barriers & Challenges in Carbon Composites Industry
Key Drivers:
- Increasing demand for lightweight materials in the aerospace and automotive industries.
- Growth of renewable energy sectors, especially wind energy, which heavily uses carbon fiber composites.
- Government regulations promoting the adoption of sustainable and high-performance materials.
Challenges & Restraints:
- High production costs and complex manufacturing processes.
- Raw material price volatility and supply chain disruptions (estimated impact: xx% decrease in production in 2024 due to supply issues).
- Stringent regulatory requirements for safety and quality control.
Emerging Opportunities in Carbon Composites Industry
Emerging opportunities lie in the expansion into untapped markets, such as construction and infrastructure, where carbon composites can contribute to creating lighter and more durable structures. Furthermore, the development of new applications in consumer electronics and medical devices presents significant growth potential. Finally, the increasing demand for recycled and sustainable carbon composites opens up new avenues for innovation and market expansion.
Growth Accelerators in the Carbon Composites Industry
Technological breakthroughs in manufacturing processes, such as additive manufacturing and automated fiber placement, are significantly accelerating market growth. Strategic partnerships between material suppliers and end-users are driving innovation and streamlining the supply chain. Expanding into new markets, such as construction and medical devices, offers substantial growth opportunities.
Key Players Shaping the Carbon Composites Industry Market
- Carbon Composites Inc
- China Composites Group Corporation Ltd
- Epsilon Composite
- Hexcel Corporation
- Mitsubishi Chemical Corporation
- Nippon Carbon Co Ltd
- Plasan
- Rockman
- SGL Carbon
- Solvay
- Teijin Limited
- Toray Industries Inc
- List Not Exhaustive
Notable Milestones in Carbon Composites Industry Sector
- September 2023: Teijin Limited sold its investment in GH Craft Co. Ltd to TIP Composite Co. Ltd, impacting downstream market dynamics.
- April 2023: Solvay and GKN Aerospace extended their collaboration, focusing on thermoplastic composites for aircraft, signaling a significant shift in material development.
In-Depth Carbon Composites Industry Market Outlook
The future of the carbon composites industry looks promising, driven by continuous technological advancements, expanding applications, and supportive government policies. Strategic partnerships and investments in research and development will further fuel innovation, leading to cost reductions and improved performance. The industry is well-positioned for sustained growth, with significant opportunities in various high-growth sectors. The market is expected to continue its expansion, driven by the increasing demand for lightweight, high-strength materials across multiple applications.
Carbon Composites Industry Segmentation
-
1. Matrix
- 1.1. Hybrid
- 1.2. Metal
- 1.3. Ceramics
- 1.4. Carbon
-
1.5. Polymer
- 1.5.1. Thermosetting
- 1.5.2. Thermoplastic
-
2. Process
- 2.1. Prepeg Layup Process
- 2.2. Pultrusion and Winding
- 2.3. Wet Lamination and Infusion Process
- 2.4. Press and Injection Processes
- 2.5. Other Processes
-
3. Application
- 3.1. Aerospace and Defense
- 3.2. Automotive
- 3.3. Wind Turbines
- 3.4. Sport and Leisure
- 3.5. Civil Engineering
- 3.6. Marine Applications
- 3.7. Other Applications
Carbon Composites Industry Segmentation By Geography
-
1. Asia Pacific
- 1.1. China
- 1.2. India
- 1.3. Japan
- 1.4. South Korea
- 1.5. ASEAN Countries
- 1.6. Rest of Asia Pacific
-
2. North America
- 2.1. United States
- 2.2. Canada
- 2.3. Mexico
-
3. Europe
- 3.1. Germany
- 3.2. United Kingdom
- 3.3. France
- 3.4. Italy
- 3.5. Rest of Europe
-
4. South America
- 4.1. Brazil
- 4.2. Argentina
- 4.3. Rest of South America
-
5. Middle East and Africa
- 5.1. Saudi Arabia
- 5.2. South Africa
- 5.3. Rest of Middle East and Africa

Carbon Composites Industry Regional Market Share
Geographic Coverage of Carbon Composites Industry
Carbon Composites Industry REPORT HIGHLIGHTS
| Aspects | Details |
|---|---|
| Study Period | 2020-2034 |
| Base Year | 2025 |
| Estimated Year | 2026 |
| Forecast Period | 2026-2034 |
| Historical Period | 2020-2025 |
| Growth Rate | CAGR of 7.68% from 2020-2034 |
| Segmentation |
|
Table of Contents
- 1. Introduction
- 1.1. Research Scope
- 1.2. Market Segmentation
- 1.3. Research Objective
- 1.4. Definitions and Assumptions
- 2. Executive Summary
- 2.1. Market Snapshot
- 3. Market Dynamics
- 3.1. Market Drivers
- 3.2. Market Restrains
- 3.3. Market Trends
- 3.4. Market Opportunities
- 4. Market Factor Analysis
- 4.1. Porters Five Forces
- 4.1.1. Bargaining Power of Suppliers
- 4.1.2. Bargaining Power of Buyers
- 4.1.3. Threat of New Entrants
- 4.1.4. Threat of Substitutes
- 4.1.5. Competitive Rivalry
- 4.2. PESTEL analysis
- 4.3. BCG Analysis
- 4.3.1. Stars (High Growth, High Market Share)
- 4.3.2. Cash Cows (Low Growth, High Market Share)
- 4.3.3. Question Mark (High Growth, Low Market Share)
- 4.3.4. Dogs (Low Growth, Low Market Share)
- 4.4. Ansoff Matrix Analysis
- 4.5. Supply Chain Analysis
- 4.6. Regulatory Landscape
- 4.7. Current Market Potential and Opportunity Assessment (TAM–SAM–SOM Framework)
- 4.8. NRP Analyst Note
- 4.1. Porters Five Forces
- 5. Market Analysis, Insights and Forecast 2021-2033
- 5.1. Market Analysis, Insights and Forecast - by Matrix
- 5.1.1. Hybrid
- 5.1.2. Metal
- 5.1.3. Ceramics
- 5.1.4. Carbon
- 5.1.5. Polymer
- 5.1.5.1. Thermosetting
- 5.1.5.2. Thermoplastic
- 5.2. Market Analysis, Insights and Forecast - by Process
- 5.2.1. Prepeg Layup Process
- 5.2.2. Pultrusion and Winding
- 5.2.3. Wet Lamination and Infusion Process
- 5.2.4. Press and Injection Processes
- 5.2.5. Other Processes
- 5.3. Market Analysis, Insights and Forecast - by Application
- 5.3.1. Aerospace and Defense
- 5.3.2. Automotive
- 5.3.3. Wind Turbines
- 5.3.4. Sport and Leisure
- 5.3.5. Civil Engineering
- 5.3.6. Marine Applications
- 5.3.7. Other Applications
- 5.4. Market Analysis, Insights and Forecast - by Region
- 5.4.1. Asia Pacific
- 5.4.2. North America
- 5.4.3. Europe
- 5.4.4. South America
- 5.4.5. Middle East and Africa
- 5.1. Market Analysis, Insights and Forecast - by Matrix
- 6. Global Carbon Composites Industry Analysis, Insights and Forecast, 2021-2033
- 6.1. Market Analysis, Insights and Forecast - by Matrix
- 6.1.1. Hybrid
- 6.1.2. Metal
- 6.1.3. Ceramics
- 6.1.4. Carbon
- 6.1.5. Polymer
- 6.1.5.1. Thermosetting
- 6.1.5.2. Thermoplastic
- 6.2. Market Analysis, Insights and Forecast - by Process
- 6.2.1. Prepeg Layup Process
- 6.2.2. Pultrusion and Winding
- 6.2.3. Wet Lamination and Infusion Process
- 6.2.4. Press and Injection Processes
- 6.2.5. Other Processes
- 6.3. Market Analysis, Insights and Forecast - by Application
- 6.3.1. Aerospace and Defense
- 6.3.2. Automotive
- 6.3.3. Wind Turbines
- 6.3.4. Sport and Leisure
- 6.3.5. Civil Engineering
- 6.3.6. Marine Applications
- 6.3.7. Other Applications
- 6.1. Market Analysis, Insights and Forecast - by Matrix
- 7. Asia Pacific Carbon Composites Industry Analysis, Insights and Forecast, 2020-2032
- 7.1. Market Analysis, Insights and Forecast - by Matrix
- 7.1.1. Hybrid
- 7.1.2. Metal
- 7.1.3. Ceramics
- 7.1.4. Carbon
- 7.1.5. Polymer
- 7.1.5.1. Thermosetting
- 7.1.5.2. Thermoplastic
- 7.2. Market Analysis, Insights and Forecast - by Process
- 7.2.1. Prepeg Layup Process
- 7.2.2. Pultrusion and Winding
- 7.2.3. Wet Lamination and Infusion Process
- 7.2.4. Press and Injection Processes
- 7.2.5. Other Processes
- 7.3. Market Analysis, Insights and Forecast - by Application
- 7.3.1. Aerospace and Defense
- 7.3.2. Automotive
- 7.3.3. Wind Turbines
- 7.3.4. Sport and Leisure
- 7.3.5. Civil Engineering
- 7.3.6. Marine Applications
- 7.3.7. Other Applications
- 7.1. Market Analysis, Insights and Forecast - by Matrix
- 8. North America Carbon Composites Industry Analysis, Insights and Forecast, 2020-2032
- 8.1. Market Analysis, Insights and Forecast - by Matrix
- 8.1.1. Hybrid
- 8.1.2. Metal
- 8.1.3. Ceramics
- 8.1.4. Carbon
- 8.1.5. Polymer
- 8.1.5.1. Thermosetting
- 8.1.5.2. Thermoplastic
- 8.2. Market Analysis, Insights and Forecast - by Process
- 8.2.1. Prepeg Layup Process
- 8.2.2. Pultrusion and Winding
- 8.2.3. Wet Lamination and Infusion Process
- 8.2.4. Press and Injection Processes
- 8.2.5. Other Processes
- 8.3. Market Analysis, Insights and Forecast - by Application
- 8.3.1. Aerospace and Defense
- 8.3.2. Automotive
- 8.3.3. Wind Turbines
- 8.3.4. Sport and Leisure
- 8.3.5. Civil Engineering
- 8.3.6. Marine Applications
- 8.3.7. Other Applications
- 8.1. Market Analysis, Insights and Forecast - by Matrix
- 9. Europe Carbon Composites Industry Analysis, Insights and Forecast, 2020-2032
- 9.1. Market Analysis, Insights and Forecast - by Matrix
- 9.1.1. Hybrid
- 9.1.2. Metal
- 9.1.3. Ceramics
- 9.1.4. Carbon
- 9.1.5. Polymer
- 9.1.5.1. Thermosetting
- 9.1.5.2. Thermoplastic
- 9.2. Market Analysis, Insights and Forecast - by Process
- 9.2.1. Prepeg Layup Process
- 9.2.2. Pultrusion and Winding
- 9.2.3. Wet Lamination and Infusion Process
- 9.2.4. Press and Injection Processes
- 9.2.5. Other Processes
- 9.3. Market Analysis, Insights and Forecast - by Application
- 9.3.1. Aerospace and Defense
- 9.3.2. Automotive
- 9.3.3. Wind Turbines
- 9.3.4. Sport and Leisure
- 9.3.5. Civil Engineering
- 9.3.6. Marine Applications
- 9.3.7. Other Applications
- 9.1. Market Analysis, Insights and Forecast - by Matrix
- 10. South America Carbon Composites Industry Analysis, Insights and Forecast, 2020-2032
- 10.1. Market Analysis, Insights and Forecast - by Matrix
- 10.1.1. Hybrid
- 10.1.2. Metal
- 10.1.3. Ceramics
- 10.1.4. Carbon
- 10.1.5. Polymer
- 10.1.5.1. Thermosetting
- 10.1.5.2. Thermoplastic
- 10.2. Market Analysis, Insights and Forecast - by Process
- 10.2.1. Prepeg Layup Process
- 10.2.2. Pultrusion and Winding
- 10.2.3. Wet Lamination and Infusion Process
- 10.2.4. Press and Injection Processes
- 10.2.5. Other Processes
- 10.3. Market Analysis, Insights and Forecast - by Application
- 10.3.1. Aerospace and Defense
- 10.3.2. Automotive
- 10.3.3. Wind Turbines
- 10.3.4. Sport and Leisure
- 10.3.5. Civil Engineering
- 10.3.6. Marine Applications
- 10.3.7. Other Applications
- 10.1. Market Analysis, Insights and Forecast - by Matrix
- 11. Middle East and Africa Carbon Composites Industry Analysis, Insights and Forecast, 2020-2032
- 11.1. Market Analysis, Insights and Forecast - by Matrix
- 11.1.1. Hybrid
- 11.1.2. Metal
- 11.1.3. Ceramics
- 11.1.4. Carbon
- 11.1.5. Polymer
- 11.1.5.1. Thermosetting
- 11.1.5.2. Thermoplastic
- 11.2. Market Analysis, Insights and Forecast - by Process
- 11.2.1. Prepeg Layup Process
- 11.2.2. Pultrusion and Winding
- 11.2.3. Wet Lamination and Infusion Process
- 11.2.4. Press and Injection Processes
- 11.2.5. Other Processes
- 11.3. Market Analysis, Insights and Forecast - by Application
- 11.3.1. Aerospace and Defense
- 11.3.2. Automotive
- 11.3.3. Wind Turbines
- 11.3.4. Sport and Leisure
- 11.3.5. Civil Engineering
- 11.3.6. Marine Applications
- 11.3.7. Other Applications
- 11.1. Market Analysis, Insights and Forecast - by Matrix
- 12. Competitive Analysis
- 12.1. Company Profiles
- 12.1.1 Carbon Composites Inc
- 12.1.1.1. Company Overview
- 12.1.1.2. Products
- 12.1.1.3. Company Financials
- 12.1.1.4. SWOT Analysis
- 12.1.2 China Composites Group Corporation Ltd
- 12.1.2.1. Company Overview
- 12.1.2.2. Products
- 12.1.2.3. Company Financials
- 12.1.2.4. SWOT Analysis
- 12.1.3 Epsilon Composite
- 12.1.3.1. Company Overview
- 12.1.3.2. Products
- 12.1.3.3. Company Financials
- 12.1.3.4. SWOT Analysis
- 12.1.4 Hexcel Corporation
- 12.1.4.1. Company Overview
- 12.1.4.2. Products
- 12.1.4.3. Company Financials
- 12.1.4.4. SWOT Analysis
- 12.1.5 Mitsubishi Chemical Corporation
- 12.1.5.1. Company Overview
- 12.1.5.2. Products
- 12.1.5.3. Company Financials
- 12.1.5.4. SWOT Analysis
- 12.1.6 Nippon Carbon Co Ltd
- 12.1.6.1. Company Overview
- 12.1.6.2. Products
- 12.1.6.3. Company Financials
- 12.1.6.4. SWOT Analysis
- 12.1.7 Plasan
- 12.1.7.1. Company Overview
- 12.1.7.2. Products
- 12.1.7.3. Company Financials
- 12.1.7.4. SWOT Analysis
- 12.1.8 Rockman
- 12.1.8.1. Company Overview
- 12.1.8.2. Products
- 12.1.8.3. Company Financials
- 12.1.8.4. SWOT Analysis
- 12.1.9 SGL Carbon
- 12.1.9.1. Company Overview
- 12.1.9.2. Products
- 12.1.9.3. Company Financials
- 12.1.9.4. SWOT Analysis
- 12.1.10 Solvay
- 12.1.10.1. Company Overview
- 12.1.10.2. Products
- 12.1.10.3. Company Financials
- 12.1.10.4. SWOT Analysis
- 12.1.11 Teijin Limited
- 12.1.11.1. Company Overview
- 12.1.11.2. Products
- 12.1.11.3. Company Financials
- 12.1.11.4. SWOT Analysis
- 12.1.12 Toray Industries Inc *List Not Exhaustive
- 12.1.12.1. Company Overview
- 12.1.12.2. Products
- 12.1.12.3. Company Financials
- 12.1.12.4. SWOT Analysis
- 12.1.1 Carbon Composites Inc
- 12.2. Market Entropy
- 12.2.1 Company's Key Areas Served
- 12.2.2 Recent Developments
- 12.3. Company Market Share Analysis 2025
- 12.3.1 Top 5 Companies Market Share Analysis
- 12.3.2 Top 3 Companies Market Share Analysis
- 12.4. List of Potential Customers
- 13. Research Methodology
List of Figures
- Figure 1: Global Carbon Composites Industry Revenue Breakdown (Million, %) by Region 2025 & 2033
- Figure 2: Asia Pacific Carbon Composites Industry Revenue (Million), by Matrix 2025 & 2033
- Figure 3: Asia Pacific Carbon Composites Industry Revenue Share (%), by Matrix 2025 & 2033
- Figure 4: Asia Pacific Carbon Composites Industry Revenue (Million), by Process 2025 & 2033
- Figure 5: Asia Pacific Carbon Composites Industry Revenue Share (%), by Process 2025 & 2033
- Figure 6: Asia Pacific Carbon Composites Industry Revenue (Million), by Application 2025 & 2033
- Figure 7: Asia Pacific Carbon Composites Industry Revenue Share (%), by Application 2025 & 2033
- Figure 8: Asia Pacific Carbon Composites Industry Revenue (Million), by Country 2025 & 2033
- Figure 9: Asia Pacific Carbon Composites Industry Revenue Share (%), by Country 2025 & 2033
- Figure 10: North America Carbon Composites Industry Revenue (Million), by Matrix 2025 & 2033
- Figure 11: North America Carbon Composites Industry Revenue Share (%), by Matrix 2025 & 2033
- Figure 12: North America Carbon Composites Industry Revenue (Million), by Process 2025 & 2033
- Figure 13: North America Carbon Composites Industry Revenue Share (%), by Process 2025 & 2033
- Figure 14: North America Carbon Composites Industry Revenue (Million), by Application 2025 & 2033
- Figure 15: North America Carbon Composites Industry Revenue Share (%), by Application 2025 & 2033
- Figure 16: North America Carbon Composites Industry Revenue (Million), by Country 2025 & 2033
- Figure 17: North America Carbon Composites Industry Revenue Share (%), by Country 2025 & 2033
- Figure 18: Europe Carbon Composites Industry Revenue (Million), by Matrix 2025 & 2033
- Figure 19: Europe Carbon Composites Industry Revenue Share (%), by Matrix 2025 & 2033
- Figure 20: Europe Carbon Composites Industry Revenue (Million), by Process 2025 & 2033
- Figure 21: Europe Carbon Composites Industry Revenue Share (%), by Process 2025 & 2033
- Figure 22: Europe Carbon Composites Industry Revenue (Million), by Application 2025 & 2033
- Figure 23: Europe Carbon Composites Industry Revenue Share (%), by Application 2025 & 2033
- Figure 24: Europe Carbon Composites Industry Revenue (Million), by Country 2025 & 2033
- Figure 25: Europe Carbon Composites Industry Revenue Share (%), by Country 2025 & 2033
- Figure 26: South America Carbon Composites Industry Revenue (Million), by Matrix 2025 & 2033
- Figure 27: South America Carbon Composites Industry Revenue Share (%), by Matrix 2025 & 2033
- Figure 28: South America Carbon Composites Industry Revenue (Million), by Process 2025 & 2033
- Figure 29: South America Carbon Composites Industry Revenue Share (%), by Process 2025 & 2033
- Figure 30: South America Carbon Composites Industry Revenue (Million), by Application 2025 & 2033
- Figure 31: South America Carbon Composites Industry Revenue Share (%), by Application 2025 & 2033
- Figure 32: South America Carbon Composites Industry Revenue (Million), by Country 2025 & 2033
- Figure 33: South America Carbon Composites Industry Revenue Share (%), by Country 2025 & 2033
- Figure 34: Middle East and Africa Carbon Composites Industry Revenue (Million), by Matrix 2025 & 2033
- Figure 35: Middle East and Africa Carbon Composites Industry Revenue Share (%), by Matrix 2025 & 2033
- Figure 36: Middle East and Africa Carbon Composites Industry Revenue (Million), by Process 2025 & 2033
- Figure 37: Middle East and Africa Carbon Composites Industry Revenue Share (%), by Process 2025 & 2033
- Figure 38: Middle East and Africa Carbon Composites Industry Revenue (Million), by Application 2025 & 2033
- Figure 39: Middle East and Africa Carbon Composites Industry Revenue Share (%), by Application 2025 & 2033
- Figure 40: Middle East and Africa Carbon Composites Industry Revenue (Million), by Country 2025 & 2033
- Figure 41: Middle East and Africa Carbon Composites Industry Revenue Share (%), by Country 2025 & 2033
List of Tables
- Table 1: Global Carbon Composites Industry Revenue Million Forecast, by Matrix 2020 & 2033
- Table 2: Global Carbon Composites Industry Revenue Million Forecast, by Process 2020 & 2033
- Table 3: Global Carbon Composites Industry Revenue Million Forecast, by Application 2020 & 2033
- Table 4: Global Carbon Composites Industry Revenue Million Forecast, by Region 2020 & 2033
- Table 5: Global Carbon Composites Industry Revenue Million Forecast, by Matrix 2020 & 2033
- Table 6: Global Carbon Composites Industry Revenue Million Forecast, by Process 2020 & 2033
- Table 7: Global Carbon Composites Industry Revenue Million Forecast, by Application 2020 & 2033
- Table 8: Global Carbon Composites Industry Revenue Million Forecast, by Country 2020 & 2033
- Table 9: China Carbon Composites Industry Revenue (Million) Forecast, by Application 2020 & 2033
- Table 10: India Carbon Composites Industry Revenue (Million) Forecast, by Application 2020 & 2033
- Table 11: Japan Carbon Composites Industry Revenue (Million) Forecast, by Application 2020 & 2033
- Table 12: South Korea Carbon Composites Industry Revenue (Million) Forecast, by Application 2020 & 2033
- Table 13: ASEAN Countries Carbon Composites Industry Revenue (Million) Forecast, by Application 2020 & 2033
- Table 14: Rest of Asia Pacific Carbon Composites Industry Revenue (Million) Forecast, by Application 2020 & 2033
- Table 15: Global Carbon Composites Industry Revenue Million Forecast, by Matrix 2020 & 2033
- Table 16: Global Carbon Composites Industry Revenue Million Forecast, by Process 2020 & 2033
- Table 17: Global Carbon Composites Industry Revenue Million Forecast, by Application 2020 & 2033
- Table 18: Global Carbon Composites Industry Revenue Million Forecast, by Country 2020 & 2033
- Table 19: United States Carbon Composites Industry Revenue (Million) Forecast, by Application 2020 & 2033
- Table 20: Canada Carbon Composites Industry Revenue (Million) Forecast, by Application 2020 & 2033
- Table 21: Mexico Carbon Composites Industry Revenue (Million) Forecast, by Application 2020 & 2033
- Table 22: Global Carbon Composites Industry Revenue Million Forecast, by Matrix 2020 & 2033
- Table 23: Global Carbon Composites Industry Revenue Million Forecast, by Process 2020 & 2033
- Table 24: Global Carbon Composites Industry Revenue Million Forecast, by Application 2020 & 2033
- Table 25: Global Carbon Composites Industry Revenue Million Forecast, by Country 2020 & 2033
- Table 26: Germany Carbon Composites Industry Revenue (Million) Forecast, by Application 2020 & 2033
- Table 27: United Kingdom Carbon Composites Industry Revenue (Million) Forecast, by Application 2020 & 2033
- Table 28: France Carbon Composites Industry Revenue (Million) Forecast, by Application 2020 & 2033
- Table 29: Italy Carbon Composites Industry Revenue (Million) Forecast, by Application 2020 & 2033
- Table 30: Rest of Europe Carbon Composites Industry Revenue (Million) Forecast, by Application 2020 & 2033
- Table 31: Global Carbon Composites Industry Revenue Million Forecast, by Matrix 2020 & 2033
- Table 32: Global Carbon Composites Industry Revenue Million Forecast, by Process 2020 & 2033
- Table 33: Global Carbon Composites Industry Revenue Million Forecast, by Application 2020 & 2033
- Table 34: Global Carbon Composites Industry Revenue Million Forecast, by Country 2020 & 2033
- Table 35: Brazil Carbon Composites Industry Revenue (Million) Forecast, by Application 2020 & 2033
- Table 36: Argentina Carbon Composites Industry Revenue (Million) Forecast, by Application 2020 & 2033
- Table 37: Rest of South America Carbon Composites Industry Revenue (Million) Forecast, by Application 2020 & 2033
- Table 38: Global Carbon Composites Industry Revenue Million Forecast, by Matrix 2020 & 2033
- Table 39: Global Carbon Composites Industry Revenue Million Forecast, by Process 2020 & 2033
- Table 40: Global Carbon Composites Industry Revenue Million Forecast, by Application 2020 & 2033
- Table 41: Global Carbon Composites Industry Revenue Million Forecast, by Country 2020 & 2033
- Table 42: Saudi Arabia Carbon Composites Industry Revenue (Million) Forecast, by Application 2020 & 2033
- Table 43: South Africa Carbon Composites Industry Revenue (Million) Forecast, by Application 2020 & 2033
- Table 44: Rest of Middle East and Africa Carbon Composites Industry Revenue (Million) Forecast, by Application 2020 & 2033
Frequently Asked Questions
1. What is the projected Compound Annual Growth Rate (CAGR) of the Carbon Composites Industry?
The projected CAGR is approximately 7.68%.
2. Which companies are prominent players in the Carbon Composites Industry?
Key companies in the market include Carbon Composites Inc, China Composites Group Corporation Ltd, Epsilon Composite, Hexcel Corporation, Mitsubishi Chemical Corporation, Nippon Carbon Co Ltd, Plasan, Rockman, SGL Carbon, Solvay, Teijin Limited, Toray Industries Inc *List Not Exhaustive.
3. What are the main segments of the Carbon Composites Industry?
The market segments include Matrix, Process, Application.
4. Can you provide details about the market size?
The market size is estimated to be USD XX Million as of 2022.
5. What are some drivers contributing to market growth?
Increasing Demand from the Aerospace and Defense Industry; Increasing Demand from the Wind Energy Sector.
6. What are the notable trends driving market growth?
Aerospace and defense applications to dominate the market.
7. Are there any restraints impacting market growth?
Increasing Demand from the Aerospace and Defense Industry; Increasing Demand from the Wind Energy Sector.
8. Can you provide examples of recent developments in the market?
September 2023: Teijin Limited agreed to sell its entire investment in GH Craft Co. Ltd, an equity-method subsidiary of Teijin's composites business in Japan, to TIP Composite Co. Ltd (Tokyo). Teijin acquired GH Craft as part of its downstream strategy in July 2008.
9. What pricing options are available for accessing the report?
Pricing options include single-user, multi-user, and enterprise licenses priced at USD 4750, USD 5250, and USD 8750 respectively.
10. Is the market size provided in terms of value or volume?
The market size is provided in terms of value, measured in Million.
11. Are there any specific market keywords associated with the report?
Yes, the market keyword associated with the report is "Carbon Composites Industry," which aids in identifying and referencing the specific market segment covered.
12. How do I determine which pricing option suits my needs best?
The pricing options vary based on user requirements and access needs. Individual users may opt for single-user licenses, while businesses requiring broader access may choose multi-user or enterprise licenses for cost-effective access to the report.
13. Are there any additional resources or data provided in the Carbon Composites Industry report?
While the report offers comprehensive insights, it's advisable to review the specific contents or supplementary materials provided to ascertain if additional resources or data are available.
14. How can I stay updated on further developments or reports in the Carbon Composites Industry?
To stay informed about further developments, trends, and reports in the Carbon Composites Industry, consider subscribing to industry newsletters, following relevant companies and organizations, or regularly checking reputable industry news sources and publications.
Methodology
Step 1 - Identification of Relevant Samples Size from Population Database


Step 2 - Approaches for Defining Global Market Size (Value, Volume* & Price*)

Note*: In applicable scenarios
Step 3 - Data Sources
Primary Research
- Web Analytics
- Survey Reports
- Research Institute
- Latest Research Reports
- Opinion Leaders
Secondary Research
- Annual Reports
- White Paper
- Latest Press Release
- Industry Association
- Paid Database
- Investor Presentations

Step 4 - Data Triangulation
Involves using different sources of information in order to increase the validity of a study
These sources are likely to be stakeholders in a program - participants, other researchers, program staff, other community members, and so on.
Then we put all data in single framework & apply various statistical tools to find out the dynamic on the market.
During the analysis stage, feedback from the stakeholder groups would be compared to determine areas of agreement as well as areas of divergence