

Key Insights
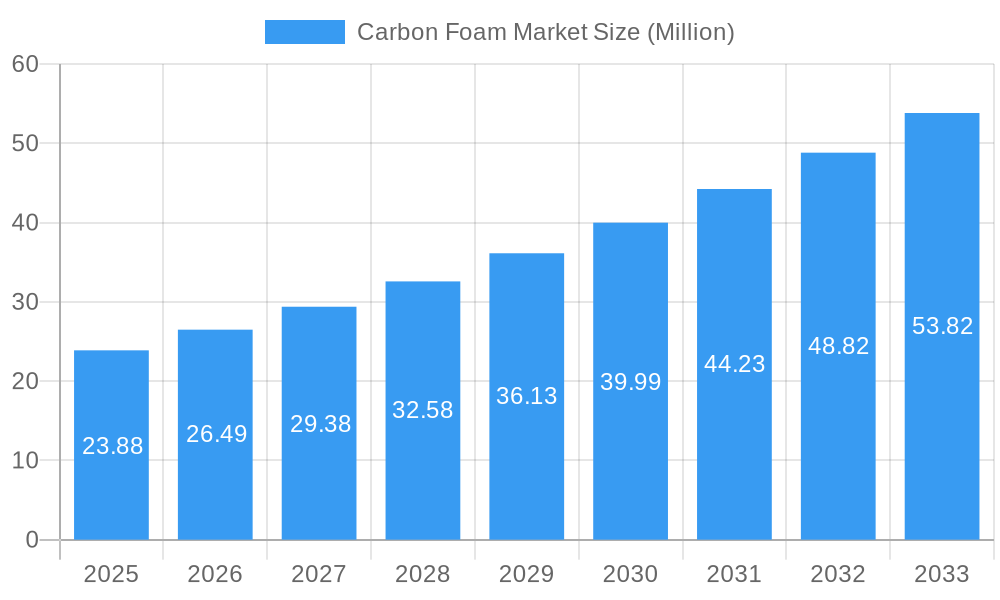
The global carbon foam market, valued at $23.88 million in 2025, is poised for significant growth, exhibiting a Compound Annual Growth Rate (CAGR) of 10.73% from 2025 to 2033. This expansion is driven by the increasing demand for lightweight yet high-strength materials across diverse sectors. The aerospace and defense industry, a key adopter, leverages carbon foam's exceptional properties for reducing aircraft weight and improving fuel efficiency. Similarly, the automotive industry utilizes carbon foam for enhanced vehicle performance and safety features. The building and construction sector is also witnessing growing adoption, driven by the need for energy-efficient and durable building materials. Furthermore, the rising adoption of carbon foam in electrical and industrial applications contributes to market expansion. The market segmentation reveals a strong preference for graphitic carbon foam due to its superior properties compared to non-graphitic counterparts. Geographical analysis indicates strong growth potential across North America, Europe, and the Asia-Pacific region, fueled by robust industrial activity and government initiatives promoting sustainable materials. While challenges like the relatively high production cost of carbon foam exist, ongoing research and development efforts focusing on cost reduction and improved material properties are likely to mitigate these restraints.
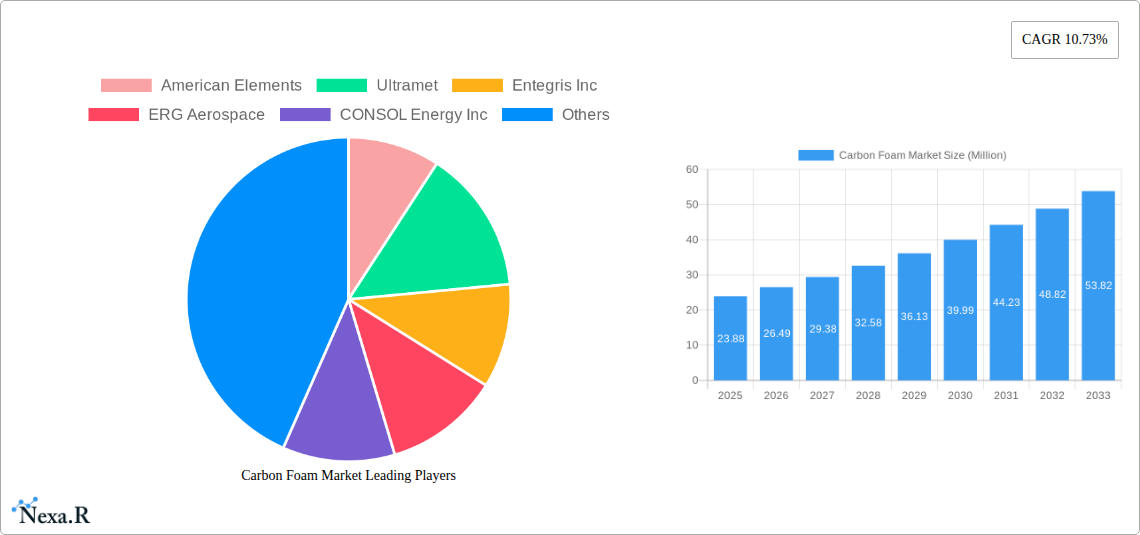
Carbon Foam Market Market Size (In Million)
The market's future trajectory is likely to be shaped by advancements in manufacturing techniques, leading to greater production efficiency and cost reductions. The development of novel applications in emerging sectors like renewable energy and medical devices will further contribute to market expansion. Key players in the carbon foam market are strategically focusing on enhancing product offerings and expanding their geographical reach to maintain a competitive edge. The adoption of sustainable manufacturing processes and increased collaboration between industry stakeholders are crucial factors that will propel the market toward greater sustainability and efficiency. This combination of technological advancements, growing demand across diverse end-user industries, and strategic market initiatives positions the carbon foam market for substantial growth in the coming years.
Carbon Foam Market Company Market Share
Carbon Foam Market: A Comprehensive Market Report (2019-2033)
This comprehensive report provides an in-depth analysis of the global Carbon Foam market, encompassing market dynamics, growth trends, regional analysis, product landscape, key players, and future outlook. The study period covers 2019-2033, with 2025 as the base year and a forecast period of 2025-2033. The report is invaluable for industry professionals, investors, and researchers seeking a complete understanding of this evolving market, valued at xx Million in 2025 and projected to reach xx Million by 2033.
Carbon Foam Market Market Dynamics & Structure
The Carbon Foam market, a specialized segment within the advanced materials landscape, is characterized by a dynamic interplay of moderate concentration and intense innovation. Leading manufacturers are actively engaged in a competitive arena, driven by continuous advancements in synthesis techniques and the refinement of material properties. The market's trajectory is significantly influenced by a dual force: the growing imperative for sustainability and stringent environmental regulations that champion waste reduction and eco-friendly manufacturing processes. Concurrently, established alternatives like polymer foams and metallic foams present persistent competitive challenges, necessitating ongoing differentiation and value proposition enhancement for carbon foam. The diverse spectrum of end-user industries, spanning critical sectors such as aerospace, defense, automotive, and construction, contributes to a complex and evolving demand landscape. Mergers and acquisitions (M&A) activity has historically been subdued (averaging around xx deals per five-year period), signaling a mature and relatively stable competitive structure among established players.
- Market Concentration: The market exhibits moderate concentration, with the top 5 players projected to command approximately xx% of the market share by 2025.
- Technological Innovation: A primary focus for market players is the advancement of carbon foam's thermal insulation capabilities, enhancement of its strength-to-weight ratio for lightweighting applications, and the pursuit of greater cost-effectiveness in production.
- Regulatory Framework: The overarching emphasis on environmental stewardship and the reduction of ecological footprints is a significant catalyst, driving innovation in sustainable production methodologies and material life cycles.
- Competitive Substitutes: Polymer foams and metallic foams remain formidable competitors, offering viable alternatives in specific application areas and necessitating strategic market positioning for carbon foam.
- End-User Demographics: The primary consumers of carbon foam are found within the Aerospace & Defense, Automotive, and Building & Construction sectors, each with distinct and evolving material requirements.
- M&A Trends: The low volume of M&A activity suggests a relatively stable competitive landscape, with established players focusing on organic growth and technological development.
Carbon Foam Market Growth Trends & Insights
The Carbon Foam market experienced steady growth during the historical period (2019-2024), with a CAGR of xx%. This growth is attributed to increasing demand from various end-use industries, driven by the unique properties of carbon foam, such as its lightweight nature, high strength-to-weight ratio, and excellent thermal insulation capabilities. The market is expected to continue this trajectory during the forecast period (2025-2033), with a projected CAGR of xx%. Technological advancements, such as the development of novel synthesis techniques and the expansion of applications, are expected to further fuel market expansion. Consumer behavior shifts towards sustainable and lightweight materials are also contributing to market growth. Market penetration is currently estimated at xx% in key industries, with significant room for expansion.
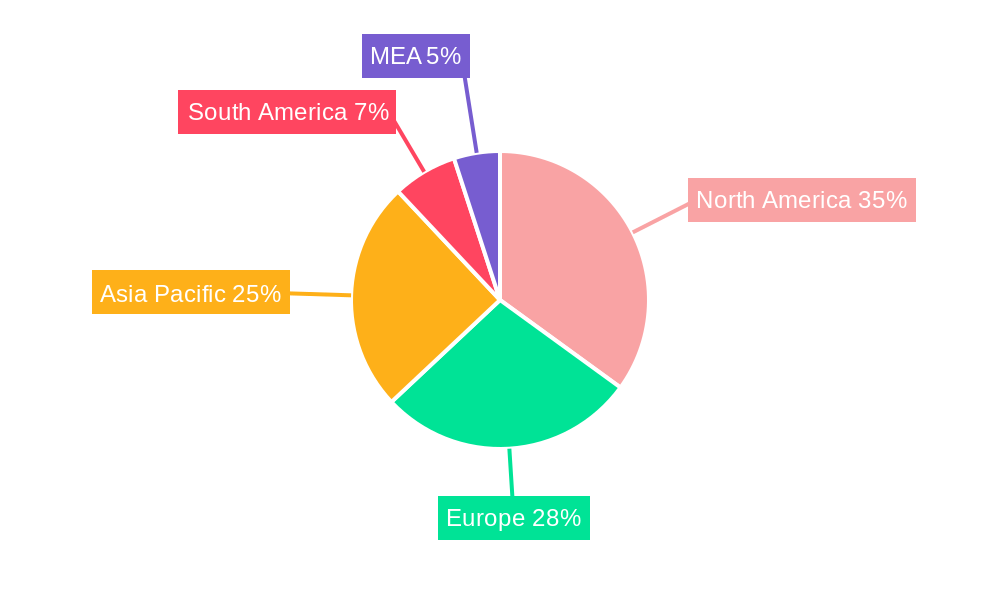
Dominant Regions, Countries, or Segments in Carbon Foam Market
North America currently leads the global Carbon Foam market, capturing an estimated xx% of the market share. This dominance is underpinned by substantial demand from its robust aerospace and defense industries and significant investments in cutting-edge research and development initiatives. Europe closely follows, holding a xx% market share, propelled by escalating construction activities and the implementation of increasingly stringent environmental mandates. Within the material segments, graphitic carbon foam commands a larger market share (xx%) compared to its non-graphitic counterpart, primarily due to its superior performance characteristics for high-demand, high-performance applications. The Aerospace and Defense sector stands out as the leading end-user industry (representing xx%), driven by an unyielding requirement for advanced materials that offer exceptional lightness and high strength for aircraft and spacecraft manufacturing.
- Key Drivers in North America: A strong and innovative aerospace and defense sector, substantial investment in R&D, and supportive government policies are instrumental in driving market growth.
- Key Drivers in Europe: Strict environmental regulations, a burgeoning focus on sustainable building materials, and a vibrant construction sector are key contributors to the European market's expansion.
- Dominant Type: Graphitic carbon foam is the prevailing type, recognized for its exceptional properties that make it ideal for high-performance applications.
- Dominant End-user Industry: The Aerospace & Defense industry is the primary consumer, driven by the critical need for lightweight yet high-strength materials.
Carbon Foam Market Product Landscape
Carbon foams are characterized by their porous structure, which imparts unique properties like low density, high porosity, excellent thermal insulation, and high sound absorption. Recent innovations focus on enhancing mechanical strength, tailoring porosity for specific applications, and developing cost-effective manufacturing processes. These advancements are expanding the range of applications, from lightweight components in aerospace and automotive industries to advanced thermal management solutions in electronics. Key selling propositions include improved energy efficiency, weight reduction, and enhanced performance in various applications.
Key Drivers, Barriers & Challenges in Carbon Foam Market
Key Drivers: The escalating global demand for lightweight materials across diverse industries, including aerospace and automotive, is a primary market impetus. Simultaneously, stringent environmental regulations are actively promoting the adoption of sustainable materials, creating a favorable ecosystem for carbon foam. Furthermore, continuous advancements in manufacturing technologies are leading to improved material properties and a gradual reduction in production costs, further fueling market growth.
Barriers and Challenges: A significant hurdle for market expansion is the comparatively high production cost when juxtaposed with traditional alternative materials. The limited scalability of current manufacturing processes for mass production also presents a considerable challenge in meeting burgeoning demand. Potential disruptions in the supply chain, affecting the availability of critical raw materials, can also pose risks. Moreover, intense competition from established and widely adopted materials necessitates continuous innovation and value proposition articulation for carbon foam to gain wider market penetration.
Emerging Opportunities in Carbon Foam Market
Untapped markets in developing economies present significant opportunities for growth, particularly in the construction and automotive sectors. The increasing adoption of carbon foam in energy-efficient buildings and electric vehicles is creating new demand. Further innovation in material properties, such as enhanced fire resistance and improved electrical conductivity, can unlock new applications in various industries. Exploring new applications in biomedical engineering and water treatment also holds immense potential.
Growth Accelerators in the Carbon Foam Market Industry
Technological breakthroughs in synthesis methods are significantly reducing production costs and improving material properties. Strategic partnerships between material suppliers and end-use manufacturers are driving market penetration in new applications. Expansion into new geographical markets, especially in developing economies, is accelerating market growth. Government incentives and regulations promoting the use of sustainable materials are further driving industry expansion.
Key Players Shaping the Carbon Foam Market Market
- American Elements
- Ultramet
- Entegris Inc
- ERG Aerospace
- CONSOL Energy Inc
- Carbon-Core Corporation
- Xiamen Zopin New Material Limited
- Koppers Inc
- Firefly International Energy
Notable Milestones in Carbon Foam Market Sector
- November 2023: A significant breakthrough was achieved by scientists at the Institute of Catalysts of the Siberian branch of the Russian Academy of Sciences. They successfully developed a method to produce carbon foam from oil refining waste, entirely eliminating the need for traditional foaming agents. This innovative approach promises to substantially reduce production costs and enhance the environmental sustainability of carbon foam manufacturing.
In-Depth Carbon Foam Market Market Outlook
The Carbon Foam market is poised for substantial growth over the forecast period, driven by continuous technological advancements, increasing demand from key end-user industries, and favorable government policies promoting sustainable materials. Strategic partnerships, market expansions, and the exploration of novel applications will further fuel market expansion. The market's future potential is significant, presenting numerous opportunities for both established players and new entrants.
Carbon Foam Market Segmentation
-
1. Type
- 1.1. Graphitic
- 1.2. Non-graphitic
-
2. End-user Industry
- 2.1. Aerospace and Defense
- 2.2. Building and Construction
- 2.3. Automotive
- 2.4. Electrical
- 2.5. Industrial
- 2.6. Other End-user Industries
Carbon Foam Market Segmentation By Geography
-
1. Asia Pacific
- 1.1. China
- 1.2. India
- 1.3. Japan
- 1.4. South Korea
- 1.5. Malaysia
- 1.6. Thailand
- 1.7. Indonesia
- 1.8. Vietnam
- 1.9. Rest of Asia Pacific
-
2. North America
- 2.1. United States
- 2.2. Canada
- 2.3. Mexico
-
3. Europe
- 3.1. Germany
- 3.2. United Kingdom
- 3.3. France
- 3.4. Italy
- 3.5. Spain
- 3.6. Nordic
- 3.7. Turkey
- 3.8. Russia
- 3.9. Rest of Europe
-
4. South America
- 4.1. Brazil
- 4.2. Argentina
- 4.3. Rest of South America
-
5. Middle East and Africa
- 5.1. Saudi Arabia
- 5.2. South Africa
- 5.3. Rest of Middle East and Africa
Carbon Foam Market Regional Market Share
Geographic Coverage of Carbon Foam Market
Carbon Foam Market REPORT HIGHLIGHTS
| Aspects | Details |
|---|---|
| Study Period | 2020-2034 |
| Base Year | 2025 |
| Estimated Year | 2026 |
| Forecast Period | 2026-2034 |
| Historical Period | 2020-2025 |
| Growth Rate | CAGR of 10.73% from 2020-2034 |
| Segmentation |
|
Table of Contents
- 1. Introduction
- 1.1. Research Scope
- 1.2. Market Segmentation
- 1.3. Research Objective
- 1.4. Definitions and Assumptions
- 2. Executive Summary
- 2.1. Market Snapshot
- 3. Market Dynamics
- 3.1. Market Drivers
- 3.2. Market Restrains
- 3.3. Market Trends
- 3.4. Market Opportunities
- 4. Market Factor Analysis
- 4.1. Porters Five Forces
- 4.1.1. Bargaining Power of Suppliers
- 4.1.2. Bargaining Power of Buyers
- 4.1.3. Threat of New Entrants
- 4.1.4. Threat of Substitutes
- 4.1.5. Competitive Rivalry
- 4.2. PESTEL analysis
- 4.3. BCG Analysis
- 4.3.1. Stars (High Growth, High Market Share)
- 4.3.2. Cash Cows (Low Growth, High Market Share)
- 4.3.3. Question Mark (High Growth, Low Market Share)
- 4.3.4. Dogs (Low Growth, Low Market Share)
- 4.4. Ansoff Matrix Analysis
- 4.5. Supply Chain Analysis
- 4.6. Regulatory Landscape
- 4.7. Current Market Potential and Opportunity Assessment (TAM–SAM–SOM Framework)
- 4.8. NRP Analyst Note
- 4.1. Porters Five Forces
- 5. Market Analysis, Insights and Forecast 2021-2033
- 5.1. Market Analysis, Insights and Forecast - by Type
- 5.1.1. Graphitic
- 5.1.2. Non-graphitic
- 5.2. Market Analysis, Insights and Forecast - by End-user Industry
- 5.2.1. Aerospace and Defense
- 5.2.2. Building and Construction
- 5.2.3. Automotive
- 5.2.4. Electrical
- 5.2.5. Industrial
- 5.2.6. Other End-user Industries
- 5.3. Market Analysis, Insights and Forecast - by Region
- 5.3.1. Asia Pacific
- 5.3.2. North America
- 5.3.3. Europe
- 5.3.4. South America
- 5.3.5. Middle East and Africa
- 5.1. Market Analysis, Insights and Forecast - by Type
- 6. Global Carbon Foam Market Analysis, Insights and Forecast, 2021-2033
- 6.1. Market Analysis, Insights and Forecast - by Type
- 6.1.1. Graphitic
- 6.1.2. Non-graphitic
- 6.2. Market Analysis, Insights and Forecast - by End-user Industry
- 6.2.1. Aerospace and Defense
- 6.2.2. Building and Construction
- 6.2.3. Automotive
- 6.2.4. Electrical
- 6.2.5. Industrial
- 6.2.6. Other End-user Industries
- 6.1. Market Analysis, Insights and Forecast - by Type
- 7. Asia Pacific Carbon Foam Market Analysis, Insights and Forecast, 2020-2032
- 7.1. Market Analysis, Insights and Forecast - by Type
- 7.1.1. Graphitic
- 7.1.2. Non-graphitic
- 7.2. Market Analysis, Insights and Forecast - by End-user Industry
- 7.2.1. Aerospace and Defense
- 7.2.2. Building and Construction
- 7.2.3. Automotive
- 7.2.4. Electrical
- 7.2.5. Industrial
- 7.2.6. Other End-user Industries
- 7.1. Market Analysis, Insights and Forecast - by Type
- 8. North America Carbon Foam Market Analysis, Insights and Forecast, 2020-2032
- 8.1. Market Analysis, Insights and Forecast - by Type
- 8.1.1. Graphitic
- 8.1.2. Non-graphitic
- 8.2. Market Analysis, Insights and Forecast - by End-user Industry
- 8.2.1. Aerospace and Defense
- 8.2.2. Building and Construction
- 8.2.3. Automotive
- 8.2.4. Electrical
- 8.2.5. Industrial
- 8.2.6. Other End-user Industries
- 8.1. Market Analysis, Insights and Forecast - by Type
- 9. Europe Carbon Foam Market Analysis, Insights and Forecast, 2020-2032
- 9.1. Market Analysis, Insights and Forecast - by Type
- 9.1.1. Graphitic
- 9.1.2. Non-graphitic
- 9.2. Market Analysis, Insights and Forecast - by End-user Industry
- 9.2.1. Aerospace and Defense
- 9.2.2. Building and Construction
- 9.2.3. Automotive
- 9.2.4. Electrical
- 9.2.5. Industrial
- 9.2.6. Other End-user Industries
- 9.1. Market Analysis, Insights and Forecast - by Type
- 10. South America Carbon Foam Market Analysis, Insights and Forecast, 2020-2032
- 10.1. Market Analysis, Insights and Forecast - by Type
- 10.1.1. Graphitic
- 10.1.2. Non-graphitic
- 10.2. Market Analysis, Insights and Forecast - by End-user Industry
- 10.2.1. Aerospace and Defense
- 10.2.2. Building and Construction
- 10.2.3. Automotive
- 10.2.4. Electrical
- 10.2.5. Industrial
- 10.2.6. Other End-user Industries
- 10.1. Market Analysis, Insights and Forecast - by Type
- 11. Middle East and Africa Carbon Foam Market Analysis, Insights and Forecast, 2020-2032
- 11.1. Market Analysis, Insights and Forecast - by Type
- 11.1.1. Graphitic
- 11.1.2. Non-graphitic
- 11.2. Market Analysis, Insights and Forecast - by End-user Industry
- 11.2.1. Aerospace and Defense
- 11.2.2. Building and Construction
- 11.2.3. Automotive
- 11.2.4. Electrical
- 11.2.5. Industrial
- 11.2.6. Other End-user Industries
- 11.1. Market Analysis, Insights and Forecast - by Type
- 12. Competitive Analysis
- 12.1. Company Profiles
- 12.1.1 American Elements
- 12.1.1.1. Company Overview
- 12.1.1.2. Products
- 12.1.1.3. Company Financials
- 12.1.1.4. SWOT Analysis
- 12.1.2 Ultramet
- 12.1.2.1. Company Overview
- 12.1.2.2. Products
- 12.1.2.3. Company Financials
- 12.1.2.4. SWOT Analysis
- 12.1.3 Entegris Inc
- 12.1.3.1. Company Overview
- 12.1.3.2. Products
- 12.1.3.3. Company Financials
- 12.1.3.4. SWOT Analysis
- 12.1.4 ERG Aerospace
- 12.1.4.1. Company Overview
- 12.1.4.2. Products
- 12.1.4.3. Company Financials
- 12.1.4.4. SWOT Analysis
- 12.1.5 CONSOL Energy Inc
- 12.1.5.1. Company Overview
- 12.1.5.2. Products
- 12.1.5.3. Company Financials
- 12.1.5.4. SWOT Analysis
- 12.1.6 Carbon-Core Corporation
- 12.1.6.1. Company Overview
- 12.1.6.2. Products
- 12.1.6.3. Company Financials
- 12.1.6.4. SWOT Analysis
- 12.1.7 Xiamen Zopin New Material Limited
- 12.1.7.1. Company Overview
- 12.1.7.2. Products
- 12.1.7.3. Company Financials
- 12.1.7.4. SWOT Analysis
- 12.1.8 Koppers Inc
- 12.1.8.1. Company Overview
- 12.1.8.2. Products
- 12.1.8.3. Company Financials
- 12.1.8.4. SWOT Analysis
- 12.1.9 Firefly International Energy
- 12.1.9.1. Company Overview
- 12.1.9.2. Products
- 12.1.9.3. Company Financials
- 12.1.9.4. SWOT Analysis
- 12.1.1 American Elements
- 12.2. Market Entropy
- 12.2.1 Company's Key Areas Served
- 12.2.2 Recent Developments
- 12.3. Company Market Share Analysis 2025
- 12.3.1 Top 5 Companies Market Share Analysis
- 12.3.2 Top 3 Companies Market Share Analysis
- 12.4. List of Potential Customers
- 13. Research Methodology
List of Figures
- Figure 1: Global Carbon Foam Market Revenue Breakdown (Million, %) by Region 2025 & 2033
- Figure 2: Global Carbon Foam Market Volume Breakdown (Square Meters, %) by Region 2025 & 2033
- Figure 3: Asia Pacific Carbon Foam Market Revenue (Million), by Type 2025 & 2033
- Figure 4: Asia Pacific Carbon Foam Market Volume (Square Meters), by Type 2025 & 2033
- Figure 5: Asia Pacific Carbon Foam Market Revenue Share (%), by Type 2025 & 2033
- Figure 6: Asia Pacific Carbon Foam Market Volume Share (%), by Type 2025 & 2033
- Figure 7: Asia Pacific Carbon Foam Market Revenue (Million), by End-user Industry 2025 & 2033
- Figure 8: Asia Pacific Carbon Foam Market Volume (Square Meters), by End-user Industry 2025 & 2033
- Figure 9: Asia Pacific Carbon Foam Market Revenue Share (%), by End-user Industry 2025 & 2033
- Figure 10: Asia Pacific Carbon Foam Market Volume Share (%), by End-user Industry 2025 & 2033
- Figure 11: Asia Pacific Carbon Foam Market Revenue (Million), by Country 2025 & 2033
- Figure 12: Asia Pacific Carbon Foam Market Volume (Square Meters), by Country 2025 & 2033
- Figure 13: Asia Pacific Carbon Foam Market Revenue Share (%), by Country 2025 & 2033
- Figure 14: Asia Pacific Carbon Foam Market Volume Share (%), by Country 2025 & 2033
- Figure 15: North America Carbon Foam Market Revenue (Million), by Type 2025 & 2033
- Figure 16: North America Carbon Foam Market Volume (Square Meters), by Type 2025 & 2033
- Figure 17: North America Carbon Foam Market Revenue Share (%), by Type 2025 & 2033
- Figure 18: North America Carbon Foam Market Volume Share (%), by Type 2025 & 2033
- Figure 19: North America Carbon Foam Market Revenue (Million), by End-user Industry 2025 & 2033
- Figure 20: North America Carbon Foam Market Volume (Square Meters), by End-user Industry 2025 & 2033
- Figure 21: North America Carbon Foam Market Revenue Share (%), by End-user Industry 2025 & 2033
- Figure 22: North America Carbon Foam Market Volume Share (%), by End-user Industry 2025 & 2033
- Figure 23: North America Carbon Foam Market Revenue (Million), by Country 2025 & 2033
- Figure 24: North America Carbon Foam Market Volume (Square Meters), by Country 2025 & 2033
- Figure 25: North America Carbon Foam Market Revenue Share (%), by Country 2025 & 2033
- Figure 26: North America Carbon Foam Market Volume Share (%), by Country 2025 & 2033
- Figure 27: Europe Carbon Foam Market Revenue (Million), by Type 2025 & 2033
- Figure 28: Europe Carbon Foam Market Volume (Square Meters), by Type 2025 & 2033
- Figure 29: Europe Carbon Foam Market Revenue Share (%), by Type 2025 & 2033
- Figure 30: Europe Carbon Foam Market Volume Share (%), by Type 2025 & 2033
- Figure 31: Europe Carbon Foam Market Revenue (Million), by End-user Industry 2025 & 2033
- Figure 32: Europe Carbon Foam Market Volume (Square Meters), by End-user Industry 2025 & 2033
- Figure 33: Europe Carbon Foam Market Revenue Share (%), by End-user Industry 2025 & 2033
- Figure 34: Europe Carbon Foam Market Volume Share (%), by End-user Industry 2025 & 2033
- Figure 35: Europe Carbon Foam Market Revenue (Million), by Country 2025 & 2033
- Figure 36: Europe Carbon Foam Market Volume (Square Meters), by Country 2025 & 2033
- Figure 37: Europe Carbon Foam Market Revenue Share (%), by Country 2025 & 2033
- Figure 38: Europe Carbon Foam Market Volume Share (%), by Country 2025 & 2033
- Figure 39: South America Carbon Foam Market Revenue (Million), by Type 2025 & 2033
- Figure 40: South America Carbon Foam Market Volume (Square Meters), by Type 2025 & 2033
- Figure 41: South America Carbon Foam Market Revenue Share (%), by Type 2025 & 2033
- Figure 42: South America Carbon Foam Market Volume Share (%), by Type 2025 & 2033
- Figure 43: South America Carbon Foam Market Revenue (Million), by End-user Industry 2025 & 2033
- Figure 44: South America Carbon Foam Market Volume (Square Meters), by End-user Industry 2025 & 2033
- Figure 45: South America Carbon Foam Market Revenue Share (%), by End-user Industry 2025 & 2033
- Figure 46: South America Carbon Foam Market Volume Share (%), by End-user Industry 2025 & 2033
- Figure 47: South America Carbon Foam Market Revenue (Million), by Country 2025 & 2033
- Figure 48: South America Carbon Foam Market Volume (Square Meters), by Country 2025 & 2033
- Figure 49: South America Carbon Foam Market Revenue Share (%), by Country 2025 & 2033
- Figure 50: South America Carbon Foam Market Volume Share (%), by Country 2025 & 2033
- Figure 51: Middle East and Africa Carbon Foam Market Revenue (Million), by Type 2025 & 2033
- Figure 52: Middle East and Africa Carbon Foam Market Volume (Square Meters), by Type 2025 & 2033
- Figure 53: Middle East and Africa Carbon Foam Market Revenue Share (%), by Type 2025 & 2033
- Figure 54: Middle East and Africa Carbon Foam Market Volume Share (%), by Type 2025 & 2033
- Figure 55: Middle East and Africa Carbon Foam Market Revenue (Million), by End-user Industry 2025 & 2033
- Figure 56: Middle East and Africa Carbon Foam Market Volume (Square Meters), by End-user Industry 2025 & 2033
- Figure 57: Middle East and Africa Carbon Foam Market Revenue Share (%), by End-user Industry 2025 & 2033
- Figure 58: Middle East and Africa Carbon Foam Market Volume Share (%), by End-user Industry 2025 & 2033
- Figure 59: Middle East and Africa Carbon Foam Market Revenue (Million), by Country 2025 & 2033
- Figure 60: Middle East and Africa Carbon Foam Market Volume (Square Meters), by Country 2025 & 2033
- Figure 61: Middle East and Africa Carbon Foam Market Revenue Share (%), by Country 2025 & 2033
- Figure 62: Middle East and Africa Carbon Foam Market Volume Share (%), by Country 2025 & 2033
List of Tables
- Table 1: Global Carbon Foam Market Revenue Million Forecast, by Type 2020 & 2033
- Table 2: Global Carbon Foam Market Volume Square Meters Forecast, by Type 2020 & 2033
- Table 3: Global Carbon Foam Market Revenue Million Forecast, by End-user Industry 2020 & 2033
- Table 4: Global Carbon Foam Market Volume Square Meters Forecast, by End-user Industry 2020 & 2033
- Table 5: Global Carbon Foam Market Revenue Million Forecast, by Region 2020 & 2033
- Table 6: Global Carbon Foam Market Volume Square Meters Forecast, by Region 2020 & 2033
- Table 7: Global Carbon Foam Market Revenue Million Forecast, by Type 2020 & 2033
- Table 8: Global Carbon Foam Market Volume Square Meters Forecast, by Type 2020 & 2033
- Table 9: Global Carbon Foam Market Revenue Million Forecast, by End-user Industry 2020 & 2033
- Table 10: Global Carbon Foam Market Volume Square Meters Forecast, by End-user Industry 2020 & 2033
- Table 11: Global Carbon Foam Market Revenue Million Forecast, by Country 2020 & 2033
- Table 12: Global Carbon Foam Market Volume Square Meters Forecast, by Country 2020 & 2033
- Table 13: China Carbon Foam Market Revenue (Million) Forecast, by Application 2020 & 2033
- Table 14: China Carbon Foam Market Volume (Square Meters) Forecast, by Application 2020 & 2033
- Table 15: India Carbon Foam Market Revenue (Million) Forecast, by Application 2020 & 2033
- Table 16: India Carbon Foam Market Volume (Square Meters) Forecast, by Application 2020 & 2033
- Table 17: Japan Carbon Foam Market Revenue (Million) Forecast, by Application 2020 & 2033
- Table 18: Japan Carbon Foam Market Volume (Square Meters) Forecast, by Application 2020 & 2033
- Table 19: South Korea Carbon Foam Market Revenue (Million) Forecast, by Application 2020 & 2033
- Table 20: South Korea Carbon Foam Market Volume (Square Meters) Forecast, by Application 2020 & 2033
- Table 21: Malaysia Carbon Foam Market Revenue (Million) Forecast, by Application 2020 & 2033
- Table 22: Malaysia Carbon Foam Market Volume (Square Meters) Forecast, by Application 2020 & 2033
- Table 23: Thailand Carbon Foam Market Revenue (Million) Forecast, by Application 2020 & 2033
- Table 24: Thailand Carbon Foam Market Volume (Square Meters) Forecast, by Application 2020 & 2033
- Table 25: Indonesia Carbon Foam Market Revenue (Million) Forecast, by Application 2020 & 2033
- Table 26: Indonesia Carbon Foam Market Volume (Square Meters) Forecast, by Application 2020 & 2033
- Table 27: Vietnam Carbon Foam Market Revenue (Million) Forecast, by Application 2020 & 2033
- Table 28: Vietnam Carbon Foam Market Volume (Square Meters) Forecast, by Application 2020 & 2033
- Table 29: Rest of Asia Pacific Carbon Foam Market Revenue (Million) Forecast, by Application 2020 & 2033
- Table 30: Rest of Asia Pacific Carbon Foam Market Volume (Square Meters) Forecast, by Application 2020 & 2033
- Table 31: Global Carbon Foam Market Revenue Million Forecast, by Type 2020 & 2033
- Table 32: Global Carbon Foam Market Volume Square Meters Forecast, by Type 2020 & 2033
- Table 33: Global Carbon Foam Market Revenue Million Forecast, by End-user Industry 2020 & 2033
- Table 34: Global Carbon Foam Market Volume Square Meters Forecast, by End-user Industry 2020 & 2033
- Table 35: Global Carbon Foam Market Revenue Million Forecast, by Country 2020 & 2033
- Table 36: Global Carbon Foam Market Volume Square Meters Forecast, by Country 2020 & 2033
- Table 37: United States Carbon Foam Market Revenue (Million) Forecast, by Application 2020 & 2033
- Table 38: United States Carbon Foam Market Volume (Square Meters) Forecast, by Application 2020 & 2033
- Table 39: Canada Carbon Foam Market Revenue (Million) Forecast, by Application 2020 & 2033
- Table 40: Canada Carbon Foam Market Volume (Square Meters) Forecast, by Application 2020 & 2033
- Table 41: Mexico Carbon Foam Market Revenue (Million) Forecast, by Application 2020 & 2033
- Table 42: Mexico Carbon Foam Market Volume (Square Meters) Forecast, by Application 2020 & 2033
- Table 43: Global Carbon Foam Market Revenue Million Forecast, by Type 2020 & 2033
- Table 44: Global Carbon Foam Market Volume Square Meters Forecast, by Type 2020 & 2033
- Table 45: Global Carbon Foam Market Revenue Million Forecast, by End-user Industry 2020 & 2033
- Table 46: Global Carbon Foam Market Volume Square Meters Forecast, by End-user Industry 2020 & 2033
- Table 47: Global Carbon Foam Market Revenue Million Forecast, by Country 2020 & 2033
- Table 48: Global Carbon Foam Market Volume Square Meters Forecast, by Country 2020 & 2033
- Table 49: Germany Carbon Foam Market Revenue (Million) Forecast, by Application 2020 & 2033
- Table 50: Germany Carbon Foam Market Volume (Square Meters) Forecast, by Application 2020 & 2033
- Table 51: United Kingdom Carbon Foam Market Revenue (Million) Forecast, by Application 2020 & 2033
- Table 52: United Kingdom Carbon Foam Market Volume (Square Meters) Forecast, by Application 2020 & 2033
- Table 53: France Carbon Foam Market Revenue (Million) Forecast, by Application 2020 & 2033
- Table 54: France Carbon Foam Market Volume (Square Meters) Forecast, by Application 2020 & 2033
- Table 55: Italy Carbon Foam Market Revenue (Million) Forecast, by Application 2020 & 2033
- Table 56: Italy Carbon Foam Market Volume (Square Meters) Forecast, by Application 2020 & 2033
- Table 57: Spain Carbon Foam Market Revenue (Million) Forecast, by Application 2020 & 2033
- Table 58: Spain Carbon Foam Market Volume (Square Meters) Forecast, by Application 2020 & 2033
- Table 59: Nordic Carbon Foam Market Revenue (Million) Forecast, by Application 2020 & 2033
- Table 60: Nordic Carbon Foam Market Volume (Square Meters) Forecast, by Application 2020 & 2033
- Table 61: Turkey Carbon Foam Market Revenue (Million) Forecast, by Application 2020 & 2033
- Table 62: Turkey Carbon Foam Market Volume (Square Meters) Forecast, by Application 2020 & 2033
- Table 63: Russia Carbon Foam Market Revenue (Million) Forecast, by Application 2020 & 2033
- Table 64: Russia Carbon Foam Market Volume (Square Meters) Forecast, by Application 2020 & 2033
- Table 65: Rest of Europe Carbon Foam Market Revenue (Million) Forecast, by Application 2020 & 2033
- Table 66: Rest of Europe Carbon Foam Market Volume (Square Meters) Forecast, by Application 2020 & 2033
- Table 67: Global Carbon Foam Market Revenue Million Forecast, by Type 2020 & 2033
- Table 68: Global Carbon Foam Market Volume Square Meters Forecast, by Type 2020 & 2033
- Table 69: Global Carbon Foam Market Revenue Million Forecast, by End-user Industry 2020 & 2033
- Table 70: Global Carbon Foam Market Volume Square Meters Forecast, by End-user Industry 2020 & 2033
- Table 71: Global Carbon Foam Market Revenue Million Forecast, by Country 2020 & 2033
- Table 72: Global Carbon Foam Market Volume Square Meters Forecast, by Country 2020 & 2033
- Table 73: Brazil Carbon Foam Market Revenue (Million) Forecast, by Application 2020 & 2033
- Table 74: Brazil Carbon Foam Market Volume (Square Meters) Forecast, by Application 2020 & 2033
- Table 75: Argentina Carbon Foam Market Revenue (Million) Forecast, by Application 2020 & 2033
- Table 76: Argentina Carbon Foam Market Volume (Square Meters) Forecast, by Application 2020 & 2033
- Table 77: Rest of South America Carbon Foam Market Revenue (Million) Forecast, by Application 2020 & 2033
- Table 78: Rest of South America Carbon Foam Market Volume (Square Meters) Forecast, by Application 2020 & 2033
- Table 79: Global Carbon Foam Market Revenue Million Forecast, by Type 2020 & 2033
- Table 80: Global Carbon Foam Market Volume Square Meters Forecast, by Type 2020 & 2033
- Table 81: Global Carbon Foam Market Revenue Million Forecast, by End-user Industry 2020 & 2033
- Table 82: Global Carbon Foam Market Volume Square Meters Forecast, by End-user Industry 2020 & 2033
- Table 83: Global Carbon Foam Market Revenue Million Forecast, by Country 2020 & 2033
- Table 84: Global Carbon Foam Market Volume Square Meters Forecast, by Country 2020 & 2033
- Table 85: Saudi Arabia Carbon Foam Market Revenue (Million) Forecast, by Application 2020 & 2033
- Table 86: Saudi Arabia Carbon Foam Market Volume (Square Meters) Forecast, by Application 2020 & 2033
- Table 87: South Africa Carbon Foam Market Revenue (Million) Forecast, by Application 2020 & 2033
- Table 88: South Africa Carbon Foam Market Volume (Square Meters) Forecast, by Application 2020 & 2033
- Table 89: Rest of Middle East and Africa Carbon Foam Market Revenue (Million) Forecast, by Application 2020 & 2033
- Table 90: Rest of Middle East and Africa Carbon Foam Market Volume (Square Meters) Forecast, by Application 2020 & 2033
Frequently Asked Questions
1. What is the projected Compound Annual Growth Rate (CAGR) of the Carbon Foam Market?
The projected CAGR is approximately 10.73%.
2. Which companies are prominent players in the Carbon Foam Market?
Key companies in the market include American Elements, Ultramet, Entegris Inc, ERG Aerospace, CONSOL Energy Inc, Carbon-Core Corporation, Xiamen Zopin New Material Limited, Koppers Inc, Firefly International Energy.
3. What are the main segments of the Carbon Foam Market?
The market segments include Type, End-user Industry.
4. Can you provide details about the market size?
The market size is estimated to be USD 23.88 Million as of 2022.
5. What are some drivers contributing to market growth?
Increasing Usage in the Aerospace and Defense Industry; Environmental Concerns and a Push for Sustainable Solutions; Others.
6. What are the notable trends driving market growth?
The Usage of Carbon Foam is Increasing in the Aerospace and Defense Industry.
7. Are there any restraints impacting market growth?
The High Cost of the Production Process of Carbon Foam; Others.
8. Can you provide examples of recent developments in the market?
November 2023: Carbon foam was obtained by scientists from the Institute of Catalysts of the Siberian branch of the Russian Academy of Sciences. The raw material for the new material is oil refining waste. The synthesis of this material does not need foaming agents.
9. What pricing options are available for accessing the report?
Pricing options include single-user, multi-user, and enterprise licenses priced at USD 4750, USD 5250, and USD 8750 respectively.
10. Is the market size provided in terms of value or volume?
The market size is provided in terms of value, measured in Million and volume, measured in Square Meters.
11. Are there any specific market keywords associated with the report?
Yes, the market keyword associated with the report is "Carbon Foam Market," which aids in identifying and referencing the specific market segment covered.
12. How do I determine which pricing option suits my needs best?
The pricing options vary based on user requirements and access needs. Individual users may opt for single-user licenses, while businesses requiring broader access may choose multi-user or enterprise licenses for cost-effective access to the report.
13. Are there any additional resources or data provided in the Carbon Foam Market report?
While the report offers comprehensive insights, it's advisable to review the specific contents or supplementary materials provided to ascertain if additional resources or data are available.
14. How can I stay updated on further developments or reports in the Carbon Foam Market?
To stay informed about further developments, trends, and reports in the Carbon Foam Market, consider subscribing to industry newsletters, following relevant companies and organizations, or regularly checking reputable industry news sources and publications.
Methodology
Step 1 - Identification of Relevant Samples Size from Population Database


Step 2 - Approaches for Defining Global Market Size (Value, Volume* & Price*)

Note*: In applicable scenarios
Step 3 - Data Sources
Primary Research
- Web Analytics
- Survey Reports
- Research Institute
- Latest Research Reports
- Opinion Leaders
Secondary Research
- Annual Reports
- White Paper
- Latest Press Release
- Industry Association
- Paid Database
- Investor Presentations

Step 4 - Data Triangulation
Involves using different sources of information in order to increase the validity of a study
These sources are likely to be stakeholders in a program - participants, other researchers, program staff, other community members, and so on.
Then we put all data in single framework & apply various statistical tools to find out the dynamic on the market.
During the analysis stage, feedback from the stakeholder groups would be compared to determine areas of agreement as well as areas of divergence