

Key Insights
The global catalyst regeneration market is poised for substantial growth, driven by escalating demand from the refining and petrochemical sectors and increasingly stringent environmental regulations promoting sustainable industrial practices. This expansion is primarily attributed to the rising need for cost-effective catalyst rejuvenation, a more economical alternative to complete catalyst replacement. Advancements in in-situ regeneration technologies, enhancing operational efficiency and minimizing downtime, are further accelerating market development. The Asia-Pacific region, led by China and India, is anticipated to lead market share due to significant investments in its refining and petrochemical infrastructure. Mature markets in North America and Europe remain crucial contributors, emphasizing environmental compliance and energy efficiency improvements. The market is segmented by regeneration method (ex-situ and in-situ) and application (refineries, environmental, energy & power, and others), with in-situ regeneration gaining significant traction due to its operational advantages. Key industry players such as Axens, BASF SE, and Evonik Industries AG are spearheading innovation and market consolidation through technological advancements and strategic collaborations. However, market growth faces constraints including high initial investment for regeneration technologies and potential risks associated with handling spent catalysts. Projected with a CAGR of 4.3%, and a 2025 market size of $43.6 billion, the market is forecast to achieve considerable value by 2033.
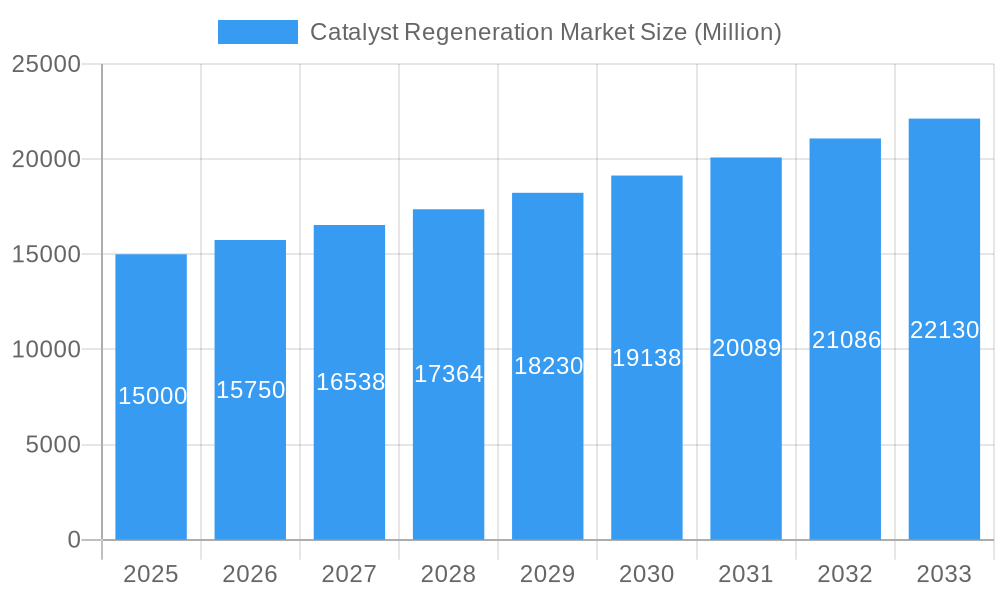
Catalyst Regeneration Market Market Size (In Billion)
The forecast period of 2025 to 2033 presents considerable opportunities for market stakeholders. Industry participants are concentrating on developing advanced regeneration technologies that boost efficiency, lessen environmental impact, and deliver cost-effective solutions. The growing emphasis on circular economy principles is also a key driver, as catalyst regeneration perfectly embodies waste minimization and resource maximization. The market is expected to see an increase in mergers and acquisitions as major companies aim to broaden their market presence and technological capabilities. Future expansion will be contingent upon technological innovation, governmental environmental protection regulations, and global investments in refining and petrochemical capacities. Regional growth variances will be shaped by local regulations, economic conditions, and the pace of industrial expansion in critical sectors.
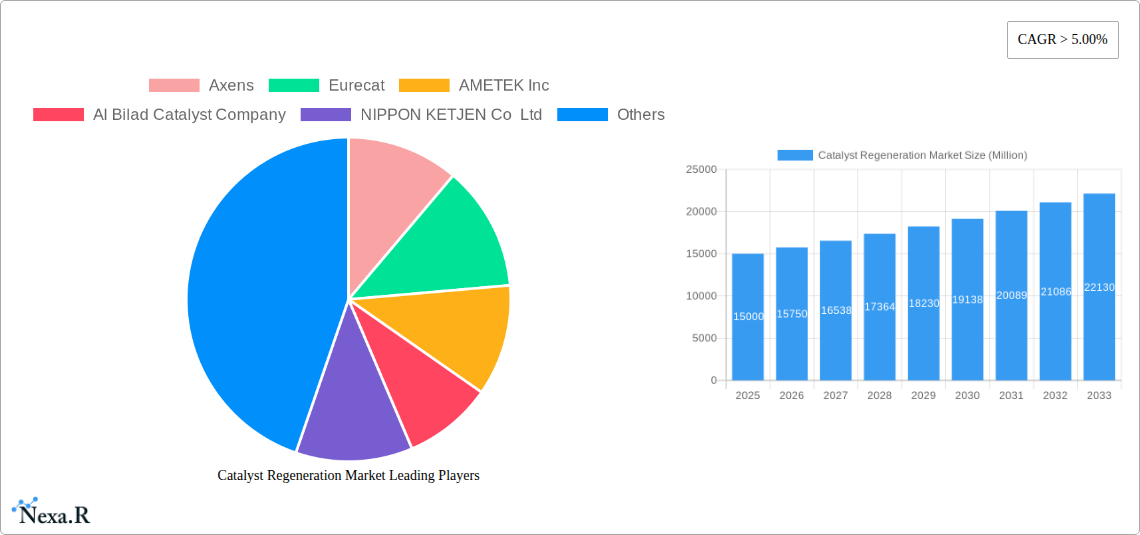
Catalyst Regeneration Market Company Market Share
Catalyst Regeneration Market: A Comprehensive Market Report (2019-2033)
This comprehensive report provides an in-depth analysis of the Catalyst Regeneration Market, encompassing market dynamics, growth trends, regional segmentation, product landscape, and key players. The study covers the period from 2019 to 2033, with 2025 serving as the base and estimated year. The report meticulously examines the parent market (Catalyst Market) and its child market (Catalyst Regeneration) to offer a holistic view of this dynamic industry. The market size is projected to reach xx Million by 2033.
Catalyst Regeneration Market Dynamics & Structure
The Catalyst Regeneration Market is characterized by a moderately concentrated landscape, with key players holding significant market share. The market's growth is primarily driven by technological advancements in catalyst regeneration techniques, stringent environmental regulations promoting sustainable practices, and the increasing demand for efficient and cost-effective catalyst reuse across various industries. However, high capital investment requirements and the complexity of regeneration processes present significant barriers to entry. Mergers and acquisitions (M&A) activity has been relatively moderate, with a focus on expanding capacity and technological capabilities.
- Market Concentration: Moderately concentrated, with top 5 players holding approximately xx% market share (2024).
- Technological Innovation: Significant advancements in techniques like ex-situ and in-situ regeneration, driving efficiency gains.
- Regulatory Landscape: Stringent environmental regulations are fueling the demand for catalyst regeneration.
- Competitive Substitutes: Limited direct substitutes, but alternative catalyst materials pose indirect competition.
- End-User Demographics: Refineries and petrochemical complexes are major consumers, followed by environmental and energy sectors.
- M&A Activity: Moderate activity, focused primarily on capacity expansion and technology acquisition (e.g., BASF's acquisition of Zodiac Enterprises in 2021). Approximately xx M&A deals occurred between 2019-2024.
Catalyst Regeneration Market Growth Trends & Insights
The Catalyst Regeneration Market experienced steady growth during the historical period (2019-2024), with a CAGR of xx%. This growth is primarily attributed to the increasing demand for catalysts across various industries, coupled with the rising awareness of the environmental and economic benefits of catalyst regeneration. The forecast period (2025-2033) projects continued growth, driven by technological advancements, expanding applications, and supportive government policies. Market penetration in key segments like refineries and petrochemical complexes is expected to increase significantly, reaching xx% by 2033. The adoption of advanced regeneration technologies is further expected to accelerate market growth, while consumer behavior shifts towards sustainability are also contributing factors. The market size is projected to reach xx Million by 2033, with a CAGR of xx% during the forecast period.
Dominant Regions, Countries, or Segments in Catalyst Regeneration Market
North America currently holds the largest market share in the Catalyst Regeneration Market, followed by Europe and Asia-Pacific. This dominance is driven by factors such as the high concentration of refineries and petrochemical complexes, robust environmental regulations, and significant investments in research and development. Within application segments, Refineries and Petrochemical Complexes dominate, accounting for approximately xx% of the market. The Ex-situ method holds a larger market share compared to In-situ, owing to its adaptability to a wider range of catalysts and processing capabilities.
- North America: High concentration of refineries and strong environmental regulations.
- Europe: Significant investments in sustainable technologies and stringent emission standards.
- Asia-Pacific: Rapid industrialization and growing demand for energy-efficient solutions.
- Refineries & Petrochemical Complexes: Largest application segment due to high catalyst consumption.
- Ex-situ Method: Dominates the method segment due to scalability and adaptability.
Catalyst Regeneration Market Product Landscape
The Catalyst Regeneration Market offers a range of services and technologies, including ex-situ and in-situ regeneration methods. Innovations focus on enhancing efficiency, reducing energy consumption, and improving the quality of regenerated catalysts. Key performance metrics include regeneration yield, catalyst activity recovery, and overall cost-effectiveness. Unique selling propositions center around proprietary regeneration technologies, rapid turnaround times, and environmentally friendly processes. Technological advancements are focused on automation, process optimization, and the development of sustainable regeneration solutions.
Key Drivers, Barriers & Challenges in Catalyst Regeneration Market
Key Drivers:
- Increasing demand for catalyst reuse driven by economic and environmental concerns.
- Stringent environmental regulations promoting sustainable practices.
- Technological advancements leading to improved efficiency and cost-effectiveness of regeneration processes.
Key Challenges & Restraints:
- High capital expenditure requirements for setting up regeneration facilities.
- Complexity of regeneration processes for specific catalyst types.
- Limited availability of skilled personnel experienced in catalyst regeneration technologies. This results in approximately xx% of projects facing delays due to skilled labor shortages.
Emerging Opportunities in Catalyst Regeneration Market
Emerging opportunities lie in expanding into untapped markets, particularly in developing economies experiencing rapid industrialization. Innovative applications in emerging fields like renewable energy and green chemistry are also promising avenues. Furthermore, evolving consumer preferences towards sustainable and environmentally responsible practices present a significant opportunity for growth. Developing specialized regeneration solutions for niche catalyst types and integrating advanced automation and digital technologies to enhance efficiency are key areas for exploration.
Growth Accelerators in the Catalyst Regeneration Market Industry
Technological breakthroughs, such as the development of advanced regeneration techniques, are crucial growth accelerators. Strategic partnerships between catalyst manufacturers and regeneration service providers are also driving market expansion. Furthermore, government policies promoting sustainable industrial practices and investments in research and development are fostering market growth. The expansion into new geographical markets and the development of customized regeneration solutions for specific industries are also contributing to accelerating growth.
Key Players Shaping the Catalyst Regeneration Market Market
- Axens
- Eurecat
- AMETEK Inc
- Al Bilad Catalyst Company
- NIPPON KETJEN Co Ltd
- Advanced Catalyst Systems LLC
- Yokogawa Corporation of America
- CORMETECH
- BASF SE
- Zibo Hengji chemical Co Ltd
- EBINGER Katalysatorservice GmbH & Co KG
- Evonik Industries AG (Porocel) *List Not Exhaustive
Notable Milestones in Catalyst Regeneration Market Sector
- July 2021: BASF expands its chemical catalyst recycling capacity and capability with the acquisition of Zodiac Enterprises LLC.
In-Depth Catalyst Regeneration Market Market Outlook
The Catalyst Regeneration Market exhibits significant future potential, driven by increasing environmental concerns, technological advancements, and supportive government policies. Strategic opportunities lie in developing innovative regeneration technologies, expanding into new applications and geographical markets, and establishing strategic partnerships to enhance market reach and technological capabilities. Focusing on sustainable and cost-effective solutions will be crucial for capturing a larger market share in the coming years.
Catalyst Regeneration Market Segmentation
-
1. Method
- 1.1. Ex Situ
- 1.2. In Situ
-
2. Application
- 2.1. Refineries and Petrochemical Complexes
- 2.2. Environmental
- 2.3. Energy & Power
- 2.4. Other Applications
Catalyst Regeneration Market Segmentation By Geography
-
1. Asia Pacific
- 1.1. China
- 1.2. India
- 1.3. Japan
- 1.4. South Korea
- 1.5. ASEAN Countries
- 1.6. Rest of Asia Pacific
-
2. North America
- 2.1. United States
- 2.2. Canada
- 2.3. Mexico
-
3. Europe
- 3.1. Germany
- 3.2. United Kingdom
- 3.3. France
- 3.4. Italy
- 3.5. Russia
- 3.6. Rest of Europe
-
4. South America
- 4.1. Brazil
- 4.2. Argentina
- 4.3. Rest of South America
-
5. Middle East and Africa
- 5.1. Saudi Arabia
- 5.2. South Africa
- 5.3. Rest of Middle East and Africa
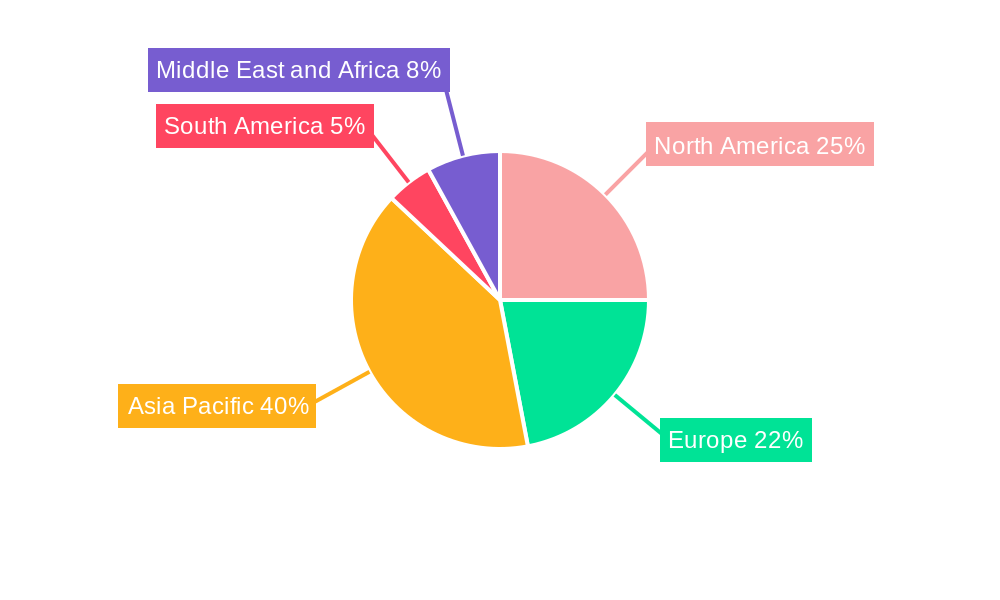
Catalyst Regeneration Market Regional Market Share
Geographic Coverage of Catalyst Regeneration Market
Catalyst Regeneration Market REPORT HIGHLIGHTS
| Aspects | Details |
|---|---|
| Study Period | 2020-2034 |
| Base Year | 2025 |
| Estimated Year | 2026 |
| Forecast Period | 2026-2034 |
| Historical Period | 2020-2025 |
| Growth Rate | CAGR of 4.3% from 2020-2034 |
| Segmentation |
|
Table of Contents
- 1. Introduction
- 1.1. Research Scope
- 1.2. Market Segmentation
- 1.3. Research Objective
- 1.4. Definitions and Assumptions
- 2. Executive Summary
- 2.1. Market Snapshot
- 3. Market Dynamics
- 3.1. Market Drivers
- 3.2. Market Restrains
- 3.3. Market Trends
- 3.4. Market Opportunities
- 4. Market Factor Analysis
- 4.1. Porters Five Forces
- 4.1.1. Bargaining Power of Suppliers
- 4.1.2. Bargaining Power of Buyers
- 4.1.3. Threat of New Entrants
- 4.1.4. Threat of Substitutes
- 4.1.5. Competitive Rivalry
- 4.2. PESTEL analysis
- 4.3. BCG Analysis
- 4.3.1. Stars (High Growth, High Market Share)
- 4.3.2. Cash Cows (Low Growth, High Market Share)
- 4.3.3. Question Mark (High Growth, Low Market Share)
- 4.3.4. Dogs (Low Growth, Low Market Share)
- 4.4. Ansoff Matrix Analysis
- 4.5. Supply Chain Analysis
- 4.6. Regulatory Landscape
- 4.7. Current Market Potential and Opportunity Assessment (TAM–SAM–SOM Framework)
- 4.8. NRP Analyst Note
- 4.1. Porters Five Forces
- 5. Market Analysis, Insights and Forecast 2021-2033
- 5.1. Market Analysis, Insights and Forecast - by Method
- 5.1.1. Ex Situ
- 5.1.2. In Situ
- 5.2. Market Analysis, Insights and Forecast - by Application
- 5.2.1. Refineries and Petrochemical Complexes
- 5.2.2. Environmental
- 5.2.3. Energy & Power
- 5.2.4. Other Applications
- 5.3. Market Analysis, Insights and Forecast - by Region
- 5.3.1. Asia Pacific
- 5.3.2. North America
- 5.3.3. Europe
- 5.3.4. South America
- 5.3.5. Middle East and Africa
- 5.1. Market Analysis, Insights and Forecast - by Method
- 6. Global Catalyst Regeneration Market Analysis, Insights and Forecast, 2021-2033
- 6.1. Market Analysis, Insights and Forecast - by Method
- 6.1.1. Ex Situ
- 6.1.2. In Situ
- 6.2. Market Analysis, Insights and Forecast - by Application
- 6.2.1. Refineries and Petrochemical Complexes
- 6.2.2. Environmental
- 6.2.3. Energy & Power
- 6.2.4. Other Applications
- 6.1. Market Analysis, Insights and Forecast - by Method
- 7. Asia Pacific Catalyst Regeneration Market Analysis, Insights and Forecast, 2020-2032
- 7.1. Market Analysis, Insights and Forecast - by Method
- 7.1.1. Ex Situ
- 7.1.2. In Situ
- 7.2. Market Analysis, Insights and Forecast - by Application
- 7.2.1. Refineries and Petrochemical Complexes
- 7.2.2. Environmental
- 7.2.3. Energy & Power
- 7.2.4. Other Applications
- 7.1. Market Analysis, Insights and Forecast - by Method
- 8. North America Catalyst Regeneration Market Analysis, Insights and Forecast, 2020-2032
- 8.1. Market Analysis, Insights and Forecast - by Method
- 8.1.1. Ex Situ
- 8.1.2. In Situ
- 8.2. Market Analysis, Insights and Forecast - by Application
- 8.2.1. Refineries and Petrochemical Complexes
- 8.2.2. Environmental
- 8.2.3. Energy & Power
- 8.2.4. Other Applications
- 8.1. Market Analysis, Insights and Forecast - by Method
- 9. Europe Catalyst Regeneration Market Analysis, Insights and Forecast, 2020-2032
- 9.1. Market Analysis, Insights and Forecast - by Method
- 9.1.1. Ex Situ
- 9.1.2. In Situ
- 9.2. Market Analysis, Insights and Forecast - by Application
- 9.2.1. Refineries and Petrochemical Complexes
- 9.2.2. Environmental
- 9.2.3. Energy & Power
- 9.2.4. Other Applications
- 9.1. Market Analysis, Insights and Forecast - by Method
- 10. South America Catalyst Regeneration Market Analysis, Insights and Forecast, 2020-2032
- 10.1. Market Analysis, Insights and Forecast - by Method
- 10.1.1. Ex Situ
- 10.1.2. In Situ
- 10.2. Market Analysis, Insights and Forecast - by Application
- 10.2.1. Refineries and Petrochemical Complexes
- 10.2.2. Environmental
- 10.2.3. Energy & Power
- 10.2.4. Other Applications
- 10.1. Market Analysis, Insights and Forecast - by Method
- 11. Middle East and Africa Catalyst Regeneration Market Analysis, Insights and Forecast, 2020-2032
- 11.1. Market Analysis, Insights and Forecast - by Method
- 11.1.1. Ex Situ
- 11.1.2. In Situ
- 11.2. Market Analysis, Insights and Forecast - by Application
- 11.2.1. Refineries and Petrochemical Complexes
- 11.2.2. Environmental
- 11.2.3. Energy & Power
- 11.2.4. Other Applications
- 11.1. Market Analysis, Insights and Forecast - by Method
- 12. Competitive Analysis
- 12.1. Company Profiles
- 12.1.1 Axens
- 12.1.1.1. Company Overview
- 12.1.1.2. Products
- 12.1.1.3. Company Financials
- 12.1.1.4. SWOT Analysis
- 12.1.2 Eurecat
- 12.1.2.1. Company Overview
- 12.1.2.2. Products
- 12.1.2.3. Company Financials
- 12.1.2.4. SWOT Analysis
- 12.1.3 AMETEK Inc
- 12.1.3.1. Company Overview
- 12.1.3.2. Products
- 12.1.3.3. Company Financials
- 12.1.3.4. SWOT Analysis
- 12.1.4 Al Bilad Catalyst Company
- 12.1.4.1. Company Overview
- 12.1.4.2. Products
- 12.1.4.3. Company Financials
- 12.1.4.4. SWOT Analysis
- 12.1.5 NIPPON KETJEN Co Ltd
- 12.1.5.1. Company Overview
- 12.1.5.2. Products
- 12.1.5.3. Company Financials
- 12.1.5.4. SWOT Analysis
- 12.1.6 Advanced Catalyst Systems LLC
- 12.1.6.1. Company Overview
- 12.1.6.2. Products
- 12.1.6.3. Company Financials
- 12.1.6.4. SWOT Analysis
- 12.1.7 Yokogawa Corporation of America
- 12.1.7.1. Company Overview
- 12.1.7.2. Products
- 12.1.7.3. Company Financials
- 12.1.7.4. SWOT Analysis
- 12.1.8 CORMETECH
- 12.1.8.1. Company Overview
- 12.1.8.2. Products
- 12.1.8.3. Company Financials
- 12.1.8.4. SWOT Analysis
- 12.1.9 BASF SE
- 12.1.9.1. Company Overview
- 12.1.9.2. Products
- 12.1.9.3. Company Financials
- 12.1.9.4. SWOT Analysis
- 12.1.10 Zibo Hengji chemical Co Ltd *List Not Exhaustive
- 12.1.10.1. Company Overview
- 12.1.10.2. Products
- 12.1.10.3. Company Financials
- 12.1.10.4. SWOT Analysis
- 12.1.11 EBINGER Katalysatorservice GmbH & Co KG
- 12.1.11.1. Company Overview
- 12.1.11.2. Products
- 12.1.11.3. Company Financials
- 12.1.11.4. SWOT Analysis
- 12.1.12 Evonik Industries AG (Porocel)
- 12.1.12.1. Company Overview
- 12.1.12.2. Products
- 12.1.12.3. Company Financials
- 12.1.12.4. SWOT Analysis
- 12.1.1 Axens
- 12.2. Market Entropy
- 12.2.1 Company's Key Areas Served
- 12.2.2 Recent Developments
- 12.3. Company Market Share Analysis 2025
- 12.3.1 Top 5 Companies Market Share Analysis
- 12.3.2 Top 3 Companies Market Share Analysis
- 12.4. List of Potential Customers
- 13. Research Methodology
List of Figures
- Figure 1: Global Catalyst Regeneration Market Revenue Breakdown (billion, %) by Region 2025 & 2033
- Figure 2: Asia Pacific Catalyst Regeneration Market Revenue (billion), by Method 2025 & 2033
- Figure 3: Asia Pacific Catalyst Regeneration Market Revenue Share (%), by Method 2025 & 2033
- Figure 4: Asia Pacific Catalyst Regeneration Market Revenue (billion), by Application 2025 & 2033
- Figure 5: Asia Pacific Catalyst Regeneration Market Revenue Share (%), by Application 2025 & 2033
- Figure 6: Asia Pacific Catalyst Regeneration Market Revenue (billion), by Country 2025 & 2033
- Figure 7: Asia Pacific Catalyst Regeneration Market Revenue Share (%), by Country 2025 & 2033
- Figure 8: North America Catalyst Regeneration Market Revenue (billion), by Method 2025 & 2033
- Figure 9: North America Catalyst Regeneration Market Revenue Share (%), by Method 2025 & 2033
- Figure 10: North America Catalyst Regeneration Market Revenue (billion), by Application 2025 & 2033
- Figure 11: North America Catalyst Regeneration Market Revenue Share (%), by Application 2025 & 2033
- Figure 12: North America Catalyst Regeneration Market Revenue (billion), by Country 2025 & 2033
- Figure 13: North America Catalyst Regeneration Market Revenue Share (%), by Country 2025 & 2033
- Figure 14: Europe Catalyst Regeneration Market Revenue (billion), by Method 2025 & 2033
- Figure 15: Europe Catalyst Regeneration Market Revenue Share (%), by Method 2025 & 2033
- Figure 16: Europe Catalyst Regeneration Market Revenue (billion), by Application 2025 & 2033
- Figure 17: Europe Catalyst Regeneration Market Revenue Share (%), by Application 2025 & 2033
- Figure 18: Europe Catalyst Regeneration Market Revenue (billion), by Country 2025 & 2033
- Figure 19: Europe Catalyst Regeneration Market Revenue Share (%), by Country 2025 & 2033
- Figure 20: South America Catalyst Regeneration Market Revenue (billion), by Method 2025 & 2033
- Figure 21: South America Catalyst Regeneration Market Revenue Share (%), by Method 2025 & 2033
- Figure 22: South America Catalyst Regeneration Market Revenue (billion), by Application 2025 & 2033
- Figure 23: South America Catalyst Regeneration Market Revenue Share (%), by Application 2025 & 2033
- Figure 24: South America Catalyst Regeneration Market Revenue (billion), by Country 2025 & 2033
- Figure 25: South America Catalyst Regeneration Market Revenue Share (%), by Country 2025 & 2033
- Figure 26: Middle East and Africa Catalyst Regeneration Market Revenue (billion), by Method 2025 & 2033
- Figure 27: Middle East and Africa Catalyst Regeneration Market Revenue Share (%), by Method 2025 & 2033
- Figure 28: Middle East and Africa Catalyst Regeneration Market Revenue (billion), by Application 2025 & 2033
- Figure 29: Middle East and Africa Catalyst Regeneration Market Revenue Share (%), by Application 2025 & 2033
- Figure 30: Middle East and Africa Catalyst Regeneration Market Revenue (billion), by Country 2025 & 2033
- Figure 31: Middle East and Africa Catalyst Regeneration Market Revenue Share (%), by Country 2025 & 2033
List of Tables
- Table 1: Global Catalyst Regeneration Market Revenue billion Forecast, by Method 2020 & 2033
- Table 2: Global Catalyst Regeneration Market Revenue billion Forecast, by Application 2020 & 2033
- Table 3: Global Catalyst Regeneration Market Revenue billion Forecast, by Region 2020 & 2033
- Table 4: Global Catalyst Regeneration Market Revenue billion Forecast, by Method 2020 & 2033
- Table 5: Global Catalyst Regeneration Market Revenue billion Forecast, by Application 2020 & 2033
- Table 6: Global Catalyst Regeneration Market Revenue billion Forecast, by Country 2020 & 2033
- Table 7: China Catalyst Regeneration Market Revenue (billion) Forecast, by Application 2020 & 2033
- Table 8: India Catalyst Regeneration Market Revenue (billion) Forecast, by Application 2020 & 2033
- Table 9: Japan Catalyst Regeneration Market Revenue (billion) Forecast, by Application 2020 & 2033
- Table 10: South Korea Catalyst Regeneration Market Revenue (billion) Forecast, by Application 2020 & 2033
- Table 11: ASEAN Countries Catalyst Regeneration Market Revenue (billion) Forecast, by Application 2020 & 2033
- Table 12: Rest of Asia Pacific Catalyst Regeneration Market Revenue (billion) Forecast, by Application 2020 & 2033
- Table 13: Global Catalyst Regeneration Market Revenue billion Forecast, by Method 2020 & 2033
- Table 14: Global Catalyst Regeneration Market Revenue billion Forecast, by Application 2020 & 2033
- Table 15: Global Catalyst Regeneration Market Revenue billion Forecast, by Country 2020 & 2033
- Table 16: United States Catalyst Regeneration Market Revenue (billion) Forecast, by Application 2020 & 2033
- Table 17: Canada Catalyst Regeneration Market Revenue (billion) Forecast, by Application 2020 & 2033
- Table 18: Mexico Catalyst Regeneration Market Revenue (billion) Forecast, by Application 2020 & 2033
- Table 19: Global Catalyst Regeneration Market Revenue billion Forecast, by Method 2020 & 2033
- Table 20: Global Catalyst Regeneration Market Revenue billion Forecast, by Application 2020 & 2033
- Table 21: Global Catalyst Regeneration Market Revenue billion Forecast, by Country 2020 & 2033
- Table 22: Germany Catalyst Regeneration Market Revenue (billion) Forecast, by Application 2020 & 2033
- Table 23: United Kingdom Catalyst Regeneration Market Revenue (billion) Forecast, by Application 2020 & 2033
- Table 24: France Catalyst Regeneration Market Revenue (billion) Forecast, by Application 2020 & 2033
- Table 25: Italy Catalyst Regeneration Market Revenue (billion) Forecast, by Application 2020 & 2033
- Table 26: Russia Catalyst Regeneration Market Revenue (billion) Forecast, by Application 2020 & 2033
- Table 27: Rest of Europe Catalyst Regeneration Market Revenue (billion) Forecast, by Application 2020 & 2033
- Table 28: Global Catalyst Regeneration Market Revenue billion Forecast, by Method 2020 & 2033
- Table 29: Global Catalyst Regeneration Market Revenue billion Forecast, by Application 2020 & 2033
- Table 30: Global Catalyst Regeneration Market Revenue billion Forecast, by Country 2020 & 2033
- Table 31: Brazil Catalyst Regeneration Market Revenue (billion) Forecast, by Application 2020 & 2033
- Table 32: Argentina Catalyst Regeneration Market Revenue (billion) Forecast, by Application 2020 & 2033
- Table 33: Rest of South America Catalyst Regeneration Market Revenue (billion) Forecast, by Application 2020 & 2033
- Table 34: Global Catalyst Regeneration Market Revenue billion Forecast, by Method 2020 & 2033
- Table 35: Global Catalyst Regeneration Market Revenue billion Forecast, by Application 2020 & 2033
- Table 36: Global Catalyst Regeneration Market Revenue billion Forecast, by Country 2020 & 2033
- Table 37: Saudi Arabia Catalyst Regeneration Market Revenue (billion) Forecast, by Application 2020 & 2033
- Table 38: South Africa Catalyst Regeneration Market Revenue (billion) Forecast, by Application 2020 & 2033
- Table 39: Rest of Middle East and Africa Catalyst Regeneration Market Revenue (billion) Forecast, by Application 2020 & 2033
Frequently Asked Questions
1. What is the projected Compound Annual Growth Rate (CAGR) of the Catalyst Regeneration Market?
The projected CAGR is approximately 4.3%.
2. Which companies are prominent players in the Catalyst Regeneration Market?
Key companies in the market include Axens, Eurecat, AMETEK Inc, Al Bilad Catalyst Company, NIPPON KETJEN Co Ltd, Advanced Catalyst Systems LLC, Yokogawa Corporation of America, CORMETECH, BASF SE, Zibo Hengji chemical Co Ltd *List Not Exhaustive, EBINGER Katalysatorservice GmbH & Co KG, Evonik Industries AG (Porocel).
3. What are the main segments of the Catalyst Regeneration Market?
The market segments include Method, Application.
4. Can you provide details about the market size?
The market size is estimated to be USD 43.6 billion as of 2022.
5. What are some drivers contributing to market growth?
High Cost of New Catalyst and Regulations Related to the Disposal of Spent Catalyst; Other Drivers.
6. What are the notable trends driving market growth?
Refineries and Petrochemical Complexes Segment to Dominate the Market.
7. Are there any restraints impacting market growth?
Impact of COVID-19 Pandemic; Other Restraints.
8. Can you provide examples of recent developments in the market?
In July 2021, BASF has expanded its chemical catalyst recycling capacity and capability with the acquisition of Zodiac Enterprises LLC in Caldwell, Texas.
9. What pricing options are available for accessing the report?
Pricing options include single-user, multi-user, and enterprise licenses priced at USD 4750, USD 5250, and USD 8750 respectively.
10. Is the market size provided in terms of value or volume?
The market size is provided in terms of value, measured in billion.
11. Are there any specific market keywords associated with the report?
Yes, the market keyword associated with the report is "Catalyst Regeneration Market," which aids in identifying and referencing the specific market segment covered.
12. How do I determine which pricing option suits my needs best?
The pricing options vary based on user requirements and access needs. Individual users may opt for single-user licenses, while businesses requiring broader access may choose multi-user or enterprise licenses for cost-effective access to the report.
13. Are there any additional resources or data provided in the Catalyst Regeneration Market report?
While the report offers comprehensive insights, it's advisable to review the specific contents or supplementary materials provided to ascertain if additional resources or data are available.
14. How can I stay updated on further developments or reports in the Catalyst Regeneration Market?
To stay informed about further developments, trends, and reports in the Catalyst Regeneration Market, consider subscribing to industry newsletters, following relevant companies and organizations, or regularly checking reputable industry news sources and publications.
Methodology
Step 1 - Identification of Relevant Samples Size from Population Database


Step 2 - Approaches for Defining Global Market Size (Value, Volume* & Price*)

Note*: In applicable scenarios
Step 3 - Data Sources
Primary Research
- Web Analytics
- Survey Reports
- Research Institute
- Latest Research Reports
- Opinion Leaders
Secondary Research
- Annual Reports
- White Paper
- Latest Press Release
- Industry Association
- Paid Database
- Investor Presentations

Step 4 - Data Triangulation
Involves using different sources of information in order to increase the validity of a study
These sources are likely to be stakeholders in a program - participants, other researchers, program staff, other community members, and so on.
Then we put all data in single framework & apply various statistical tools to find out the dynamic on the market.
During the analysis stage, feedback from the stakeholder groups would be compared to determine areas of agreement as well as areas of divergence