

Key Insights
The global caviar market, valued at $372.99 million in 2025, is projected to experience robust growth, driven by rising disposable incomes in key regions and increasing demand for luxury food products. The market's Compound Annual Growth Rate (CAGR) of 7.96% from 2025 to 2033 indicates a significant expansion opportunity. Premium caviar types like Beluga and Osetra are expected to maintain their dominance, though the increasing popularity of sustainable and ethically sourced caviar is driving growth in other varieties like Sevruga and Sterlet. The on-trade channel (restaurants, hotels) currently holds a larger market share but the off-trade channel (retail, online sales) is witnessing accelerated growth, propelled by the rise of e-commerce platforms and direct-to-consumer sales strategies. Geographic distribution shows strong demand from North America and Europe, with Asia-Pacific emerging as a promising growth region due to increasing affluence and awareness of luxury culinary experiences. Challenges include stringent regulations surrounding caviar production and trade, as well as fluctuations in supply due to environmental factors affecting sturgeon populations. Companies are responding by investing in sustainable aquaculture practices and focusing on branding and premiumization strategies to cater to discerning consumers.
The market segmentation reveals a varied landscape. While fresh caviar maintains the highest market share, frozen and dried caviar are witnessing significant growth due to improved preservation techniques and extended shelf life. Key players like JSC Russian Caviar House, Sterling Caviar, and others are focused on expanding their product portfolios, strengthening supply chains, and enhancing distribution networks to capture growing market share. The rising popularity of caviar as a luxury ingredient in gourmet cuisine and its use in high-end catering and events also significantly influence market growth. The projected growth trajectory suggests a considerable increase in market value by 2033, exceeding $700 million, signifying a lucrative opportunity for both established players and new entrants focusing on innovation, sustainability, and premiumization.

Caviar Industry Market Report: 2019-2033
This comprehensive report provides an in-depth analysis of the global caviar industry, encompassing market dynamics, growth trends, regional performance, and key players. Covering the period from 2019 to 2033, with a base year of 2025 and a forecast period of 2025-2033, this report is essential for industry professionals, investors, and anyone seeking to understand this luxury food market. The report segments the market by type (Sevruga, Osetra, Beluga, Sterlet, Other Types), form (Fresh, Dried, Frozen), and sales channel (On-Trade, Off-Trade). Market values are presented in million units.
Caviar Industry Market Dynamics & Structure
This section analyzes the competitive landscape of the caviar industry, examining market concentration, technological innovation, regulatory factors, substitute products, consumer demographics, and mergers and acquisitions (M&A) activity. The global caviar market, valued at xx million in 2025, is characterized by a moderately concentrated structure with a few dominant players controlling a significant market share. The industry is driven by technological advancements in caviar farming and processing, which aim to improve efficiency and quality. Stringent regulations governing sustainable harvesting and production pose challenges but also guarantee product quality and environmental preservation.
- Market Concentration: The top 5 players account for approximately xx% of the global market share in 2025.
- Technological Innovation: Focus on sustainable aquaculture and improved processing techniques is increasing.
- Regulatory Framework: Strict regulations on wild caviar harvesting and sustainable farming practices impact market dynamics.
- Competitive Substitutes: Imitation caviar and other luxury seafood present competitive pressures.
- End-User Demographics: High-income consumers and luxury food enthusiasts are the primary target market.
- M&A Trends: Consolidation activity is expected to increase, leading to further market concentration (xx M&A deals projected between 2025 and 2033).
Caviar Industry Growth Trends & Insights
The global caviar market exhibits a steady growth trajectory, driven by increasing consumer demand, particularly in emerging markets. The historical period (2019-2024) witnessed a compound annual growth rate (CAGR) of xx%, while the forecast period (2025-2033) is projected to show a CAGR of xx%. This growth is attributed to several factors, including rising disposable incomes, increasing awareness of caviar's health benefits, and the expanding availability of sustainably produced caviar. Technological advancements in aquaculture and processing are significantly contributing to increased production and reduced costs. Changing consumer preferences towards more sustainable and ethically sourced products also drive demand. Market penetration is expected to increase steadily, particularly in Asia and the Middle East.

Dominant Regions, Countries, or Segments in Caviar Industry
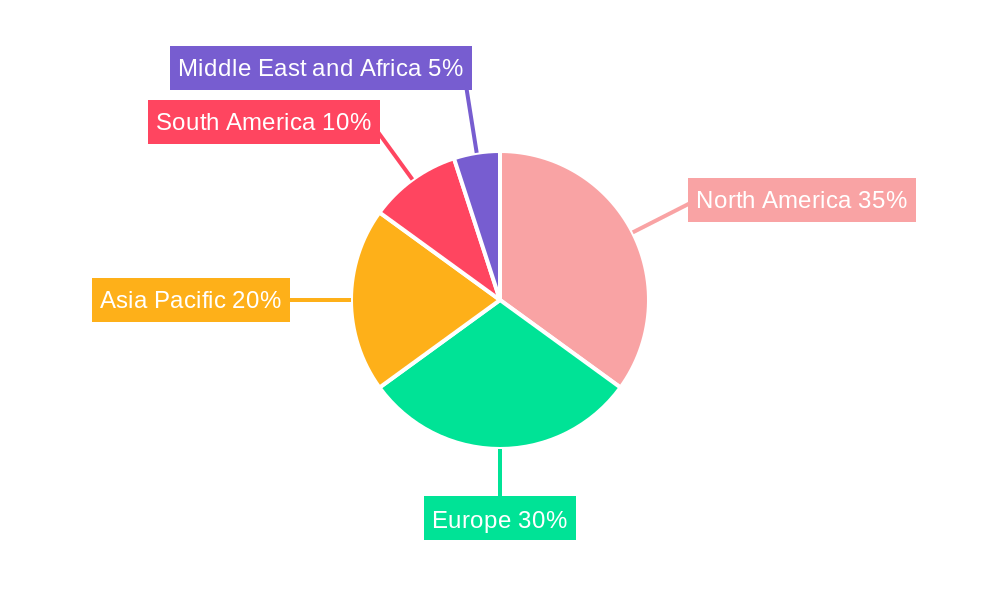
The global caviar market is a complex landscape shaped by diverse geographical influences and consumer preferences. Russia and Iran maintain their positions as leading producers of both wild-caught and farmed caviar, leveraging their historical expertise and access to crucial sturgeon populations. However, significant consumption centers are found in Western Europe and North America, reflecting the high demand for this luxury delicacy within affluent consumer segments. Analyzing the product landscape reveals Beluga caviar commanding the highest price points and market share, though Osetra and Sevruga varieties are experiencing impressive growth, driven by increased availability and affordability. While the on-trade sector (restaurants, hotels, and high-end catering) remains a significant revenue driver, the off-trade sector (retail stores, specialty boutiques, and e-commerce platforms) is demonstrating robust growth, reflecting changing consumption patterns and increased accessibility for consumers.
- Leading Region (2025 Projection): Europe (Insert Percentage Market Share Here)
- Leading Country (2025 Projection): Russia (Insert Percentage Market Share Here)
- Leading Caviar Type (2025 Projection): Beluga (Insert Percentage Market Share Here)
- Leading Form (2025 Projection): Fresh (Insert Percentage Market Share Here)
- Leading Sales Channel (2025 Projection): On-Trade (Insert Percentage Market Share Here)
- Key Growth Drivers: Expanding affluent consumer base in emerging markets, a surge in luxury tourism, and strategic investments in sophisticated distribution networks fostering wider accessibility.
Caviar Industry Product Landscape
The caviar market showcases a diverse range of products, categorized by sturgeon species (Beluga, Osetra, Sevruga, and others), processing techniques (fresh, frozen, pasteurized), and packaging variations. Continuous innovation focuses on enhancing product quality, extending shelf life through advanced preservation methods, and improving overall consumer convenience. Premium caviar brands command significant price premiums, leveraging sophisticated marketing strategies and highlighting their commitment to sustainability. Eco-conscious certifications are increasingly sought by consumers, reflecting a growing awareness of environmental and ethical sourcing practices. Advancements in aquaculture technology have significantly improved the quality and consistency of farmed caviar, providing a wider variety of options and increasing overall market availability.
Key Drivers, Barriers & Challenges in Caviar Industry
Key Drivers: The caviar market's expansion is propelled by several key factors: rising disposable incomes in target markets, escalating demand for premium culinary experiences, increasing consumer preference for sustainably and ethically sourced products, and continuous technological advancements within the aquaculture sector.
Challenges: Strict regulations governing wild caviar harvesting pose significant supply constraints. High production and distribution costs impact affordability and accessibility. Competition from imitation caviar and other luxury seafood presents a challenge to market share. Geopolitical instability and disease outbreaks within sturgeon populations can cause significant supply chain disruptions and price volatility.
Emerging Opportunities in Caviar Industry
Emerging opportunities lie in tapping into untapped markets in Asia and Latin America, developing innovative caviar-based products (e.g., caviar-infused skincare), and focusing on niche consumer segments with unique tastes and preferences. Personalized caviar experiences through customized online ordering and delivery platforms also represent a promising area for growth. Further investment in sustainable aquaculture and research into new caviar species is vital for sustaining the industry's long-term growth.
Growth Accelerators in the Caviar Industry
Several factors are poised to accelerate the long-term growth of the caviar industry. Strategic partnerships between producers and distributors facilitate access to new markets and enhance brand recognition. Investment in research and development is driving innovation in sustainable farming practices and caviar processing techniques. The growing awareness among consumers about the nutritional benefits of caviar, further enhances demand.
Key Players Shaping the Caviar Industry Market
- JSC Russian Caviar House
- Sterling Caviar
- Caviar Blanc
- L'Osage Caviar Company Inc.
- The Caviar Co.
- Black River Caviar
- Labeyrie Fine Food
- Sepehr Dad Caviar GmbH
- Caviar Creator Inc.
- Sasanian Caviar Inc.
Notable Milestones in Caviar Industry Sector
- 2020: Increased investment in sustainable aquaculture by several key players.
- 2022: Launch of a new line of organic caviar by [Company Name].
- 2023: Successful completion of a major M&A deal in the industry. (Further details available in the full report)
In-Depth Caviar Industry Market Outlook
The future of the caviar industry presents a promising outlook, driven by consistent innovation, a growing consumer base increasingly interested in luxury foods, and a rising preference for high-quality, sustainably produced products. Strategic partnerships, expansion into new, lucrative markets, and the introduction of innovative product offerings are expected to further enhance market growth. The long-term outlook is positive, with projections indicating market expansion to (Insert Projected Market Value in Millions by 2033) by 2033. This growth will be underpinned by ongoing investments in sustainable aquaculture practices and a commitment to satisfying the evolving demands of a discerning global clientele.
Caviar Industry Segmentation
-
1. Type
- 1.1. Sevruga
- 1.2. Osetra
- 1.3. Beluga
- 1.4. Sterlet
- 1.5. Other Types
-
2. Form
- 2.1. Fresh
- 2.2. Dried
- 2.3. Frozen
-
3. Sales Channel
- 3.1. On-Trade
- 3.2. Off-Trade
Caviar Industry Segmentation By Geography
-
1. North America
- 1.1. United States
- 1.2. Canada
- 1.3. Mexico
- 1.4. Rest of North America
-
2. Europe
- 2.1. Spain
- 2.2. United Kingdom
- 2.3. Germany
- 2.4. France
- 2.5. Italy
- 2.6. Russia
- 2.7. Rest of Europe
-
3. Asia Pacific
- 3.1. China
- 3.2. Japan
- 3.3. India
- 3.4. Australia
- 3.5. Rest of Asia Pacific
-
4. South America
- 4.1. Brazil
- 4.2. Argentina
- 4.3. Rest of South America
-
5. Middle East and Africa
- 5.1. South Africa
- 5.2. Saudi Arabia
- 5.3. Rest of Middle East and Africa
Caviar Industry REPORT HIGHLIGHTS
| Aspects | Details |
|---|---|
| Study Period | 2019-2033 |
| Base Year | 2024 |
| Estimated Year | 2025 |
| Forecast Period | 2025-2033 |
| Historical Period | 2019-2024 |
| Growth Rate | CAGR of 7.96% from 2019-2033 |
| Segmentation |
|
Table of Contents
- 1. Introduction
- 1.1. Research Scope
- 1.2. Market Segmentation
- 1.3. Research Methodology
- 1.4. Definitions and Assumptions
- 2. Executive Summary
- 2.1. Introduction
- 3. Market Dynamics
- 3.1. Introduction
- 3.2. Market Drivers
- 3.2.1. Caviar's use in high-end cuisine and gourmet dining boosts its market presence
- 3.3. Market Restrains
- 3.3.1. High price of caviar limits its market to premium segment
- 3.4. Market Trends
- 3.4.1. Advances in aquaculture technology improve caviar quality and production efficiency
- 4. Market Factor Analysis
- 4.1. Porters Five Forces
- 4.2. Supply/Value Chain
- 4.3. PESTEL analysis
- 4.4. Market Entropy
- 4.5. Patent/Trademark Analysis
- 5. Global Caviar Industry Analysis, Insights and Forecast, 2019-2031
- 5.1. Market Analysis, Insights and Forecast - by Type
- 5.1.1. Sevruga
- 5.1.2. Osetra
- 5.1.3. Beluga
- 5.1.4. Sterlet
- 5.1.5. Other Types
- 5.2. Market Analysis, Insights and Forecast - by Form
- 5.2.1. Fresh
- 5.2.2. Dried
- 5.2.3. Frozen
- 5.3. Market Analysis, Insights and Forecast - by Sales Channel
- 5.3.1. On-Trade
- 5.3.2. Off-Trade
- 5.4. Market Analysis, Insights and Forecast - by Region
- 5.4.1. North America
- 5.4.2. Europe
- 5.4.3. Asia Pacific
- 5.4.4. South America
- 5.4.5. Middle East and Africa
- 5.1. Market Analysis, Insights and Forecast - by Type
- 6. North America Caviar Industry Analysis, Insights and Forecast, 2019-2031
- 6.1. Market Analysis, Insights and Forecast - by Type
- 6.1.1. Sevruga
- 6.1.2. Osetra
- 6.1.3. Beluga
- 6.1.4. Sterlet
- 6.1.5. Other Types
- 6.2. Market Analysis, Insights and Forecast - by Form
- 6.2.1. Fresh
- 6.2.2. Dried
- 6.2.3. Frozen
- 6.3. Market Analysis, Insights and Forecast - by Sales Channel
- 6.3.1. On-Trade
- 6.3.2. Off-Trade
- 6.1. Market Analysis, Insights and Forecast - by Type
- 7. Europe Caviar Industry Analysis, Insights and Forecast, 2019-2031
- 7.1. Market Analysis, Insights and Forecast - by Type
- 7.1.1. Sevruga
- 7.1.2. Osetra
- 7.1.3. Beluga
- 7.1.4. Sterlet
- 7.1.5. Other Types
- 7.2. Market Analysis, Insights and Forecast - by Form
- 7.2.1. Fresh
- 7.2.2. Dried
- 7.2.3. Frozen
- 7.3. Market Analysis, Insights and Forecast - by Sales Channel
- 7.3.1. On-Trade
- 7.3.2. Off-Trade
- 7.1. Market Analysis, Insights and Forecast - by Type
- 8. Asia Pacific Caviar Industry Analysis, Insights and Forecast, 2019-2031
- 8.1. Market Analysis, Insights and Forecast - by Type
- 8.1.1. Sevruga
- 8.1.2. Osetra
- 8.1.3. Beluga
- 8.1.4. Sterlet
- 8.1.5. Other Types
- 8.2. Market Analysis, Insights and Forecast - by Form
- 8.2.1. Fresh
- 8.2.2. Dried
- 8.2.3. Frozen
- 8.3. Market Analysis, Insights and Forecast - by Sales Channel
- 8.3.1. On-Trade
- 8.3.2. Off-Trade
- 8.1. Market Analysis, Insights and Forecast - by Type
- 9. South America Caviar Industry Analysis, Insights and Forecast, 2019-2031
- 9.1. Market Analysis, Insights and Forecast - by Type
- 9.1.1. Sevruga
- 9.1.2. Osetra
- 9.1.3. Beluga
- 9.1.4. Sterlet
- 9.1.5. Other Types
- 9.2. Market Analysis, Insights and Forecast - by Form
- 9.2.1. Fresh
- 9.2.2. Dried
- 9.2.3. Frozen
- 9.3. Market Analysis, Insights and Forecast - by Sales Channel
- 9.3.1. On-Trade
- 9.3.2. Off-Trade
- 9.1. Market Analysis, Insights and Forecast - by Type
- 10. Middle East and Africa Caviar Industry Analysis, Insights and Forecast, 2019-2031
- 10.1. Market Analysis, Insights and Forecast - by Type
- 10.1.1. Sevruga
- 10.1.2. Osetra
- 10.1.3. Beluga
- 10.1.4. Sterlet
- 10.1.5. Other Types
- 10.2. Market Analysis, Insights and Forecast - by Form
- 10.2.1. Fresh
- 10.2.2. Dried
- 10.2.3. Frozen
- 10.3. Market Analysis, Insights and Forecast - by Sales Channel
- 10.3.1. On-Trade
- 10.3.2. Off-Trade
- 10.1. Market Analysis, Insights and Forecast - by Type
- 11. North America Caviar Industry Analysis, Insights and Forecast, 2019-2031
- 11.1. Market Analysis, Insights and Forecast - By Country/Sub-region
- 11.1.1 United States
- 11.1.2 Canada
- 11.1.3 Mexico
- 11.1.4 Rest of North America
- 12. Europe Caviar Industry Analysis, Insights and Forecast, 2019-2031
- 12.1. Market Analysis, Insights and Forecast - By Country/Sub-region
- 12.1.1 Spain
- 12.1.2 United Kingdom
- 12.1.3 Germany
- 12.1.4 France
- 12.1.5 Italy
- 12.1.6 Russia
- 12.1.7 Rest of Europe
- 13. Asia Pacific Caviar Industry Analysis, Insights and Forecast, 2019-2031
- 13.1. Market Analysis, Insights and Forecast - By Country/Sub-region
- 13.1.1 China
- 13.1.2 Japan
- 13.1.3 India
- 13.1.4 Australia
- 13.1.5 Rest of Asia Pacific
- 14. South America Caviar Industry Analysis, Insights and Forecast, 2019-2031
- 14.1. Market Analysis, Insights and Forecast - By Country/Sub-region
- 14.1.1 Brazil
- 14.1.2 Argentina
- 14.1.3 Rest of South America
- 15. Middle East and Africa Caviar Industry Analysis, Insights and Forecast, 2019-2031
- 15.1. Market Analysis, Insights and Forecast - By Country/Sub-region
- 15.1.1 South Africa
- 15.1.2 Saudi Arabia
- 15.1.3 Rest of Middle East and Africa
- 16. Competitive Analysis
- 16.1. Global Market Share Analysis 2024
- 16.2. Company Profiles
- 16.2.1 JSC Russian caviar house
- 16.2.1.1. Overview
- 16.2.1.2. Products
- 16.2.1.3. SWOT Analysis
- 16.2.1.4. Recent Developments
- 16.2.1.5. Financials (Based on Availability)
- 16.2.2 Sterling Caviar
- 16.2.2.1. Overview
- 16.2.2.2. Products
- 16.2.2.3. SWOT Analysis
- 16.2.2.4. Recent Developments
- 16.2.2.5. Financials (Based on Availability)
- 16.2.3 Caviar Blanc
- 16.2.3.1. Overview
- 16.2.3.2. Products
- 16.2.3.3. SWOT Analysis
- 16.2.3.4. Recent Developments
- 16.2.3.5. Financials (Based on Availability)
- 16.2.4 L'Osage Caviar Company Inc
- 16.2.4.1. Overview
- 16.2.4.2. Products
- 16.2.4.3. SWOT Analysis
- 16.2.4.4. Recent Developments
- 16.2.4.5. Financials (Based on Availability)
- 16.2.5 The Caviar Co
- 16.2.5.1. Overview
- 16.2.5.2. Products
- 16.2.5.3. SWOT Analysis
- 16.2.5.4. Recent Developments
- 16.2.5.5. Financials (Based on Availability)
- 16.2.6 Black River Caviar
- 16.2.6.1. Overview
- 16.2.6.2. Products
- 16.2.6.3. SWOT Analysis
- 16.2.6.4. Recent Developments
- 16.2.6.5. Financials (Based on Availability)
- 16.2.7 Labeyrie Fine Food
- 16.2.7.1. Overview
- 16.2.7.2. Products
- 16.2.7.3. SWOT Analysis
- 16.2.7.4. Recent Developments
- 16.2.7.5. Financials (Based on Availability)
- 16.2.8 Sepehr Dad Caviar GmbH
- 16.2.8.1. Overview
- 16.2.8.2. Products
- 16.2.8.3. SWOT Analysis
- 16.2.8.4. Recent Developments
- 16.2.8.5. Financials (Based on Availability)
- 16.2.9 Caviar Creator Inc
- 16.2.9.1. Overview
- 16.2.9.2. Products
- 16.2.9.3. SWOT Analysis
- 16.2.9.4. Recent Developments
- 16.2.9.5. Financials (Based on Availability)
- 16.2.10 Sasanian Caviar Inc
- 16.2.10.1. Overview
- 16.2.10.2. Products
- 16.2.10.3. SWOT Analysis
- 16.2.10.4. Recent Developments
- 16.2.10.5. Financials (Based on Availability)
- 16.2.1 JSC Russian caviar house
List of Figures
- Figure 1: Global Caviar Industry Revenue Breakdown (Million, %) by Region 2024 & 2032
- Figure 2: North America Caviar Industry Revenue (Million), by Country 2024 & 2032
- Figure 3: North America Caviar Industry Revenue Share (%), by Country 2024 & 2032
- Figure 4: Europe Caviar Industry Revenue (Million), by Country 2024 & 2032
- Figure 5: Europe Caviar Industry Revenue Share (%), by Country 2024 & 2032
- Figure 6: Asia Pacific Caviar Industry Revenue (Million), by Country 2024 & 2032
- Figure 7: Asia Pacific Caviar Industry Revenue Share (%), by Country 2024 & 2032
- Figure 8: South America Caviar Industry Revenue (Million), by Country 2024 & 2032
- Figure 9: South America Caviar Industry Revenue Share (%), by Country 2024 & 2032
- Figure 10: Middle East and Africa Caviar Industry Revenue (Million), by Country 2024 & 2032
- Figure 11: Middle East and Africa Caviar Industry Revenue Share (%), by Country 2024 & 2032
- Figure 12: North America Caviar Industry Revenue (Million), by Type 2024 & 2032
- Figure 13: North America Caviar Industry Revenue Share (%), by Type 2024 & 2032
- Figure 14: North America Caviar Industry Revenue (Million), by Form 2024 & 2032
- Figure 15: North America Caviar Industry Revenue Share (%), by Form 2024 & 2032
- Figure 16: North America Caviar Industry Revenue (Million), by Sales Channel 2024 & 2032
- Figure 17: North America Caviar Industry Revenue Share (%), by Sales Channel 2024 & 2032
- Figure 18: North America Caviar Industry Revenue (Million), by Country 2024 & 2032
- Figure 19: North America Caviar Industry Revenue Share (%), by Country 2024 & 2032
- Figure 20: Europe Caviar Industry Revenue (Million), by Type 2024 & 2032
- Figure 21: Europe Caviar Industry Revenue Share (%), by Type 2024 & 2032
- Figure 22: Europe Caviar Industry Revenue (Million), by Form 2024 & 2032
- Figure 23: Europe Caviar Industry Revenue Share (%), by Form 2024 & 2032
- Figure 24: Europe Caviar Industry Revenue (Million), by Sales Channel 2024 & 2032
- Figure 25: Europe Caviar Industry Revenue Share (%), by Sales Channel 2024 & 2032
- Figure 26: Europe Caviar Industry Revenue (Million), by Country 2024 & 2032
- Figure 27: Europe Caviar Industry Revenue Share (%), by Country 2024 & 2032
- Figure 28: Asia Pacific Caviar Industry Revenue (Million), by Type 2024 & 2032
- Figure 29: Asia Pacific Caviar Industry Revenue Share (%), by Type 2024 & 2032
- Figure 30: Asia Pacific Caviar Industry Revenue (Million), by Form 2024 & 2032
- Figure 31: Asia Pacific Caviar Industry Revenue Share (%), by Form 2024 & 2032
- Figure 32: Asia Pacific Caviar Industry Revenue (Million), by Sales Channel 2024 & 2032
- Figure 33: Asia Pacific Caviar Industry Revenue Share (%), by Sales Channel 2024 & 2032
- Figure 34: Asia Pacific Caviar Industry Revenue (Million), by Country 2024 & 2032
- Figure 35: Asia Pacific Caviar Industry Revenue Share (%), by Country 2024 & 2032
- Figure 36: South America Caviar Industry Revenue (Million), by Type 2024 & 2032
- Figure 37: South America Caviar Industry Revenue Share (%), by Type 2024 & 2032
- Figure 38: South America Caviar Industry Revenue (Million), by Form 2024 & 2032
- Figure 39: South America Caviar Industry Revenue Share (%), by Form 2024 & 2032
- Figure 40: South America Caviar Industry Revenue (Million), by Sales Channel 2024 & 2032
- Figure 41: South America Caviar Industry Revenue Share (%), by Sales Channel 2024 & 2032
- Figure 42: South America Caviar Industry Revenue (Million), by Country 2024 & 2032
- Figure 43: South America Caviar Industry Revenue Share (%), by Country 2024 & 2032
- Figure 44: Middle East and Africa Caviar Industry Revenue (Million), by Type 2024 & 2032
- Figure 45: Middle East and Africa Caviar Industry Revenue Share (%), by Type 2024 & 2032
- Figure 46: Middle East and Africa Caviar Industry Revenue (Million), by Form 2024 & 2032
- Figure 47: Middle East and Africa Caviar Industry Revenue Share (%), by Form 2024 & 2032
- Figure 48: Middle East and Africa Caviar Industry Revenue (Million), by Sales Channel 2024 & 2032
- Figure 49: Middle East and Africa Caviar Industry Revenue Share (%), by Sales Channel 2024 & 2032
- Figure 50: Middle East and Africa Caviar Industry Revenue (Million), by Country 2024 & 2032
- Figure 51: Middle East and Africa Caviar Industry Revenue Share (%), by Country 2024 & 2032
List of Tables
- Table 1: Global Caviar Industry Revenue Million Forecast, by Region 2019 & 2032
- Table 2: Global Caviar Industry Revenue Million Forecast, by Type 2019 & 2032
- Table 3: Global Caviar Industry Revenue Million Forecast, by Form 2019 & 2032
- Table 4: Global Caviar Industry Revenue Million Forecast, by Sales Channel 2019 & 2032
- Table 5: Global Caviar Industry Revenue Million Forecast, by Region 2019 & 2032
- Table 6: Global Caviar Industry Revenue Million Forecast, by Country 2019 & 2032
- Table 7: United States Caviar Industry Revenue (Million) Forecast, by Application 2019 & 2032
- Table 8: Canada Caviar Industry Revenue (Million) Forecast, by Application 2019 & 2032
- Table 9: Mexico Caviar Industry Revenue (Million) Forecast, by Application 2019 & 2032
- Table 10: Rest of North America Caviar Industry Revenue (Million) Forecast, by Application 2019 & 2032
- Table 11: Global Caviar Industry Revenue Million Forecast, by Country 2019 & 2032
- Table 12: Spain Caviar Industry Revenue (Million) Forecast, by Application 2019 & 2032
- Table 13: United Kingdom Caviar Industry Revenue (Million) Forecast, by Application 2019 & 2032
- Table 14: Germany Caviar Industry Revenue (Million) Forecast, by Application 2019 & 2032
- Table 15: France Caviar Industry Revenue (Million) Forecast, by Application 2019 & 2032
- Table 16: Italy Caviar Industry Revenue (Million) Forecast, by Application 2019 & 2032
- Table 17: Russia Caviar Industry Revenue (Million) Forecast, by Application 2019 & 2032
- Table 18: Rest of Europe Caviar Industry Revenue (Million) Forecast, by Application 2019 & 2032
- Table 19: Global Caviar Industry Revenue Million Forecast, by Country 2019 & 2032
- Table 20: China Caviar Industry Revenue (Million) Forecast, by Application 2019 & 2032
- Table 21: Japan Caviar Industry Revenue (Million) Forecast, by Application 2019 & 2032
- Table 22: India Caviar Industry Revenue (Million) Forecast, by Application 2019 & 2032
- Table 23: Australia Caviar Industry Revenue (Million) Forecast, by Application 2019 & 2032
- Table 24: Rest of Asia Pacific Caviar Industry Revenue (Million) Forecast, by Application 2019 & 2032
- Table 25: Global Caviar Industry Revenue Million Forecast, by Country 2019 & 2032
- Table 26: Brazil Caviar Industry Revenue (Million) Forecast, by Application 2019 & 2032
- Table 27: Argentina Caviar Industry Revenue (Million) Forecast, by Application 2019 & 2032
- Table 28: Rest of South America Caviar Industry Revenue (Million) Forecast, by Application 2019 & 2032
- Table 29: Global Caviar Industry Revenue Million Forecast, by Country 2019 & 2032
- Table 30: South Africa Caviar Industry Revenue (Million) Forecast, by Application 2019 & 2032
- Table 31: Saudi Arabia Caviar Industry Revenue (Million) Forecast, by Application 2019 & 2032
- Table 32: Rest of Middle East and Africa Caviar Industry Revenue (Million) Forecast, by Application 2019 & 2032
- Table 33: Global Caviar Industry Revenue Million Forecast, by Type 2019 & 2032
- Table 34: Global Caviar Industry Revenue Million Forecast, by Form 2019 & 2032
- Table 35: Global Caviar Industry Revenue Million Forecast, by Sales Channel 2019 & 2032
- Table 36: Global Caviar Industry Revenue Million Forecast, by Country 2019 & 2032
- Table 37: United States Caviar Industry Revenue (Million) Forecast, by Application 2019 & 2032
- Table 38: Canada Caviar Industry Revenue (Million) Forecast, by Application 2019 & 2032
- Table 39: Mexico Caviar Industry Revenue (Million) Forecast, by Application 2019 & 2032
- Table 40: Rest of North America Caviar Industry Revenue (Million) Forecast, by Application 2019 & 2032
- Table 41: Global Caviar Industry Revenue Million Forecast, by Type 2019 & 2032
- Table 42: Global Caviar Industry Revenue Million Forecast, by Form 2019 & 2032
- Table 43: Global Caviar Industry Revenue Million Forecast, by Sales Channel 2019 & 2032
- Table 44: Global Caviar Industry Revenue Million Forecast, by Country 2019 & 2032
- Table 45: Spain Caviar Industry Revenue (Million) Forecast, by Application 2019 & 2032
- Table 46: United Kingdom Caviar Industry Revenue (Million) Forecast, by Application 2019 & 2032
- Table 47: Germany Caviar Industry Revenue (Million) Forecast, by Application 2019 & 2032
- Table 48: France Caviar Industry Revenue (Million) Forecast, by Application 2019 & 2032
- Table 49: Italy Caviar Industry Revenue (Million) Forecast, by Application 2019 & 2032
- Table 50: Russia Caviar Industry Revenue (Million) Forecast, by Application 2019 & 2032
- Table 51: Rest of Europe Caviar Industry Revenue (Million) Forecast, by Application 2019 & 2032
- Table 52: Global Caviar Industry Revenue Million Forecast, by Type 2019 & 2032
- Table 53: Global Caviar Industry Revenue Million Forecast, by Form 2019 & 2032
- Table 54: Global Caviar Industry Revenue Million Forecast, by Sales Channel 2019 & 2032
- Table 55: Global Caviar Industry Revenue Million Forecast, by Country 2019 & 2032
- Table 56: China Caviar Industry Revenue (Million) Forecast, by Application 2019 & 2032
- Table 57: Japan Caviar Industry Revenue (Million) Forecast, by Application 2019 & 2032
- Table 58: India Caviar Industry Revenue (Million) Forecast, by Application 2019 & 2032
- Table 59: Australia Caviar Industry Revenue (Million) Forecast, by Application 2019 & 2032
- Table 60: Rest of Asia Pacific Caviar Industry Revenue (Million) Forecast, by Application 2019 & 2032
- Table 61: Global Caviar Industry Revenue Million Forecast, by Type 2019 & 2032
- Table 62: Global Caviar Industry Revenue Million Forecast, by Form 2019 & 2032
- Table 63: Global Caviar Industry Revenue Million Forecast, by Sales Channel 2019 & 2032
- Table 64: Global Caviar Industry Revenue Million Forecast, by Country 2019 & 2032
- Table 65: Brazil Caviar Industry Revenue (Million) Forecast, by Application 2019 & 2032
- Table 66: Argentina Caviar Industry Revenue (Million) Forecast, by Application 2019 & 2032
- Table 67: Rest of South America Caviar Industry Revenue (Million) Forecast, by Application 2019 & 2032
- Table 68: Global Caviar Industry Revenue Million Forecast, by Type 2019 & 2032
- Table 69: Global Caviar Industry Revenue Million Forecast, by Form 2019 & 2032
- Table 70: Global Caviar Industry Revenue Million Forecast, by Sales Channel 2019 & 2032
- Table 71: Global Caviar Industry Revenue Million Forecast, by Country 2019 & 2032
- Table 72: South Africa Caviar Industry Revenue (Million) Forecast, by Application 2019 & 2032
- Table 73: Saudi Arabia Caviar Industry Revenue (Million) Forecast, by Application 2019 & 2032
- Table 74: Rest of Middle East and Africa Caviar Industry Revenue (Million) Forecast, by Application 2019 & 2032
Frequently Asked Questions
1. What is the projected Compound Annual Growth Rate (CAGR) of the Caviar Industry?
The projected CAGR is approximately 7.96%.
2. Which companies are prominent players in the Caviar Industry?
Key companies in the market include JSC Russian caviar house, Sterling Caviar, Caviar Blanc, L'Osage Caviar Company Inc, The Caviar Co, Black River Caviar, Labeyrie Fine Food, Sepehr Dad Caviar GmbH, Caviar Creator Inc, Sasanian Caviar Inc.
3. What are the main segments of the Caviar Industry?
The market segments include Type, Form, Sales Channel.
4. Can you provide details about the market size?
The market size is estimated to be USD 372.99 Million as of 2022.
5. What are some drivers contributing to market growth?
Caviar's use in high-end cuisine and gourmet dining boosts its market presence.
6. What are the notable trends driving market growth?
Advances in aquaculture technology improve caviar quality and production efficiency.
7. Are there any restraints impacting market growth?
High price of caviar limits its market to premium segment.
8. Can you provide examples of recent developments in the market?
N/A
9. What pricing options are available for accessing the report?
Pricing options include single-user, multi-user, and enterprise licenses priced at USD 4750, USD 5250, and USD 8750 respectively.
10. Is the market size provided in terms of value or volume?
The market size is provided in terms of value, measured in Million.
11. Are there any specific market keywords associated with the report?
Yes, the market keyword associated with the report is "Caviar Industry," which aids in identifying and referencing the specific market segment covered.
12. How do I determine which pricing option suits my needs best?
The pricing options vary based on user requirements and access needs. Individual users may opt for single-user licenses, while businesses requiring broader access may choose multi-user or enterprise licenses for cost-effective access to the report.
13. Are there any additional resources or data provided in the Caviar Industry report?
While the report offers comprehensive insights, it's advisable to review the specific contents or supplementary materials provided to ascertain if additional resources or data are available.
14. How can I stay updated on further developments or reports in the Caviar Industry?
To stay informed about further developments, trends, and reports in the Caviar Industry, consider subscribing to industry newsletters, following relevant companies and organizations, or regularly checking reputable industry news sources and publications.
Methodology
Step 1 - Identification of Relevant Samples Size from Population Database


Step 2 - Approaches for Defining Global Market Size (Value, Volume* & Price*)

Note*: In applicable scenarios
Step 3 - Data Sources
Primary Research
- Web Analytics
- Survey Reports
- Research Institute
- Latest Research Reports
- Opinion Leaders
Secondary Research
- Annual Reports
- White Paper
- Latest Press Release
- Industry Association
- Paid Database
- Investor Presentations

Step 4 - Data Triangulation
Involves using different sources of information in order to increase the validity of a study
These sources are likely to be stakeholders in a program - participants, other researchers, program staff, other community members, and so on.
Then we put all data in single framework & apply various statistical tools to find out the dynamic on the market.
During the analysis stage, feedback from the stakeholder groups would be compared to determine areas of agreement as well as areas of divergence
