

Key Insights
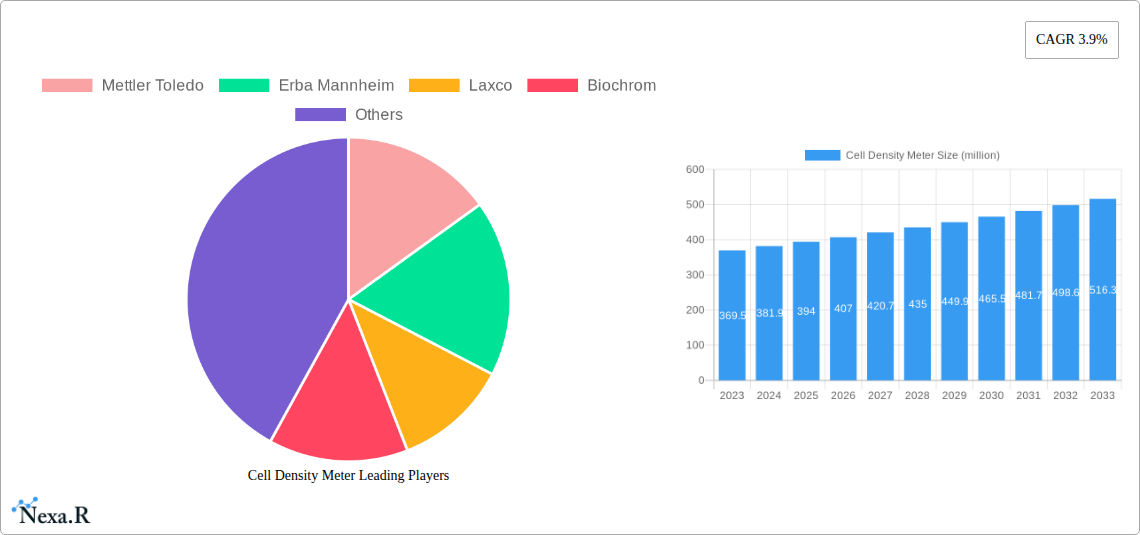
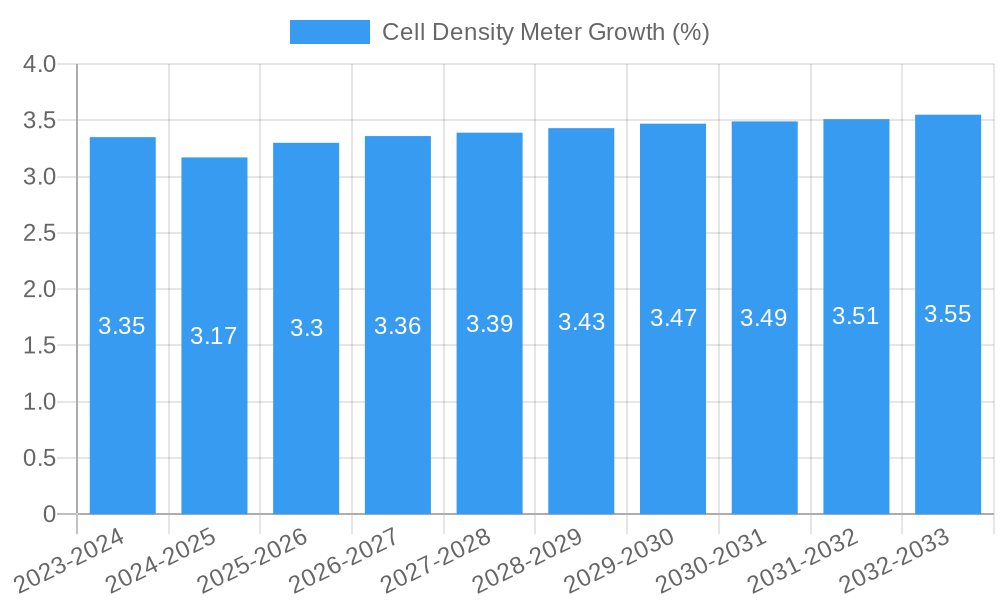
The global Cell Density Meter market is projected to reach a substantial \$394 million in 2025, driven by a consistent Compound Annual Growth Rate (CAGR) of 3.9% through 2033. This growth is fueled by the escalating demand for precise cell counting and analysis across various scientific disciplines, particularly in pharmaceutical research and development, biotechnology, and academic institutions. The increasing prevalence of infectious diseases and the ongoing efforts in vaccine development further bolster the need for reliable cell density measurement tools. Furthermore, advancements in technology, leading to the introduction of more sophisticated and user-friendly cell density meters, including compact table-top and portable handheld devices, are expanding the market's reach into diverse laboratory settings and field applications. The expanding research into cellular therapies and regenerative medicine also presents a significant opportunity for market expansion.
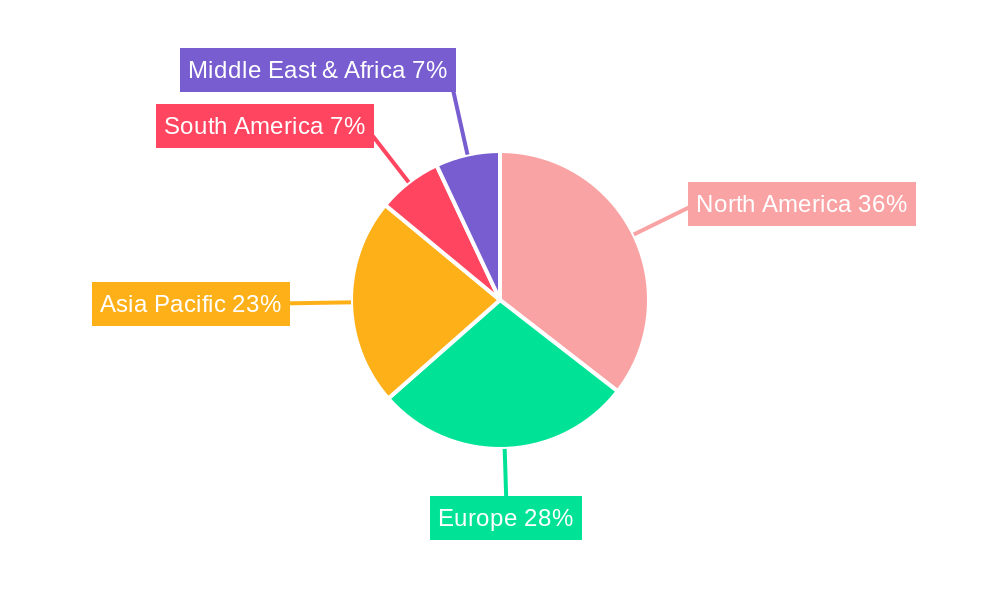
The market is segmented into laboratory and institute applications, with table-top and handheld devices catering to different user needs and operational environments. Leading companies such as Mettler Toledo, Erba Mannheim, Laxco, and Biochrom are actively investing in innovation and expanding their product portfolios to capture a larger market share. Geographically, North America, with its robust pharmaceutical industry and high R&D spending, is expected to lead the market. However, the Asia Pacific region, driven by rapid industrialization, increasing healthcare expenditure, and a growing number of research initiatives in countries like China and India, is anticipated to witness the fastest growth rate. Emerging economies in South America and the Middle East & Africa are also showing promising potential as cell density measurement technology becomes more accessible. The market's trajectory indicates a strong and sustained demand for cell density meters as a crucial tool for biological research and clinical diagnostics.
Comprehensive Cell Density Meter Market Report: Global Analysis 2019-2033
This in-depth report provides a comprehensive analysis of the global Cell Density Meter market, covering the historical period from 2019 to 2024, the base year of 2025, and projecting future growth through 2033. Leveraging advanced analytical tools and industry expertise, this study offers critical insights into market dynamics, growth trends, regional dominance, product landscape, key drivers, challenges, emerging opportunities, and the strategic moves of leading players. Designed for industry professionals, researchers, and investors, this report serves as an indispensable guide to navigating the evolving cell density meter landscape.
Cell Density Meter Market Dynamics & Structure
The global Cell Density Meter market is characterized by a moderate level of concentration, with key players like Mettler Toledo and Erba Mannheim holding significant market share. Technological innovation is a primary driver, with continuous advancements in sensor technology, data processing, and user interface design enhancing the precision and ease of use of cell density meters. Regulatory frameworks, particularly those from bodies like the FDA and EMA for laboratory and biopharmaceutical applications, play a crucial role in shaping product development and market access. Competitive product substitutes, such as manual cell counting methods and automated cell counters with broader functionalities, exist but often come at a higher price point or lack the specific advantages of dedicated cell density meters. End-user demographics are diverse, spanning academic research institutions, diagnostic laboratories, pharmaceutical and biotechnology companies, and contract research organizations (CROs). Mergers and acquisitions (M&A) are sporadic, reflecting a mature market where organic growth and strategic partnerships are more common.
- Market Concentration: Moderate, with a few key players dominating the market.
- Technological Innovation Drivers: Miniaturization, improved sensor accuracy, digital connectivity, and AI-powered data analysis.
- Regulatory Frameworks: Strict adherence to standards for accuracy, calibration, and validation in healthcare and research.
- Competitive Product Substitutes: Manual microscopy, automated cell counters, flow cytometers.
- End-User Demographics: Academic research (40% of market), Pharmaceutical & Biotechnology (35% of market), Clinical Diagnostics (15% of market), Others (10% of market).
- M&A Trends: Limited, with focus on acquiring niche technologies or expanding geographical reach.
Cell Density Meter Growth Trends & Insights
The global Cell Density Meter market is poised for robust growth over the forecast period. Driven by increasing investments in life sciences research, the expanding biopharmaceutical industry, and the growing demand for accurate cell counting in diagnostics, the market size is projected to witness a substantial increase. Adoption rates are high across both established and emerging markets, fueled by the need for reliable and reproducible cell density measurements for cell-based assays, microbial cultivation, and drug discovery. Technological disruptions, including the integration of IoT capabilities for remote monitoring and data management, and the development of more sensitive and versatile optical systems, are significantly enhancing market appeal. Consumer behavior shifts towards automation and data-driven decision-making further bolster the demand for sophisticated cell density meters. The market CAGR is estimated to be around 7.5% during the forecast period (2025-2033). The market penetration is projected to reach 70% in developed economies and 45% in emerging economies by 2033. Advancements in AI and machine learning are enabling more sophisticated analysis of cell culture parameters, further driving the adoption of advanced cell density meters. The increasing prevalence of chronic diseases and the subsequent rise in demand for biologics and cell therapies are significant market catalysts. Furthermore, government initiatives supporting R&D in biotechnology and healthcare are creating a favorable environment for market expansion. The growing emphasis on quality control in pharmaceutical manufacturing also necessitates precise cell density monitoring, thereby boosting market growth. The development of portable and user-friendly handheld cell density meters is expanding their application in field research and point-of-care diagnostics.
Dominant Regions, Countries, or Segments in Cell Density Meter
North America currently holds the dominant position in the global Cell Density Meter market, driven by its robust life sciences ecosystem, substantial R&D investments, and a strong presence of leading pharmaceutical and biotechnology companies. The United States, in particular, is a key contributor, owing to its advanced healthcare infrastructure, significant academic research output, and favorable government funding for scientific endeavors. The region's high adoption rate of cutting-edge technologies and stringent quality control standards in laboratories and research institutes further solidify its dominance.
- Application: Laboratory is the leading segment, accounting for approximately 55% of the market share. This dominance is attributed to the widespread use of cell density meters in academic research, drug discovery, and quality control processes within pharmaceutical and biotech laboratories.
- Type: Table-top cell density meters represent the larger share within the types, estimated at 60% of the market. Their advanced features, higher precision, and suitability for controlled laboratory environments contribute to this lead. However, the Type: Handheld segment is experiencing rapid growth due to its portability and convenience for field applications and on-site measurements.
- Country-wise Dominance: The United States leads, followed by Germany and Japan.
- Key Drivers in North America:
- Significant government funding for life sciences research (e.g., NIH grants).
- Strong presence of major pharmaceutical and biotechnology companies.
- High adoption rate of advanced laboratory equipment.
- Strict regulatory compliance driving demand for accurate measurement tools.
- Well-established contract research organization (CRO) sector.
The market in Europe, particularly Germany, the United Kingdom, and France, is also a significant contributor, driven by a strong research base and a well-developed pharmaceutical industry. Asia Pacific is emerging as a rapidly growing region, propelled by increasing R&D investments, a growing biopharmaceutical sector in countries like China and India, and expanding healthcare infrastructure. Economic policies supporting innovation and the increasing outsourcing of R&D activities to this region are contributing to its accelerated growth. The market share of North America is projected to be around 38% in 2025, followed by Europe at 30%, and Asia Pacific at 25%.
Cell Density Meter Product Landscape
The Cell Density Meter product landscape is characterized by continuous innovation aimed at enhancing accuracy, sensitivity, and user convenience. Manufacturers are focusing on developing instruments with expanded measurement ranges, improved optical components for precise wavelength detection, and integrated software for real-time data analysis and storage. Applications range from microbial culture monitoring and mammalian cell culture quantification to routine quality control in biopharmaceutical production. Unique selling propositions often include rapid measurement times, minimal sample volume requirements, and seamless integration with laboratory information management systems (LIMS). Technological advancements include the incorporation of fluorescence detection for cell viability assessment and the development of multi-parameter measurement capabilities.
Key Drivers, Barriers & Challenges in Cell Density Meter
Key Drivers:
- Growing Biopharmaceutical Industry: The expanding market for biologics, vaccines, and cell therapies directly fuels the demand for precise cell density measurements in R&D and manufacturing.
- Increased Life Sciences Research Funding: Growing investments in academic and governmental research institutions globally necessitate reliable tools for cell culture and analysis.
- Advancements in Biotechnology: Innovations in genetic engineering, cell-based assays, and personalized medicine require accurate cell density quantification.
- Demand for Automation and Data Integration: Laboratories are increasingly seeking automated solutions with data logging capabilities for efficiency and reproducibility.
Key Barriers & Challenges:
- High Initial Investment Costs: Advanced cell density meters can represent a significant capital expenditure for smaller labs or emerging markets, impacting adoption rates.
- Stringent Regulatory Compliance: Meeting rigorous quality and validation standards for specific applications (e.g., GMP environments) can be complex and costly.
- Availability of Lower-Cost Alternatives: While less sophisticated, cheaper manual methods or basic automated cell counters can be attractive for budget-constrained users.
- Supply Chain Disruptions: Global events can impact the availability of critical components and the timely delivery of instruments, posing a challenge to manufacturers and end-users. Supply chain issues could lead to a 5-10% delay in product availability.
- Technical Expertise for Calibration and Maintenance: Ensuring consistent accuracy requires trained personnel for proper calibration and maintenance, which can be a barrier in some regions.
Emerging Opportunities in Cell Density Meter
Emerging opportunities lie in the development of integrated, multi-functional cell analysis platforms that combine cell density measurement with other critical parameters like cell viability, size, and metabolic activity. The growing demand for point-of-care diagnostics and decentralized laboratory testing presents a significant opportunity for compact, user-friendly handheld cell density meters. Furthermore, untapped markets in developing economies with expanding healthcare and research sectors offer substantial growth potential. The increasing adoption of single-use bioreactors also creates a niche for specialized cell density monitoring solutions.
Growth Accelerators in the Cell Density Meter Industry
Long-term growth in the Cell Density Meter industry is being accelerated by several key factors. Continuous technological breakthroughs, such as the development of more sensitive and selective optical sensors and improved algorithms for data interpretation, are enhancing instrument performance and expanding application possibilities. Strategic partnerships between instrument manufacturers and reagent suppliers, or between instrument makers and software developers, are creating integrated solutions that offer greater value to end-users. Furthermore, market expansion strategies targeting emerging economies, coupled with efforts to educate potential users on the benefits of advanced cell density measurement, are crucial growth catalysts. The increasing demand for personalized medicine and advanced cell therapies is a significant growth accelerator, creating a consistent need for precise cell counting and characterization.
Key Players Shaping the Cell Density Meter Market
- Mettler Toledo
- Erba Mannheim
- Laxco
- Biochrom
- Cellix
- BTX
Notable Milestones in Cell Density Meter Sector
- 2019: Introduction of enhanced portable handheld cell density meters with Bluetooth connectivity.
- 2020: Launch of advanced table-top models with integrated AI for predictive cell growth analysis.
- 2021: Significant increase in demand for cell density meters for vaccine production and research due to global health events.
- 2022: Development of novel optical sensor technologies enabling higher accuracy and lower detection limits.
- 2023: Increased focus on cybersecurity for connected laboratory instruments, including cell density meters.
- 2024: Emergence of cloud-based data management solutions for cell density meter users, facilitating collaboration and data archiving.
In-Depth Cell Density Meter Market Outlook
The outlook for the Cell Density Meter market remains highly positive, driven by sustained innovation and expanding application areas. Growth accelerators such as advancements in bioprocessing technologies, the burgeoning field of cell and gene therapies, and the continuous pursuit of higher accuracy in biological research will fuel market expansion. Strategic opportunities lie in addressing the specific needs of niche markets, such as environmental monitoring and food safety, where precise cell density measurements are crucial. The increasing digitalization of laboratories and the adoption of Industry 4.0 principles will further enhance the demand for smart, connected cell density meters. Companies that focus on offering comprehensive solutions, including robust software, excellent customer support, and continuous technological updates, will be well-positioned for long-term success in this dynamic market. The market is projected to grow from approximately $450 million in 2025 to over $700 million by 2033.
Cell Density Meter Segmentation
-
1. Application
- 1.1. Laboratory
- 1.2. Institute
-
2. Type
- 2.1. Table-top
- 2.2. Handheld
Cell Density Meter Segmentation By Geography
-
1. North America
- 1.1. United States
- 1.2. Canada
- 1.3. Mexico
-
2. South America
- 2.1. Brazil
- 2.2. Argentina
- 2.3. Rest of South America
-
3. Europe
- 3.1. United Kingdom
- 3.2. Germany
- 3.3. France
- 3.4. Italy
- 3.5. Spain
- 3.6. Russia
- 3.7. Benelux
- 3.8. Nordics
- 3.9. Rest of Europe
-
4. Middle East & Africa
- 4.1. Turkey
- 4.2. Israel
- 4.3. GCC
- 4.4. North Africa
- 4.5. South Africa
- 4.6. Rest of Middle East & Africa
-
5. Asia Pacific
- 5.1. China
- 5.2. India
- 5.3. Japan
- 5.4. South Korea
- 5.5. ASEAN
- 5.6. Oceania
- 5.7. Rest of Asia Pacific
Cell Density Meter REPORT HIGHLIGHTS
| Aspects | Details |
|---|---|
| Study Period | 2019-2033 |
| Base Year | 2024 |
| Estimated Year | 2025 |
| Forecast Period | 2025-2033 |
| Historical Period | 2019-2024 |
| Growth Rate | CAGR of 3.9% from 2019-2033 |
| Segmentation |
|
Table of Contents
- 1. Introduction
- 1.1. Research Scope
- 1.2. Market Segmentation
- 1.3. Research Methodology
- 1.4. Definitions and Assumptions
- 2. Executive Summary
- 2.1. Introduction
- 3. Market Dynamics
- 3.1. Introduction
- 3.2. Market Drivers
- 3.3. Market Restrains
- 3.4. Market Trends
- 4. Market Factor Analysis
- 4.1. Porters Five Forces
- 4.2. Supply/Value Chain
- 4.3. PESTEL analysis
- 4.4. Market Entropy
- 4.5. Patent/Trademark Analysis
- 5. Global Cell Density Meter Analysis, Insights and Forecast, 2019-2031
- 5.1. Market Analysis, Insights and Forecast - by Application
- 5.1.1. Laboratory
- 5.1.2. Institute
- 5.2. Market Analysis, Insights and Forecast - by Type
- 5.2.1. Table-top
- 5.2.2. Handheld
- 5.3. Market Analysis, Insights and Forecast - by Region
- 5.3.1. North America
- 5.3.2. South America
- 5.3.3. Europe
- 5.3.4. Middle East & Africa
- 5.3.5. Asia Pacific
- 5.1. Market Analysis, Insights and Forecast - by Application
- 6. North America Cell Density Meter Analysis, Insights and Forecast, 2019-2031
- 6.1. Market Analysis, Insights and Forecast - by Application
- 6.1.1. Laboratory
- 6.1.2. Institute
- 6.2. Market Analysis, Insights and Forecast - by Type
- 6.2.1. Table-top
- 6.2.2. Handheld
- 6.1. Market Analysis, Insights and Forecast - by Application
- 7. South America Cell Density Meter Analysis, Insights and Forecast, 2019-2031
- 7.1. Market Analysis, Insights and Forecast - by Application
- 7.1.1. Laboratory
- 7.1.2. Institute
- 7.2. Market Analysis, Insights and Forecast - by Type
- 7.2.1. Table-top
- 7.2.2. Handheld
- 7.1. Market Analysis, Insights and Forecast - by Application
- 8. Europe Cell Density Meter Analysis, Insights and Forecast, 2019-2031
- 8.1. Market Analysis, Insights and Forecast - by Application
- 8.1.1. Laboratory
- 8.1.2. Institute
- 8.2. Market Analysis, Insights and Forecast - by Type
- 8.2.1. Table-top
- 8.2.2. Handheld
- 8.1. Market Analysis, Insights and Forecast - by Application
- 9. Middle East & Africa Cell Density Meter Analysis, Insights and Forecast, 2019-2031
- 9.1. Market Analysis, Insights and Forecast - by Application
- 9.1.1. Laboratory
- 9.1.2. Institute
- 9.2. Market Analysis, Insights and Forecast - by Type
- 9.2.1. Table-top
- 9.2.2. Handheld
- 9.1. Market Analysis, Insights and Forecast - by Application
- 10. Asia Pacific Cell Density Meter Analysis, Insights and Forecast, 2019-2031
- 10.1. Market Analysis, Insights and Forecast - by Application
- 10.1.1. Laboratory
- 10.1.2. Institute
- 10.2. Market Analysis, Insights and Forecast - by Type
- 10.2.1. Table-top
- 10.2.2. Handheld
- 10.1. Market Analysis, Insights and Forecast - by Application
- 11. Competitive Analysis
- 11.1. Global Market Share Analysis 2024
- 11.2. Company Profiles
- 11.2.1 Mettler Toledo
- 11.2.1.1. Overview
- 11.2.1.2. Products
- 11.2.1.3. SWOT Analysis
- 11.2.1.4. Recent Developments
- 11.2.1.5. Financials (Based on Availability)
- 11.2.2 Erba Mannheim
- 11.2.2.1. Overview
- 11.2.2.2. Products
- 11.2.2.3. SWOT Analysis
- 11.2.2.4. Recent Developments
- 11.2.2.5. Financials (Based on Availability)
- 11.2.3 Laxco
- 11.2.3.1. Overview
- 11.2.3.2. Products
- 11.2.3.3. SWOT Analysis
- 11.2.3.4. Recent Developments
- 11.2.3.5. Financials (Based on Availability)
- 11.2.4 Biochrom
- 11.2.4.1. Overview
- 11.2.4.2. Products
- 11.2.4.3. SWOT Analysis
- 11.2.4.4. Recent Developments
- 11.2.4.5. Financials (Based on Availability)
- 11.2.1 Mettler Toledo
List of Figures
- Figure 1: Global Cell Density Meter Revenue Breakdown (million, %) by Region 2024 & 2032
- Figure 2: Global Cell Density Meter Volume Breakdown (K, %) by Region 2024 & 2032
- Figure 3: North America Cell Density Meter Revenue (million), by Application 2024 & 2032
- Figure 4: North America Cell Density Meter Volume (K), by Application 2024 & 2032
- Figure 5: North America Cell Density Meter Revenue Share (%), by Application 2024 & 2032
- Figure 6: North America Cell Density Meter Volume Share (%), by Application 2024 & 2032
- Figure 7: North America Cell Density Meter Revenue (million), by Type 2024 & 2032
- Figure 8: North America Cell Density Meter Volume (K), by Type 2024 & 2032
- Figure 9: North America Cell Density Meter Revenue Share (%), by Type 2024 & 2032
- Figure 10: North America Cell Density Meter Volume Share (%), by Type 2024 & 2032
- Figure 11: North America Cell Density Meter Revenue (million), by Country 2024 & 2032
- Figure 12: North America Cell Density Meter Volume (K), by Country 2024 & 2032
- Figure 13: North America Cell Density Meter Revenue Share (%), by Country 2024 & 2032
- Figure 14: North America Cell Density Meter Volume Share (%), by Country 2024 & 2032
- Figure 15: South America Cell Density Meter Revenue (million), by Application 2024 & 2032
- Figure 16: South America Cell Density Meter Volume (K), by Application 2024 & 2032
- Figure 17: South America Cell Density Meter Revenue Share (%), by Application 2024 & 2032
- Figure 18: South America Cell Density Meter Volume Share (%), by Application 2024 & 2032
- Figure 19: South America Cell Density Meter Revenue (million), by Type 2024 & 2032
- Figure 20: South America Cell Density Meter Volume (K), by Type 2024 & 2032
- Figure 21: South America Cell Density Meter Revenue Share (%), by Type 2024 & 2032
- Figure 22: South America Cell Density Meter Volume Share (%), by Type 2024 & 2032
- Figure 23: South America Cell Density Meter Revenue (million), by Country 2024 & 2032
- Figure 24: South America Cell Density Meter Volume (K), by Country 2024 & 2032
- Figure 25: South America Cell Density Meter Revenue Share (%), by Country 2024 & 2032
- Figure 26: South America Cell Density Meter Volume Share (%), by Country 2024 & 2032
- Figure 27: Europe Cell Density Meter Revenue (million), by Application 2024 & 2032
- Figure 28: Europe Cell Density Meter Volume (K), by Application 2024 & 2032
- Figure 29: Europe Cell Density Meter Revenue Share (%), by Application 2024 & 2032
- Figure 30: Europe Cell Density Meter Volume Share (%), by Application 2024 & 2032
- Figure 31: Europe Cell Density Meter Revenue (million), by Type 2024 & 2032
- Figure 32: Europe Cell Density Meter Volume (K), by Type 2024 & 2032
- Figure 33: Europe Cell Density Meter Revenue Share (%), by Type 2024 & 2032
- Figure 34: Europe Cell Density Meter Volume Share (%), by Type 2024 & 2032
- Figure 35: Europe Cell Density Meter Revenue (million), by Country 2024 & 2032
- Figure 36: Europe Cell Density Meter Volume (K), by Country 2024 & 2032
- Figure 37: Europe Cell Density Meter Revenue Share (%), by Country 2024 & 2032
- Figure 38: Europe Cell Density Meter Volume Share (%), by Country 2024 & 2032
- Figure 39: Middle East & Africa Cell Density Meter Revenue (million), by Application 2024 & 2032
- Figure 40: Middle East & Africa Cell Density Meter Volume (K), by Application 2024 & 2032
- Figure 41: Middle East & Africa Cell Density Meter Revenue Share (%), by Application 2024 & 2032
- Figure 42: Middle East & Africa Cell Density Meter Volume Share (%), by Application 2024 & 2032
- Figure 43: Middle East & Africa Cell Density Meter Revenue (million), by Type 2024 & 2032
- Figure 44: Middle East & Africa Cell Density Meter Volume (K), by Type 2024 & 2032
- Figure 45: Middle East & Africa Cell Density Meter Revenue Share (%), by Type 2024 & 2032
- Figure 46: Middle East & Africa Cell Density Meter Volume Share (%), by Type 2024 & 2032
- Figure 47: Middle East & Africa Cell Density Meter Revenue (million), by Country 2024 & 2032
- Figure 48: Middle East & Africa Cell Density Meter Volume (K), by Country 2024 & 2032
- Figure 49: Middle East & Africa Cell Density Meter Revenue Share (%), by Country 2024 & 2032
- Figure 50: Middle East & Africa Cell Density Meter Volume Share (%), by Country 2024 & 2032
- Figure 51: Asia Pacific Cell Density Meter Revenue (million), by Application 2024 & 2032
- Figure 52: Asia Pacific Cell Density Meter Volume (K), by Application 2024 & 2032
- Figure 53: Asia Pacific Cell Density Meter Revenue Share (%), by Application 2024 & 2032
- Figure 54: Asia Pacific Cell Density Meter Volume Share (%), by Application 2024 & 2032
- Figure 55: Asia Pacific Cell Density Meter Revenue (million), by Type 2024 & 2032
- Figure 56: Asia Pacific Cell Density Meter Volume (K), by Type 2024 & 2032
- Figure 57: Asia Pacific Cell Density Meter Revenue Share (%), by Type 2024 & 2032
- Figure 58: Asia Pacific Cell Density Meter Volume Share (%), by Type 2024 & 2032
- Figure 59: Asia Pacific Cell Density Meter Revenue (million), by Country 2024 & 2032
- Figure 60: Asia Pacific Cell Density Meter Volume (K), by Country 2024 & 2032
- Figure 61: Asia Pacific Cell Density Meter Revenue Share (%), by Country 2024 & 2032
- Figure 62: Asia Pacific Cell Density Meter Volume Share (%), by Country 2024 & 2032
List of Tables
- Table 1: Global Cell Density Meter Revenue million Forecast, by Region 2019 & 2032
- Table 2: Global Cell Density Meter Volume K Forecast, by Region 2019 & 2032
- Table 3: Global Cell Density Meter Revenue million Forecast, by Application 2019 & 2032
- Table 4: Global Cell Density Meter Volume K Forecast, by Application 2019 & 2032
- Table 5: Global Cell Density Meter Revenue million Forecast, by Type 2019 & 2032
- Table 6: Global Cell Density Meter Volume K Forecast, by Type 2019 & 2032
- Table 7: Global Cell Density Meter Revenue million Forecast, by Region 2019 & 2032
- Table 8: Global Cell Density Meter Volume K Forecast, by Region 2019 & 2032
- Table 9: Global Cell Density Meter Revenue million Forecast, by Application 2019 & 2032
- Table 10: Global Cell Density Meter Volume K Forecast, by Application 2019 & 2032
- Table 11: Global Cell Density Meter Revenue million Forecast, by Type 2019 & 2032
- Table 12: Global Cell Density Meter Volume K Forecast, by Type 2019 & 2032
- Table 13: Global Cell Density Meter Revenue million Forecast, by Country 2019 & 2032
- Table 14: Global Cell Density Meter Volume K Forecast, by Country 2019 & 2032
- Table 15: United States Cell Density Meter Revenue (million) Forecast, by Application 2019 & 2032
- Table 16: United States Cell Density Meter Volume (K) Forecast, by Application 2019 & 2032
- Table 17: Canada Cell Density Meter Revenue (million) Forecast, by Application 2019 & 2032
- Table 18: Canada Cell Density Meter Volume (K) Forecast, by Application 2019 & 2032
- Table 19: Mexico Cell Density Meter Revenue (million) Forecast, by Application 2019 & 2032
- Table 20: Mexico Cell Density Meter Volume (K) Forecast, by Application 2019 & 2032
- Table 21: Global Cell Density Meter Revenue million Forecast, by Application 2019 & 2032
- Table 22: Global Cell Density Meter Volume K Forecast, by Application 2019 & 2032
- Table 23: Global Cell Density Meter Revenue million Forecast, by Type 2019 & 2032
- Table 24: Global Cell Density Meter Volume K Forecast, by Type 2019 & 2032
- Table 25: Global Cell Density Meter Revenue million Forecast, by Country 2019 & 2032
- Table 26: Global Cell Density Meter Volume K Forecast, by Country 2019 & 2032
- Table 27: Brazil Cell Density Meter Revenue (million) Forecast, by Application 2019 & 2032
- Table 28: Brazil Cell Density Meter Volume (K) Forecast, by Application 2019 & 2032
- Table 29: Argentina Cell Density Meter Revenue (million) Forecast, by Application 2019 & 2032
- Table 30: Argentina Cell Density Meter Volume (K) Forecast, by Application 2019 & 2032
- Table 31: Rest of South America Cell Density Meter Revenue (million) Forecast, by Application 2019 & 2032
- Table 32: Rest of South America Cell Density Meter Volume (K) Forecast, by Application 2019 & 2032
- Table 33: Global Cell Density Meter Revenue million Forecast, by Application 2019 & 2032
- Table 34: Global Cell Density Meter Volume K Forecast, by Application 2019 & 2032
- Table 35: Global Cell Density Meter Revenue million Forecast, by Type 2019 & 2032
- Table 36: Global Cell Density Meter Volume K Forecast, by Type 2019 & 2032
- Table 37: Global Cell Density Meter Revenue million Forecast, by Country 2019 & 2032
- Table 38: Global Cell Density Meter Volume K Forecast, by Country 2019 & 2032
- Table 39: United Kingdom Cell Density Meter Revenue (million) Forecast, by Application 2019 & 2032
- Table 40: United Kingdom Cell Density Meter Volume (K) Forecast, by Application 2019 & 2032
- Table 41: Germany Cell Density Meter Revenue (million) Forecast, by Application 2019 & 2032
- Table 42: Germany Cell Density Meter Volume (K) Forecast, by Application 2019 & 2032
- Table 43: France Cell Density Meter Revenue (million) Forecast, by Application 2019 & 2032
- Table 44: France Cell Density Meter Volume (K) Forecast, by Application 2019 & 2032
- Table 45: Italy Cell Density Meter Revenue (million) Forecast, by Application 2019 & 2032
- Table 46: Italy Cell Density Meter Volume (K) Forecast, by Application 2019 & 2032
- Table 47: Spain Cell Density Meter Revenue (million) Forecast, by Application 2019 & 2032
- Table 48: Spain Cell Density Meter Volume (K) Forecast, by Application 2019 & 2032
- Table 49: Russia Cell Density Meter Revenue (million) Forecast, by Application 2019 & 2032
- Table 50: Russia Cell Density Meter Volume (K) Forecast, by Application 2019 & 2032
- Table 51: Benelux Cell Density Meter Revenue (million) Forecast, by Application 2019 & 2032
- Table 52: Benelux Cell Density Meter Volume (K) Forecast, by Application 2019 & 2032
- Table 53: Nordics Cell Density Meter Revenue (million) Forecast, by Application 2019 & 2032
- Table 54: Nordics Cell Density Meter Volume (K) Forecast, by Application 2019 & 2032
- Table 55: Rest of Europe Cell Density Meter Revenue (million) Forecast, by Application 2019 & 2032
- Table 56: Rest of Europe Cell Density Meter Volume (K) Forecast, by Application 2019 & 2032
- Table 57: Global Cell Density Meter Revenue million Forecast, by Application 2019 & 2032
- Table 58: Global Cell Density Meter Volume K Forecast, by Application 2019 & 2032
- Table 59: Global Cell Density Meter Revenue million Forecast, by Type 2019 & 2032
- Table 60: Global Cell Density Meter Volume K Forecast, by Type 2019 & 2032
- Table 61: Global Cell Density Meter Revenue million Forecast, by Country 2019 & 2032
- Table 62: Global Cell Density Meter Volume K Forecast, by Country 2019 & 2032
- Table 63: Turkey Cell Density Meter Revenue (million) Forecast, by Application 2019 & 2032
- Table 64: Turkey Cell Density Meter Volume (K) Forecast, by Application 2019 & 2032
- Table 65: Israel Cell Density Meter Revenue (million) Forecast, by Application 2019 & 2032
- Table 66: Israel Cell Density Meter Volume (K) Forecast, by Application 2019 & 2032
- Table 67: GCC Cell Density Meter Revenue (million) Forecast, by Application 2019 & 2032
- Table 68: GCC Cell Density Meter Volume (K) Forecast, by Application 2019 & 2032
- Table 69: North Africa Cell Density Meter Revenue (million) Forecast, by Application 2019 & 2032
- Table 70: North Africa Cell Density Meter Volume (K) Forecast, by Application 2019 & 2032
- Table 71: South Africa Cell Density Meter Revenue (million) Forecast, by Application 2019 & 2032
- Table 72: South Africa Cell Density Meter Volume (K) Forecast, by Application 2019 & 2032
- Table 73: Rest of Middle East & Africa Cell Density Meter Revenue (million) Forecast, by Application 2019 & 2032
- Table 74: Rest of Middle East & Africa Cell Density Meter Volume (K) Forecast, by Application 2019 & 2032
- Table 75: Global Cell Density Meter Revenue million Forecast, by Application 2019 & 2032
- Table 76: Global Cell Density Meter Volume K Forecast, by Application 2019 & 2032
- Table 77: Global Cell Density Meter Revenue million Forecast, by Type 2019 & 2032
- Table 78: Global Cell Density Meter Volume K Forecast, by Type 2019 & 2032
- Table 79: Global Cell Density Meter Revenue million Forecast, by Country 2019 & 2032
- Table 80: Global Cell Density Meter Volume K Forecast, by Country 2019 & 2032
- Table 81: China Cell Density Meter Revenue (million) Forecast, by Application 2019 & 2032
- Table 82: China Cell Density Meter Volume (K) Forecast, by Application 2019 & 2032
- Table 83: India Cell Density Meter Revenue (million) Forecast, by Application 2019 & 2032
- Table 84: India Cell Density Meter Volume (K) Forecast, by Application 2019 & 2032
- Table 85: Japan Cell Density Meter Revenue (million) Forecast, by Application 2019 & 2032
- Table 86: Japan Cell Density Meter Volume (K) Forecast, by Application 2019 & 2032
- Table 87: South Korea Cell Density Meter Revenue (million) Forecast, by Application 2019 & 2032
- Table 88: South Korea Cell Density Meter Volume (K) Forecast, by Application 2019 & 2032
- Table 89: ASEAN Cell Density Meter Revenue (million) Forecast, by Application 2019 & 2032
- Table 90: ASEAN Cell Density Meter Volume (K) Forecast, by Application 2019 & 2032
- Table 91: Oceania Cell Density Meter Revenue (million) Forecast, by Application 2019 & 2032
- Table 92: Oceania Cell Density Meter Volume (K) Forecast, by Application 2019 & 2032
- Table 93: Rest of Asia Pacific Cell Density Meter Revenue (million) Forecast, by Application 2019 & 2032
- Table 94: Rest of Asia Pacific Cell Density Meter Volume (K) Forecast, by Application 2019 & 2032
Frequently Asked Questions
1. What is the projected Compound Annual Growth Rate (CAGR) of the Cell Density Meter?
The projected CAGR is approximately 3.9%.
2. Which companies are prominent players in the Cell Density Meter?
Key companies in the market include Mettler Toledo, Erba Mannheim, Laxco, Biochrom.
3. What are the main segments of the Cell Density Meter?
The market segments include Application, Type.
4. Can you provide details about the market size?
The market size is estimated to be USD 394 million as of 2022.
5. What are some drivers contributing to market growth?
N/A
6. What are the notable trends driving market growth?
N/A
7. Are there any restraints impacting market growth?
N/A
8. Can you provide examples of recent developments in the market?
N/A
9. What pricing options are available for accessing the report?
Pricing options include single-user, multi-user, and enterprise licenses priced at USD 3950.00, USD 5925.00, and USD 7900.00 respectively.
10. Is the market size provided in terms of value or volume?
The market size is provided in terms of value, measured in million and volume, measured in K.
11. Are there any specific market keywords associated with the report?
Yes, the market keyword associated with the report is "Cell Density Meter," which aids in identifying and referencing the specific market segment covered.
12. How do I determine which pricing option suits my needs best?
The pricing options vary based on user requirements and access needs. Individual users may opt for single-user licenses, while businesses requiring broader access may choose multi-user or enterprise licenses for cost-effective access to the report.
13. Are there any additional resources or data provided in the Cell Density Meter report?
While the report offers comprehensive insights, it's advisable to review the specific contents or supplementary materials provided to ascertain if additional resources or data are available.
14. How can I stay updated on further developments or reports in the Cell Density Meter?
To stay informed about further developments, trends, and reports in the Cell Density Meter, consider subscribing to industry newsletters, following relevant companies and organizations, or regularly checking reputable industry news sources and publications.
Methodology
Step 1 - Identification of Relevant Samples Size from Population Database


Step 2 - Approaches for Defining Global Market Size (Value, Volume* & Price*)

Note*: In applicable scenarios
Step 3 - Data Sources
Primary Research
- Web Analytics
- Survey Reports
- Research Institute
- Latest Research Reports
- Opinion Leaders
Secondary Research
- Annual Reports
- White Paper
- Latest Press Release
- Industry Association
- Paid Database
- Investor Presentations

Step 4 - Data Triangulation
Involves using different sources of information in order to increase the validity of a study
These sources are likely to be stakeholders in a program - participants, other researchers, program staff, other community members, and so on.
Then we put all data in single framework & apply various statistical tools to find out the dynamic on the market.
During the analysis stage, feedback from the stakeholder groups would be compared to determine areas of agreement as well as areas of divergence
