

Key Insights
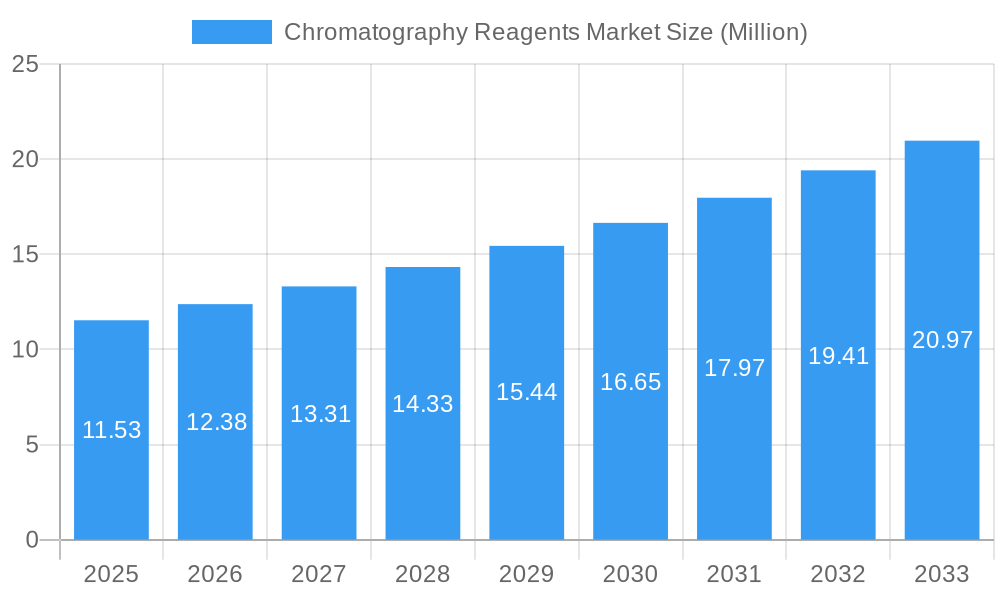
The Chromatography Reagents market is experiencing robust growth, projected to reach \$11.53 million in 2025 and maintain a Compound Annual Growth Rate (CAGR) exceeding 7% through 2033. This expansion is driven by several key factors. Firstly, the increasing demand for advanced analytical techniques across diverse sectors, including pharmaceuticals, food and beverage safety testing, and environmental monitoring, fuels the need for high-quality chromatography reagents. Secondly, technological advancements in chromatography techniques, such as the rise of Super Critical Fluid Chromatography (SFC), are creating new application areas and driving market growth. The pharmaceutical industry, in particular, is a major contributor, with stringent regulatory requirements necessitating precise and reliable analytical methods. Further driving growth is the expanding research and development activities globally, along with the growing adoption of advanced analytical instruments and automation in laboratories.
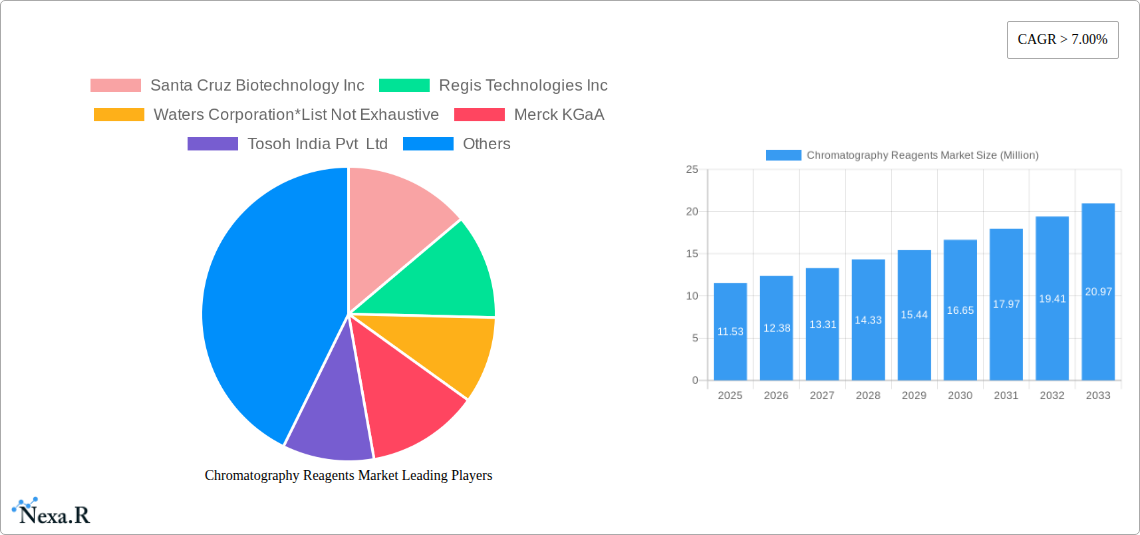
Chromatography Reagents Market Market Size (In Million)
However, certain restraints exist. Price fluctuations in raw materials, particularly for specialized solvents and reagents, can impact profitability. Furthermore, the market is characterized by intense competition among established players and emerging companies. This necessitates continuous innovation and product differentiation to maintain a competitive edge. Market segmentation reveals strong demand for liquid chromatography reagents, reflecting the widespread use of HPLC and UPLC techniques. Geographically, the Asia-Pacific region, driven by strong growth in emerging economies like China and India, is expected to be a key growth area, offering significant opportunities for market players. The North American market, while mature, continues to be significant due to the robust presence of pharmaceutical and biotech companies. Successful players will be those that can effectively cater to the specialized needs of various applications and regions, offering tailored solutions and superior customer service.
Chromatography Reagents Market Company Market Share
Chromatography Reagents Market: A Comprehensive Report (2019-2033)
This comprehensive report provides a detailed analysis of the Chromatography Reagents market, encompassing market dynamics, growth trends, regional dominance, product landscape, key players, and future outlook. The study period spans from 2019 to 2033, with 2025 serving as the base and estimated year. The report utilizes data from the historical period (2019-2024) to project market trends and growth during the forecast period (2025-2033). The market is valued at xx Million in 2025 and is projected to reach xx Million by 2033, exhibiting a CAGR of xx%. This report caters to industry professionals, investors, and researchers seeking a thorough understanding of this dynamic sector.
Chromatography Reagents Market Dynamics & Structure
The Chromatography Reagents market is characterized by moderate concentration, with key players holding significant market share. The market size in 2025 is estimated at xx Million. Technological innovation, particularly in advanced chromatography techniques (e.g., UHPLC, SFC), is a major driver. Stringent regulatory frameworks governing reagent quality and safety, coupled with increasing demand for high-purity reagents, shape market dynamics. Competitive pressures from substitute products (e.g., alternative separation techniques) exist, influencing pricing and innovation strategies. The end-user demographics are diverse, including pharmaceutical, food & beverage, and environmental testing sectors. M&A activity in the sector is moderate, with xx deals recorded between 2019-2024, primarily focused on expanding product portfolios and geographic reach.
- Market Concentration: Moderately concentrated, with top 5 players holding approximately xx% market share in 2025.
- Technological Innovation: Strong driver, with continuous development of high-performance reagents and advanced chromatography techniques.
- Regulatory Frameworks: Stringent regulations ensure reagent quality and safety, influencing production costs and market access.
- Competitive Substitutes: Alternative separation methods create competitive pressure, requiring continuous innovation.
- End-User Demographics: Diverse, encompassing pharmaceutical, food and beverage, environmental testing, and other specialized sectors.
- M&A Trends: Moderate activity, focused on portfolio expansion and market penetration.
Chromatography Reagents Market Growth Trends & Insights
The Chromatography Reagents market has exhibited consistent growth over the historical period (2019-2024), driven by increasing demand from various application sectors. The market size increased from xx Million in 2019 to xx Million in 2024, showcasing a CAGR of xx%. This growth is fueled by technological advancements, expanding research activities (particularly in pharmaceuticals and biopharmaceuticals), and stricter environmental regulations. Increased adoption of advanced chromatography techniques like UHPLC (Ultra-High Performance Liquid Chromatography) and SFC (Supercritical Fluid Chromatography) is further boosting market expansion. Consumer behavior is shifting towards preference for high-performance, eco-friendly reagents.
Market penetration of advanced chromatography techniques is steadily increasing, with xx% of the market adopting UHPLC in 2024. The adoption of SFC is growing at a CAGR of xx%, reflecting the technology's growing acceptance. These trends indicate continued market expansion in the forecast period (2025-2033), although the pace of growth may moderate due to economic factors and potential supply chain constraints.
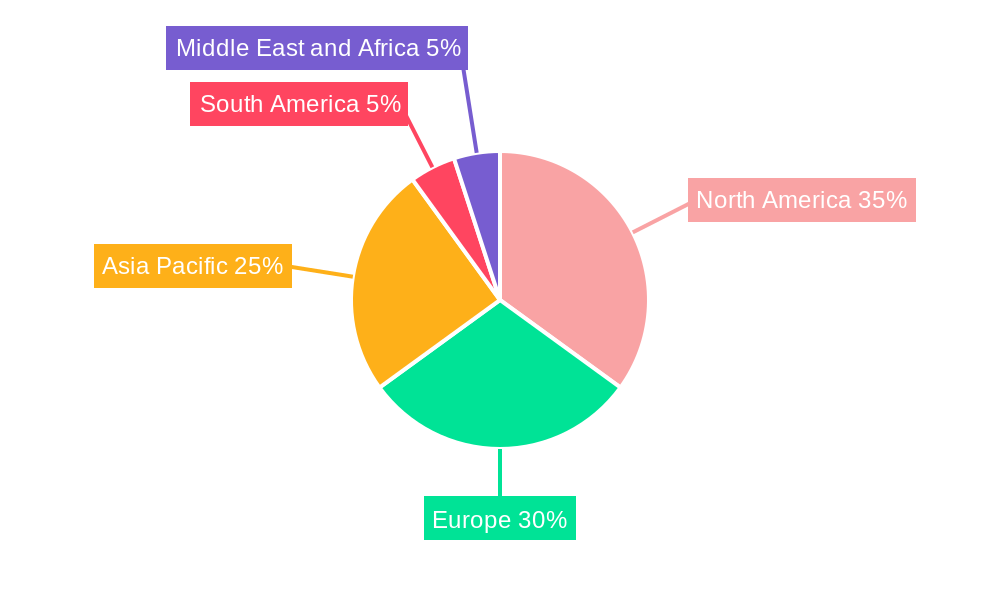
Dominant Regions, Countries, or Segments in Chromatography Reagents Market
North America currently dominates the Chromatography Reagents market, holding approximately xx% of the global market share in 2025. This dominance is attributed to a robust pharmaceutical and biotechnology industry, advanced research infrastructure, and high technological adoption rates. Europe holds the second-largest market share (approximately xx%), driven by strong demand from the pharmaceutical and environmental testing sectors. Asia-Pacific is experiencing rapid growth, projected to exhibit the highest CAGR (xx%) during the forecast period, fueled by increasing investments in research and development and the expansion of pharmaceutical manufacturing facilities.
- By Type: Liquid Chromatography Reagents holds the largest market share (xx%), followed by Gas Chromatography Reagents (xx%) and Super Critical Fluid Chromatography (SFC) Reagents (xx%). The "Other Types" segment is growing at a faster rate.
- By Application: The Pharmaceutical segment is the dominant application area, accounting for xx% of the market in 2025, followed by Food and Beverages (xx%) and Water and Environmental Analysis (xx%).
- Regional Dominance: North America and Europe lead in market share and technological advancement; the Asia-Pacific region exhibits significant growth potential.
Chromatography Reagents Market Product Landscape
The Chromatography Reagents market offers a diverse product landscape, encompassing various types of buffers, ion-pair reagents, solvents, and derivatization reagents. Innovations focus on improved purity, enhanced performance characteristics (e.g., increased sensitivity, reduced analysis time), and eco-friendly formulations. Unique selling propositions include specialized reagents optimized for specific applications and streamlined reagent kits for ease of use. Technological advancements center on developing high-performance reagents for advanced chromatography techniques like UHPLC and SFC.
Key Drivers, Barriers & Challenges in Chromatography Reagents Market
Key Drivers: Increasing demand from pharmaceutical and biotechnology sectors, stringent environmental regulations driving the need for advanced analytical techniques, technological advancements leading to improved reagent performance, and growing adoption of advanced chromatography techniques.
Key Challenges: Fluctuations in raw material prices, stringent regulatory approvals for new reagents, intense competition leading to price pressures, and potential supply chain disruptions. These challenges could impact market growth by xx% if not addressed effectively.
Emerging Opportunities in Chromatography Reagents Market
Emerging opportunities lie in the development of specialized reagents for niche applications (e.g., personalized medicine, advanced materials characterization), the increasing adoption of green chemistry principles to develop eco-friendly reagents, and the expansion into emerging markets with high growth potential (e.g., Southeast Asia, Latin America).
Growth Accelerators in the Chromatography Reagents Market Industry
Strategic partnerships between reagent manufacturers and instrument providers, investments in R&D focused on developing advanced reagents, and expansion into new geographic markets are key growth catalysts. The development of novel chromatography techniques and the increasing demand from emerging applications, like the burgeoning field of biosimilars, will propel continued market growth.
Key Players Shaping the Chromatography Reagents Market Market
- Santa Cruz Biotechnology Inc
- Regis Technologies Inc
- Waters Corporation
- Merck KGaA
- Tosoh India Pvt Ltd
- ITW Reagents
- Thermo Fisher Scientific Inc
- Agilent Technologies Inc
- Avantor Inc
- Tokyo Chemical Industry
- Shimadzu Corporation
Notable Milestones in Chromatography Reagents Market Sector
- March 2023: Avantor was awarded the Best Bioprocessing Company for Chromatography at the Asia-Pacific Bioprocessing Excellence Awards 2023 (ABEA), highlighting its innovative chromatography solutions.
- December 2022: Tokyo Chemical Industry discontinued the sale of certain chromatography products, impacting market supply for specific reagents.
In-Depth Chromatography Reagents Market Market Outlook
The Chromatography Reagents market is poised for continued growth, driven by ongoing technological advancements, expanding application areas, and increasing demand from emerging economies. Strategic partnerships and investments in R&D will play crucial roles in shaping future market dynamics. The market's long-term potential is significant, offering substantial opportunities for existing and new players alike to capitalize on innovative solutions and expanding market segments.
Chromatography Reagents Market Segmentation
-
1. Type
- 1.1. Buffers
- 1.2. Ion Pair Reagents
- 1.3. Solvents
- 1.4. Other Types (Derivatization Reagents, Etc.)
-
2. Physical State of Mobile Phase
- 2.1. Gas Chromatography Reagents
- 2.2. Liquid Chromatography Reagents
- 2.3. Super Critical Fluid Chromatography (SFC) Reagents
-
3. Technology
- 3.1. Ion Exchange
- 3.2. Affinity Exchange
- 3.3. Size Exclusion
- 3.4. Hydrophobic Interaction
- 3.5. Mixed Mode
- 3.6. Other Te
-
4. Application
- 4.1. Pharmaceutical
- 4.2. Food and Beverages
- 4.3. Water and Environmental Analysis
- 4.4. Other Ap
Chromatography Reagents Market Segmentation By Geography
-
1. Asia Pacific
- 1.1. China
- 1.2. India
- 1.3. Japan
- 1.4. South Korea
- 1.5. Rest of Asia Pacific
-
2. North America
- 2.1. United States
- 2.2. Canada
- 2.3. Mexico
-
3. Europe
- 3.1. Germany
- 3.2. United Kingdom
- 3.3. Italy
- 3.4. France
- 3.5. Rest of Europe
-
4. South America
- 4.1. Brazil
- 4.2. Argentina
- 4.3. Rest of South America
-
5. Middle East and Africa
- 5.1. Saudi Arabia
- 5.2. South Africa
- 5.3. Rest of Middle East and Africa
Chromatography Reagents Market Regional Market Share
Geographic Coverage of Chromatography Reagents Market
Chromatography Reagents Market REPORT HIGHLIGHTS
| Aspects | Details |
|---|---|
| Study Period | 2020-2034 |
| Base Year | 2025 |
| Estimated Year | 2026 |
| Forecast Period | 2026-2034 |
| Historical Period | 2020-2025 |
| Growth Rate | CAGR of 5.8% from 2020-2034 |
| Segmentation |
|
Table of Contents
- 1. Introduction
- 1.1. Research Scope
- 1.2. Market Segmentation
- 1.3. Research Objective
- 1.4. Definitions and Assumptions
- 2. Executive Summary
- 2.1. Market Snapshot
- 3. Market Dynamics
- 3.1. Market Drivers
- 3.2. Market Restrains
- 3.3. Market Trends
- 3.4. Market Opportunities
- 4. Market Factor Analysis
- 4.1. Porters Five Forces
- 4.1.1. Bargaining Power of Suppliers
- 4.1.2. Bargaining Power of Buyers
- 4.1.3. Threat of New Entrants
- 4.1.4. Threat of Substitutes
- 4.1.5. Competitive Rivalry
- 4.2. PESTEL analysis
- 4.3. BCG Analysis
- 4.3.1. Stars (High Growth, High Market Share)
- 4.3.2. Cash Cows (Low Growth, High Market Share)
- 4.3.3. Question Mark (High Growth, Low Market Share)
- 4.3.4. Dogs (Low Growth, Low Market Share)
- 4.4. Ansoff Matrix Analysis
- 4.5. Supply Chain Analysis
- 4.6. Regulatory Landscape
- 4.7. Current Market Potential and Opportunity Assessment (TAM–SAM–SOM Framework)
- 4.8. NRP Analyst Note
- 4.1. Porters Five Forces
- 5. Market Analysis, Insights and Forecast 2021-2033
- 5.1. Market Analysis, Insights and Forecast - by Type
- 5.1.1. Buffers
- 5.1.2. Ion Pair Reagents
- 5.1.3. Solvents
- 5.1.4. Other Types (Derivatization Reagents, Etc.)
- 5.2. Market Analysis, Insights and Forecast - by Physical State of Mobile Phase
- 5.2.1. Gas Chromatography Reagents
- 5.2.2. Liquid Chromatography Reagents
- 5.2.3. Super Critical Fluid Chromatography (SFC) Reagents
- 5.3. Market Analysis, Insights and Forecast - by Technology
- 5.3.1. Ion Exchange
- 5.3.2. Affinity Exchange
- 5.3.3. Size Exclusion
- 5.3.4. Hydrophobic Interaction
- 5.3.5. Mixed Mode
- 5.3.6. Other Te
- 5.4. Market Analysis, Insights and Forecast - by Application
- 5.4.1. Pharmaceutical
- 5.4.2. Food and Beverages
- 5.4.3. Water and Environmental Analysis
- 5.4.4. Other Ap
- 5.5. Market Analysis, Insights and Forecast - by Region
- 5.5.1. Asia Pacific
- 5.5.2. North America
- 5.5.3. Europe
- 5.5.4. South America
- 5.5.5. Middle East and Africa
- 5.1. Market Analysis, Insights and Forecast - by Type
- 6. Global Chromatography Reagents Market Analysis, Insights and Forecast, 2021-2033
- 6.1. Market Analysis, Insights and Forecast - by Type
- 6.1.1. Buffers
- 6.1.2. Ion Pair Reagents
- 6.1.3. Solvents
- 6.1.4. Other Types (Derivatization Reagents, Etc.)
- 6.2. Market Analysis, Insights and Forecast - by Physical State of Mobile Phase
- 6.2.1. Gas Chromatography Reagents
- 6.2.2. Liquid Chromatography Reagents
- 6.2.3. Super Critical Fluid Chromatography (SFC) Reagents
- 6.3. Market Analysis, Insights and Forecast - by Technology
- 6.3.1. Ion Exchange
- 6.3.2. Affinity Exchange
- 6.3.3. Size Exclusion
- 6.3.4. Hydrophobic Interaction
- 6.3.5. Mixed Mode
- 6.3.6. Other Te
- 6.4. Market Analysis, Insights and Forecast - by Application
- 6.4.1. Pharmaceutical
- 6.4.2. Food and Beverages
- 6.4.3. Water and Environmental Analysis
- 6.4.4. Other Ap
- 6.1. Market Analysis, Insights and Forecast - by Type
- 7. Asia Pacific Chromatography Reagents Market Analysis, Insights and Forecast, 2020-2032
- 7.1. Market Analysis, Insights and Forecast - by Type
- 7.1.1. Buffers
- 7.1.2. Ion Pair Reagents
- 7.1.3. Solvents
- 7.1.4. Other Types (Derivatization Reagents, Etc.)
- 7.2. Market Analysis, Insights and Forecast - by Physical State of Mobile Phase
- 7.2.1. Gas Chromatography Reagents
- 7.2.2. Liquid Chromatography Reagents
- 7.2.3. Super Critical Fluid Chromatography (SFC) Reagents
- 7.3. Market Analysis, Insights and Forecast - by Technology
- 7.3.1. Ion Exchange
- 7.3.2. Affinity Exchange
- 7.3.3. Size Exclusion
- 7.3.4. Hydrophobic Interaction
- 7.3.5. Mixed Mode
- 7.3.6. Other Te
- 7.4. Market Analysis, Insights and Forecast - by Application
- 7.4.1. Pharmaceutical
- 7.4.2. Food and Beverages
- 7.4.3. Water and Environmental Analysis
- 7.4.4. Other Ap
- 7.1. Market Analysis, Insights and Forecast - by Type
- 8. North America Chromatography Reagents Market Analysis, Insights and Forecast, 2020-2032
- 8.1. Market Analysis, Insights and Forecast - by Type
- 8.1.1. Buffers
- 8.1.2. Ion Pair Reagents
- 8.1.3. Solvents
- 8.1.4. Other Types (Derivatization Reagents, Etc.)
- 8.2. Market Analysis, Insights and Forecast - by Physical State of Mobile Phase
- 8.2.1. Gas Chromatography Reagents
- 8.2.2. Liquid Chromatography Reagents
- 8.2.3. Super Critical Fluid Chromatography (SFC) Reagents
- 8.3. Market Analysis, Insights and Forecast - by Technology
- 8.3.1. Ion Exchange
- 8.3.2. Affinity Exchange
- 8.3.3. Size Exclusion
- 8.3.4. Hydrophobic Interaction
- 8.3.5. Mixed Mode
- 8.3.6. Other Te
- 8.4. Market Analysis, Insights and Forecast - by Application
- 8.4.1. Pharmaceutical
- 8.4.2. Food and Beverages
- 8.4.3. Water and Environmental Analysis
- 8.4.4. Other Ap
- 8.1. Market Analysis, Insights and Forecast - by Type
- 9. Europe Chromatography Reagents Market Analysis, Insights and Forecast, 2020-2032
- 9.1. Market Analysis, Insights and Forecast - by Type
- 9.1.1. Buffers
- 9.1.2. Ion Pair Reagents
- 9.1.3. Solvents
- 9.1.4. Other Types (Derivatization Reagents, Etc.)
- 9.2. Market Analysis, Insights and Forecast - by Physical State of Mobile Phase
- 9.2.1. Gas Chromatography Reagents
- 9.2.2. Liquid Chromatography Reagents
- 9.2.3. Super Critical Fluid Chromatography (SFC) Reagents
- 9.3. Market Analysis, Insights and Forecast - by Technology
- 9.3.1. Ion Exchange
- 9.3.2. Affinity Exchange
- 9.3.3. Size Exclusion
- 9.3.4. Hydrophobic Interaction
- 9.3.5. Mixed Mode
- 9.3.6. Other Te
- 9.4. Market Analysis, Insights and Forecast - by Application
- 9.4.1. Pharmaceutical
- 9.4.2. Food and Beverages
- 9.4.3. Water and Environmental Analysis
- 9.4.4. Other Ap
- 9.1. Market Analysis, Insights and Forecast - by Type
- 10. South America Chromatography Reagents Market Analysis, Insights and Forecast, 2020-2032
- 10.1. Market Analysis, Insights and Forecast - by Type
- 10.1.1. Buffers
- 10.1.2. Ion Pair Reagents
- 10.1.3. Solvents
- 10.1.4. Other Types (Derivatization Reagents, Etc.)
- 10.2. Market Analysis, Insights and Forecast - by Physical State of Mobile Phase
- 10.2.1. Gas Chromatography Reagents
- 10.2.2. Liquid Chromatography Reagents
- 10.2.3. Super Critical Fluid Chromatography (SFC) Reagents
- 10.3. Market Analysis, Insights and Forecast - by Technology
- 10.3.1. Ion Exchange
- 10.3.2. Affinity Exchange
- 10.3.3. Size Exclusion
- 10.3.4. Hydrophobic Interaction
- 10.3.5. Mixed Mode
- 10.3.6. Other Te
- 10.4. Market Analysis, Insights and Forecast - by Application
- 10.4.1. Pharmaceutical
- 10.4.2. Food and Beverages
- 10.4.3. Water and Environmental Analysis
- 10.4.4. Other Ap
- 10.1. Market Analysis, Insights and Forecast - by Type
- 11. Middle East and Africa Chromatography Reagents Market Analysis, Insights and Forecast, 2020-2032
- 11.1. Market Analysis, Insights and Forecast - by Type
- 11.1.1. Buffers
- 11.1.2. Ion Pair Reagents
- 11.1.3. Solvents
- 11.1.4. Other Types (Derivatization Reagents, Etc.)
- 11.2. Market Analysis, Insights and Forecast - by Physical State of Mobile Phase
- 11.2.1. Gas Chromatography Reagents
- 11.2.2. Liquid Chromatography Reagents
- 11.2.3. Super Critical Fluid Chromatography (SFC) Reagents
- 11.3. Market Analysis, Insights and Forecast - by Technology
- 11.3.1. Ion Exchange
- 11.3.2. Affinity Exchange
- 11.3.3. Size Exclusion
- 11.3.4. Hydrophobic Interaction
- 11.3.5. Mixed Mode
- 11.3.6. Other Te
- 11.4. Market Analysis, Insights and Forecast - by Application
- 11.4.1. Pharmaceutical
- 11.4.2. Food and Beverages
- 11.4.3. Water and Environmental Analysis
- 11.4.4. Other Ap
- 11.1. Market Analysis, Insights and Forecast - by Type
- 12. Competitive Analysis
- 12.1. Company Profiles
- 12.1.1 Santa Cruz Biotechnology Inc
- 12.1.1.1. Company Overview
- 12.1.1.2. Products
- 12.1.1.3. Company Financials
- 12.1.1.4. SWOT Analysis
- 12.1.2 Regis Technologies Inc
- 12.1.2.1. Company Overview
- 12.1.2.2. Products
- 12.1.2.3. Company Financials
- 12.1.2.4. SWOT Analysis
- 12.1.3 Waters Corporation*List Not Exhaustive
- 12.1.3.1. Company Overview
- 12.1.3.2. Products
- 12.1.3.3. Company Financials
- 12.1.3.4. SWOT Analysis
- 12.1.4 Merck KGaA
- 12.1.4.1. Company Overview
- 12.1.4.2. Products
- 12.1.4.3. Company Financials
- 12.1.4.4. SWOT Analysis
- 12.1.5 Tosoh India Pvt Ltd
- 12.1.5.1. Company Overview
- 12.1.5.2. Products
- 12.1.5.3. Company Financials
- 12.1.5.4. SWOT Analysis
- 12.1.6 ITW Reagents
- 12.1.6.1. Company Overview
- 12.1.6.2. Products
- 12.1.6.3. Company Financials
- 12.1.6.4. SWOT Analysis
- 12.1.7 Thermo Fisher Scientific Inc
- 12.1.7.1. Company Overview
- 12.1.7.2. Products
- 12.1.7.3. Company Financials
- 12.1.7.4. SWOT Analysis
- 12.1.8 Agilent Technologies Inc
- 12.1.8.1. Company Overview
- 12.1.8.2. Products
- 12.1.8.3. Company Financials
- 12.1.8.4. SWOT Analysis
- 12.1.9 Avantor Inc
- 12.1.9.1. Company Overview
- 12.1.9.2. Products
- 12.1.9.3. Company Financials
- 12.1.9.4. SWOT Analysis
- 12.1.10 Tokyo Chemical Industry
- 12.1.10.1. Company Overview
- 12.1.10.2. Products
- 12.1.10.3. Company Financials
- 12.1.10.4. SWOT Analysis
- 12.1.11 Shimadzu Corporation
- 12.1.11.1. Company Overview
- 12.1.11.2. Products
- 12.1.11.3. Company Financials
- 12.1.11.4. SWOT Analysis
- 12.1.1 Santa Cruz Biotechnology Inc
- 12.2. Market Entropy
- 12.2.1 Company's Key Areas Served
- 12.2.2 Recent Developments
- 12.3. Company Market Share Analysis 2025
- 12.3.1 Top 5 Companies Market Share Analysis
- 12.3.2 Top 3 Companies Market Share Analysis
- 12.4. List of Potential Customers
- 13. Research Methodology
List of Figures
- Figure 1: Global Chromatography Reagents Market Revenue Breakdown (billion, %) by Region 2025 & 2033
- Figure 2: Global Chromatography Reagents Market Volume Breakdown (K Tons, %) by Region 2025 & 2033
- Figure 3: Asia Pacific Chromatography Reagents Market Revenue (billion), by Type 2025 & 2033
- Figure 4: Asia Pacific Chromatography Reagents Market Volume (K Tons), by Type 2025 & 2033
- Figure 5: Asia Pacific Chromatography Reagents Market Revenue Share (%), by Type 2025 & 2033
- Figure 6: Asia Pacific Chromatography Reagents Market Volume Share (%), by Type 2025 & 2033
- Figure 7: Asia Pacific Chromatography Reagents Market Revenue (billion), by Physical State of Mobile Phase 2025 & 2033
- Figure 8: Asia Pacific Chromatography Reagents Market Volume (K Tons), by Physical State of Mobile Phase 2025 & 2033
- Figure 9: Asia Pacific Chromatography Reagents Market Revenue Share (%), by Physical State of Mobile Phase 2025 & 2033
- Figure 10: Asia Pacific Chromatography Reagents Market Volume Share (%), by Physical State of Mobile Phase 2025 & 2033
- Figure 11: Asia Pacific Chromatography Reagents Market Revenue (billion), by Technology 2025 & 2033
- Figure 12: Asia Pacific Chromatography Reagents Market Volume (K Tons), by Technology 2025 & 2033
- Figure 13: Asia Pacific Chromatography Reagents Market Revenue Share (%), by Technology 2025 & 2033
- Figure 14: Asia Pacific Chromatography Reagents Market Volume Share (%), by Technology 2025 & 2033
- Figure 15: Asia Pacific Chromatography Reagents Market Revenue (billion), by Application 2025 & 2033
- Figure 16: Asia Pacific Chromatography Reagents Market Volume (K Tons), by Application 2025 & 2033
- Figure 17: Asia Pacific Chromatography Reagents Market Revenue Share (%), by Application 2025 & 2033
- Figure 18: Asia Pacific Chromatography Reagents Market Volume Share (%), by Application 2025 & 2033
- Figure 19: Asia Pacific Chromatography Reagents Market Revenue (billion), by Country 2025 & 2033
- Figure 20: Asia Pacific Chromatography Reagents Market Volume (K Tons), by Country 2025 & 2033
- Figure 21: Asia Pacific Chromatography Reagents Market Revenue Share (%), by Country 2025 & 2033
- Figure 22: Asia Pacific Chromatography Reagents Market Volume Share (%), by Country 2025 & 2033
- Figure 23: North America Chromatography Reagents Market Revenue (billion), by Type 2025 & 2033
- Figure 24: North America Chromatography Reagents Market Volume (K Tons), by Type 2025 & 2033
- Figure 25: North America Chromatography Reagents Market Revenue Share (%), by Type 2025 & 2033
- Figure 26: North America Chromatography Reagents Market Volume Share (%), by Type 2025 & 2033
- Figure 27: North America Chromatography Reagents Market Revenue (billion), by Physical State of Mobile Phase 2025 & 2033
- Figure 28: North America Chromatography Reagents Market Volume (K Tons), by Physical State of Mobile Phase 2025 & 2033
- Figure 29: North America Chromatography Reagents Market Revenue Share (%), by Physical State of Mobile Phase 2025 & 2033
- Figure 30: North America Chromatography Reagents Market Volume Share (%), by Physical State of Mobile Phase 2025 & 2033
- Figure 31: North America Chromatography Reagents Market Revenue (billion), by Technology 2025 & 2033
- Figure 32: North America Chromatography Reagents Market Volume (K Tons), by Technology 2025 & 2033
- Figure 33: North America Chromatography Reagents Market Revenue Share (%), by Technology 2025 & 2033
- Figure 34: North America Chromatography Reagents Market Volume Share (%), by Technology 2025 & 2033
- Figure 35: North America Chromatography Reagents Market Revenue (billion), by Application 2025 & 2033
- Figure 36: North America Chromatography Reagents Market Volume (K Tons), by Application 2025 & 2033
- Figure 37: North America Chromatography Reagents Market Revenue Share (%), by Application 2025 & 2033
- Figure 38: North America Chromatography Reagents Market Volume Share (%), by Application 2025 & 2033
- Figure 39: North America Chromatography Reagents Market Revenue (billion), by Country 2025 & 2033
- Figure 40: North America Chromatography Reagents Market Volume (K Tons), by Country 2025 & 2033
- Figure 41: North America Chromatography Reagents Market Revenue Share (%), by Country 2025 & 2033
- Figure 42: North America Chromatography Reagents Market Volume Share (%), by Country 2025 & 2033
- Figure 43: Europe Chromatography Reagents Market Revenue (billion), by Type 2025 & 2033
- Figure 44: Europe Chromatography Reagents Market Volume (K Tons), by Type 2025 & 2033
- Figure 45: Europe Chromatography Reagents Market Revenue Share (%), by Type 2025 & 2033
- Figure 46: Europe Chromatography Reagents Market Volume Share (%), by Type 2025 & 2033
- Figure 47: Europe Chromatography Reagents Market Revenue (billion), by Physical State of Mobile Phase 2025 & 2033
- Figure 48: Europe Chromatography Reagents Market Volume (K Tons), by Physical State of Mobile Phase 2025 & 2033
- Figure 49: Europe Chromatography Reagents Market Revenue Share (%), by Physical State of Mobile Phase 2025 & 2033
- Figure 50: Europe Chromatography Reagents Market Volume Share (%), by Physical State of Mobile Phase 2025 & 2033
- Figure 51: Europe Chromatography Reagents Market Revenue (billion), by Technology 2025 & 2033
- Figure 52: Europe Chromatography Reagents Market Volume (K Tons), by Technology 2025 & 2033
- Figure 53: Europe Chromatography Reagents Market Revenue Share (%), by Technology 2025 & 2033
- Figure 54: Europe Chromatography Reagents Market Volume Share (%), by Technology 2025 & 2033
- Figure 55: Europe Chromatography Reagents Market Revenue (billion), by Application 2025 & 2033
- Figure 56: Europe Chromatography Reagents Market Volume (K Tons), by Application 2025 & 2033
- Figure 57: Europe Chromatography Reagents Market Revenue Share (%), by Application 2025 & 2033
- Figure 58: Europe Chromatography Reagents Market Volume Share (%), by Application 2025 & 2033
- Figure 59: Europe Chromatography Reagents Market Revenue (billion), by Country 2025 & 2033
- Figure 60: Europe Chromatography Reagents Market Volume (K Tons), by Country 2025 & 2033
- Figure 61: Europe Chromatography Reagents Market Revenue Share (%), by Country 2025 & 2033
- Figure 62: Europe Chromatography Reagents Market Volume Share (%), by Country 2025 & 2033
- Figure 63: South America Chromatography Reagents Market Revenue (billion), by Type 2025 & 2033
- Figure 64: South America Chromatography Reagents Market Volume (K Tons), by Type 2025 & 2033
- Figure 65: South America Chromatography Reagents Market Revenue Share (%), by Type 2025 & 2033
- Figure 66: South America Chromatography Reagents Market Volume Share (%), by Type 2025 & 2033
- Figure 67: South America Chromatography Reagents Market Revenue (billion), by Physical State of Mobile Phase 2025 & 2033
- Figure 68: South America Chromatography Reagents Market Volume (K Tons), by Physical State of Mobile Phase 2025 & 2033
- Figure 69: South America Chromatography Reagents Market Revenue Share (%), by Physical State of Mobile Phase 2025 & 2033
- Figure 70: South America Chromatography Reagents Market Volume Share (%), by Physical State of Mobile Phase 2025 & 2033
- Figure 71: South America Chromatography Reagents Market Revenue (billion), by Technology 2025 & 2033
- Figure 72: South America Chromatography Reagents Market Volume (K Tons), by Technology 2025 & 2033
- Figure 73: South America Chromatography Reagents Market Revenue Share (%), by Technology 2025 & 2033
- Figure 74: South America Chromatography Reagents Market Volume Share (%), by Technology 2025 & 2033
- Figure 75: South America Chromatography Reagents Market Revenue (billion), by Application 2025 & 2033
- Figure 76: South America Chromatography Reagents Market Volume (K Tons), by Application 2025 & 2033
- Figure 77: South America Chromatography Reagents Market Revenue Share (%), by Application 2025 & 2033
- Figure 78: South America Chromatography Reagents Market Volume Share (%), by Application 2025 & 2033
- Figure 79: South America Chromatography Reagents Market Revenue (billion), by Country 2025 & 2033
- Figure 80: South America Chromatography Reagents Market Volume (K Tons), by Country 2025 & 2033
- Figure 81: South America Chromatography Reagents Market Revenue Share (%), by Country 2025 & 2033
- Figure 82: South America Chromatography Reagents Market Volume Share (%), by Country 2025 & 2033
- Figure 83: Middle East and Africa Chromatography Reagents Market Revenue (billion), by Type 2025 & 2033
- Figure 84: Middle East and Africa Chromatography Reagents Market Volume (K Tons), by Type 2025 & 2033
- Figure 85: Middle East and Africa Chromatography Reagents Market Revenue Share (%), by Type 2025 & 2033
- Figure 86: Middle East and Africa Chromatography Reagents Market Volume Share (%), by Type 2025 & 2033
- Figure 87: Middle East and Africa Chromatography Reagents Market Revenue (billion), by Physical State of Mobile Phase 2025 & 2033
- Figure 88: Middle East and Africa Chromatography Reagents Market Volume (K Tons), by Physical State of Mobile Phase 2025 & 2033
- Figure 89: Middle East and Africa Chromatography Reagents Market Revenue Share (%), by Physical State of Mobile Phase 2025 & 2033
- Figure 90: Middle East and Africa Chromatography Reagents Market Volume Share (%), by Physical State of Mobile Phase 2025 & 2033
- Figure 91: Middle East and Africa Chromatography Reagents Market Revenue (billion), by Technology 2025 & 2033
- Figure 92: Middle East and Africa Chromatography Reagents Market Volume (K Tons), by Technology 2025 & 2033
- Figure 93: Middle East and Africa Chromatography Reagents Market Revenue Share (%), by Technology 2025 & 2033
- Figure 94: Middle East and Africa Chromatography Reagents Market Volume Share (%), by Technology 2025 & 2033
- Figure 95: Middle East and Africa Chromatography Reagents Market Revenue (billion), by Application 2025 & 2033
- Figure 96: Middle East and Africa Chromatography Reagents Market Volume (K Tons), by Application 2025 & 2033
- Figure 97: Middle East and Africa Chromatography Reagents Market Revenue Share (%), by Application 2025 & 2033
- Figure 98: Middle East and Africa Chromatography Reagents Market Volume Share (%), by Application 2025 & 2033
- Figure 99: Middle East and Africa Chromatography Reagents Market Revenue (billion), by Country 2025 & 2033
- Figure 100: Middle East and Africa Chromatography Reagents Market Volume (K Tons), by Country 2025 & 2033
- Figure 101: Middle East and Africa Chromatography Reagents Market Revenue Share (%), by Country 2025 & 2033
- Figure 102: Middle East and Africa Chromatography Reagents Market Volume Share (%), by Country 2025 & 2033
List of Tables
- Table 1: Global Chromatography Reagents Market Revenue billion Forecast, by Type 2020 & 2033
- Table 2: Global Chromatography Reagents Market Volume K Tons Forecast, by Type 2020 & 2033
- Table 3: Global Chromatography Reagents Market Revenue billion Forecast, by Physical State of Mobile Phase 2020 & 2033
- Table 4: Global Chromatography Reagents Market Volume K Tons Forecast, by Physical State of Mobile Phase 2020 & 2033
- Table 5: Global Chromatography Reagents Market Revenue billion Forecast, by Technology 2020 & 2033
- Table 6: Global Chromatography Reagents Market Volume K Tons Forecast, by Technology 2020 & 2033
- Table 7: Global Chromatography Reagents Market Revenue billion Forecast, by Application 2020 & 2033
- Table 8: Global Chromatography Reagents Market Volume K Tons Forecast, by Application 2020 & 2033
- Table 9: Global Chromatography Reagents Market Revenue billion Forecast, by Region 2020 & 2033
- Table 10: Global Chromatography Reagents Market Volume K Tons Forecast, by Region 2020 & 2033
- Table 11: Global Chromatography Reagents Market Revenue billion Forecast, by Type 2020 & 2033
- Table 12: Global Chromatography Reagents Market Volume K Tons Forecast, by Type 2020 & 2033
- Table 13: Global Chromatography Reagents Market Revenue billion Forecast, by Physical State of Mobile Phase 2020 & 2033
- Table 14: Global Chromatography Reagents Market Volume K Tons Forecast, by Physical State of Mobile Phase 2020 & 2033
- Table 15: Global Chromatography Reagents Market Revenue billion Forecast, by Technology 2020 & 2033
- Table 16: Global Chromatography Reagents Market Volume K Tons Forecast, by Technology 2020 & 2033
- Table 17: Global Chromatography Reagents Market Revenue billion Forecast, by Application 2020 & 2033
- Table 18: Global Chromatography Reagents Market Volume K Tons Forecast, by Application 2020 & 2033
- Table 19: Global Chromatography Reagents Market Revenue billion Forecast, by Country 2020 & 2033
- Table 20: Global Chromatography Reagents Market Volume K Tons Forecast, by Country 2020 & 2033
- Table 21: China Chromatography Reagents Market Revenue (billion) Forecast, by Application 2020 & 2033
- Table 22: China Chromatography Reagents Market Volume (K Tons) Forecast, by Application 2020 & 2033
- Table 23: India Chromatography Reagents Market Revenue (billion) Forecast, by Application 2020 & 2033
- Table 24: India Chromatography Reagents Market Volume (K Tons) Forecast, by Application 2020 & 2033
- Table 25: Japan Chromatography Reagents Market Revenue (billion) Forecast, by Application 2020 & 2033
- Table 26: Japan Chromatography Reagents Market Volume (K Tons) Forecast, by Application 2020 & 2033
- Table 27: South Korea Chromatography Reagents Market Revenue (billion) Forecast, by Application 2020 & 2033
- Table 28: South Korea Chromatography Reagents Market Volume (K Tons) Forecast, by Application 2020 & 2033
- Table 29: Rest of Asia Pacific Chromatography Reagents Market Revenue (billion) Forecast, by Application 2020 & 2033
- Table 30: Rest of Asia Pacific Chromatography Reagents Market Volume (K Tons) Forecast, by Application 2020 & 2033
- Table 31: Global Chromatography Reagents Market Revenue billion Forecast, by Type 2020 & 2033
- Table 32: Global Chromatography Reagents Market Volume K Tons Forecast, by Type 2020 & 2033
- Table 33: Global Chromatography Reagents Market Revenue billion Forecast, by Physical State of Mobile Phase 2020 & 2033
- Table 34: Global Chromatography Reagents Market Volume K Tons Forecast, by Physical State of Mobile Phase 2020 & 2033
- Table 35: Global Chromatography Reagents Market Revenue billion Forecast, by Technology 2020 & 2033
- Table 36: Global Chromatography Reagents Market Volume K Tons Forecast, by Technology 2020 & 2033
- Table 37: Global Chromatography Reagents Market Revenue billion Forecast, by Application 2020 & 2033
- Table 38: Global Chromatography Reagents Market Volume K Tons Forecast, by Application 2020 & 2033
- Table 39: Global Chromatography Reagents Market Revenue billion Forecast, by Country 2020 & 2033
- Table 40: Global Chromatography Reagents Market Volume K Tons Forecast, by Country 2020 & 2033
- Table 41: United States Chromatography Reagents Market Revenue (billion) Forecast, by Application 2020 & 2033
- Table 42: United States Chromatography Reagents Market Volume (K Tons) Forecast, by Application 2020 & 2033
- Table 43: Canada Chromatography Reagents Market Revenue (billion) Forecast, by Application 2020 & 2033
- Table 44: Canada Chromatography Reagents Market Volume (K Tons) Forecast, by Application 2020 & 2033
- Table 45: Mexico Chromatography Reagents Market Revenue (billion) Forecast, by Application 2020 & 2033
- Table 46: Mexico Chromatography Reagents Market Volume (K Tons) Forecast, by Application 2020 & 2033
- Table 47: Global Chromatography Reagents Market Revenue billion Forecast, by Type 2020 & 2033
- Table 48: Global Chromatography Reagents Market Volume K Tons Forecast, by Type 2020 & 2033
- Table 49: Global Chromatography Reagents Market Revenue billion Forecast, by Physical State of Mobile Phase 2020 & 2033
- Table 50: Global Chromatography Reagents Market Volume K Tons Forecast, by Physical State of Mobile Phase 2020 & 2033
- Table 51: Global Chromatography Reagents Market Revenue billion Forecast, by Technology 2020 & 2033
- Table 52: Global Chromatography Reagents Market Volume K Tons Forecast, by Technology 2020 & 2033
- Table 53: Global Chromatography Reagents Market Revenue billion Forecast, by Application 2020 & 2033
- Table 54: Global Chromatography Reagents Market Volume K Tons Forecast, by Application 2020 & 2033
- Table 55: Global Chromatography Reagents Market Revenue billion Forecast, by Country 2020 & 2033
- Table 56: Global Chromatography Reagents Market Volume K Tons Forecast, by Country 2020 & 2033
- Table 57: Germany Chromatography Reagents Market Revenue (billion) Forecast, by Application 2020 & 2033
- Table 58: Germany Chromatography Reagents Market Volume (K Tons) Forecast, by Application 2020 & 2033
- Table 59: United Kingdom Chromatography Reagents Market Revenue (billion) Forecast, by Application 2020 & 2033
- Table 60: United Kingdom Chromatography Reagents Market Volume (K Tons) Forecast, by Application 2020 & 2033
- Table 61: Italy Chromatography Reagents Market Revenue (billion) Forecast, by Application 2020 & 2033
- Table 62: Italy Chromatography Reagents Market Volume (K Tons) Forecast, by Application 2020 & 2033
- Table 63: France Chromatography Reagents Market Revenue (billion) Forecast, by Application 2020 & 2033
- Table 64: France Chromatography Reagents Market Volume (K Tons) Forecast, by Application 2020 & 2033
- Table 65: Rest of Europe Chromatography Reagents Market Revenue (billion) Forecast, by Application 2020 & 2033
- Table 66: Rest of Europe Chromatography Reagents Market Volume (K Tons) Forecast, by Application 2020 & 2033
- Table 67: Global Chromatography Reagents Market Revenue billion Forecast, by Type 2020 & 2033
- Table 68: Global Chromatography Reagents Market Volume K Tons Forecast, by Type 2020 & 2033
- Table 69: Global Chromatography Reagents Market Revenue billion Forecast, by Physical State of Mobile Phase 2020 & 2033
- Table 70: Global Chromatography Reagents Market Volume K Tons Forecast, by Physical State of Mobile Phase 2020 & 2033
- Table 71: Global Chromatography Reagents Market Revenue billion Forecast, by Technology 2020 & 2033
- Table 72: Global Chromatography Reagents Market Volume K Tons Forecast, by Technology 2020 & 2033
- Table 73: Global Chromatography Reagents Market Revenue billion Forecast, by Application 2020 & 2033
- Table 74: Global Chromatography Reagents Market Volume K Tons Forecast, by Application 2020 & 2033
- Table 75: Global Chromatography Reagents Market Revenue billion Forecast, by Country 2020 & 2033
- Table 76: Global Chromatography Reagents Market Volume K Tons Forecast, by Country 2020 & 2033
- Table 77: Brazil Chromatography Reagents Market Revenue (billion) Forecast, by Application 2020 & 2033
- Table 78: Brazil Chromatography Reagents Market Volume (K Tons) Forecast, by Application 2020 & 2033
- Table 79: Argentina Chromatography Reagents Market Revenue (billion) Forecast, by Application 2020 & 2033
- Table 80: Argentina Chromatography Reagents Market Volume (K Tons) Forecast, by Application 2020 & 2033
- Table 81: Rest of South America Chromatography Reagents Market Revenue (billion) Forecast, by Application 2020 & 2033
- Table 82: Rest of South America Chromatography Reagents Market Volume (K Tons) Forecast, by Application 2020 & 2033
- Table 83: Global Chromatography Reagents Market Revenue billion Forecast, by Type 2020 & 2033
- Table 84: Global Chromatography Reagents Market Volume K Tons Forecast, by Type 2020 & 2033
- Table 85: Global Chromatography Reagents Market Revenue billion Forecast, by Physical State of Mobile Phase 2020 & 2033
- Table 86: Global Chromatography Reagents Market Volume K Tons Forecast, by Physical State of Mobile Phase 2020 & 2033
- Table 87: Global Chromatography Reagents Market Revenue billion Forecast, by Technology 2020 & 2033
- Table 88: Global Chromatography Reagents Market Volume K Tons Forecast, by Technology 2020 & 2033
- Table 89: Global Chromatography Reagents Market Revenue billion Forecast, by Application 2020 & 2033
- Table 90: Global Chromatography Reagents Market Volume K Tons Forecast, by Application 2020 & 2033
- Table 91: Global Chromatography Reagents Market Revenue billion Forecast, by Country 2020 & 2033
- Table 92: Global Chromatography Reagents Market Volume K Tons Forecast, by Country 2020 & 2033
- Table 93: Saudi Arabia Chromatography Reagents Market Revenue (billion) Forecast, by Application 2020 & 2033
- Table 94: Saudi Arabia Chromatography Reagents Market Volume (K Tons) Forecast, by Application 2020 & 2033
- Table 95: South Africa Chromatography Reagents Market Revenue (billion) Forecast, by Application 2020 & 2033
- Table 96: South Africa Chromatography Reagents Market Volume (K Tons) Forecast, by Application 2020 & 2033
- Table 97: Rest of Middle East and Africa Chromatography Reagents Market Revenue (billion) Forecast, by Application 2020 & 2033
- Table 98: Rest of Middle East and Africa Chromatography Reagents Market Volume (K Tons) Forecast, by Application 2020 & 2033
Frequently Asked Questions
1. What is the projected Compound Annual Growth Rate (CAGR) of the Chromatography Reagents Market?
The projected CAGR is approximately 5.8%.
2. Which companies are prominent players in the Chromatography Reagents Market?
Key companies in the market include Santa Cruz Biotechnology Inc, Regis Technologies Inc, Waters Corporation*List Not Exhaustive, Merck KGaA, Tosoh India Pvt Ltd, ITW Reagents, Thermo Fisher Scientific Inc, Agilent Technologies Inc, Avantor Inc, Tokyo Chemical Industry, Shimadzu Corporation.
3. What are the main segments of the Chromatography Reagents Market?
The market segments include Type, Physical State of Mobile Phase, Technology, Application.
4. Can you provide details about the market size?
The market size is estimated to be USD 26.61 billion as of 2022.
5. What are some drivers contributing to market growth?
Increasing Demand for Chromatography Reagents from the Pharmaceutical Sector; Increasing R&D Investment in Biotechnology Sector; Other Drivers.
6. What are the notable trends driving market growth?
Increasing Demand from Pharmaceutical Sector.
7. Are there any restraints impacting market growth?
High Cost of Chromatography Reagents; Other Restraints.
8. Can you provide examples of recent developments in the market?
March 2023: Avantor was accorded the Best Bioprocessing Company for Chromatography at the Asia-Pacific Bioprocessing Excellence Awards 2023 (ABEA)for providing innovative chromatography solutions that enable biopharmaceutical manufacturers to optimize processes and enhance product quality.
9. What pricing options are available for accessing the report?
Pricing options include single-user, multi-user, and enterprise licenses priced at USD 4750, USD 5250, and USD 8750 respectively.
10. Is the market size provided in terms of value or volume?
The market size is provided in terms of value, measured in billion and volume, measured in K Tons.
11. Are there any specific market keywords associated with the report?
Yes, the market keyword associated with the report is "Chromatography Reagents Market," which aids in identifying and referencing the specific market segment covered.
12. How do I determine which pricing option suits my needs best?
The pricing options vary based on user requirements and access needs. Individual users may opt for single-user licenses, while businesses requiring broader access may choose multi-user or enterprise licenses for cost-effective access to the report.
13. Are there any additional resources or data provided in the Chromatography Reagents Market report?
While the report offers comprehensive insights, it's advisable to review the specific contents or supplementary materials provided to ascertain if additional resources or data are available.
14. How can I stay updated on further developments or reports in the Chromatography Reagents Market?
To stay informed about further developments, trends, and reports in the Chromatography Reagents Market, consider subscribing to industry newsletters, following relevant companies and organizations, or regularly checking reputable industry news sources and publications.
Methodology
Step 1 - Identification of Relevant Samples Size from Population Database


Step 2 - Approaches for Defining Global Market Size (Value, Volume* & Price*)

Note*: In applicable scenarios
Step 3 - Data Sources
Primary Research
- Web Analytics
- Survey Reports
- Research Institute
- Latest Research Reports
- Opinion Leaders
Secondary Research
- Annual Reports
- White Paper
- Latest Press Release
- Industry Association
- Paid Database
- Investor Presentations

Step 4 - Data Triangulation
Involves using different sources of information in order to increase the validity of a study
These sources are likely to be stakeholders in a program - participants, other researchers, program staff, other community members, and so on.
Then we put all data in single framework & apply various statistical tools to find out the dynamic on the market.
During the analysis stage, feedback from the stakeholder groups would be compared to determine areas of agreement as well as areas of divergence