

Key Insights
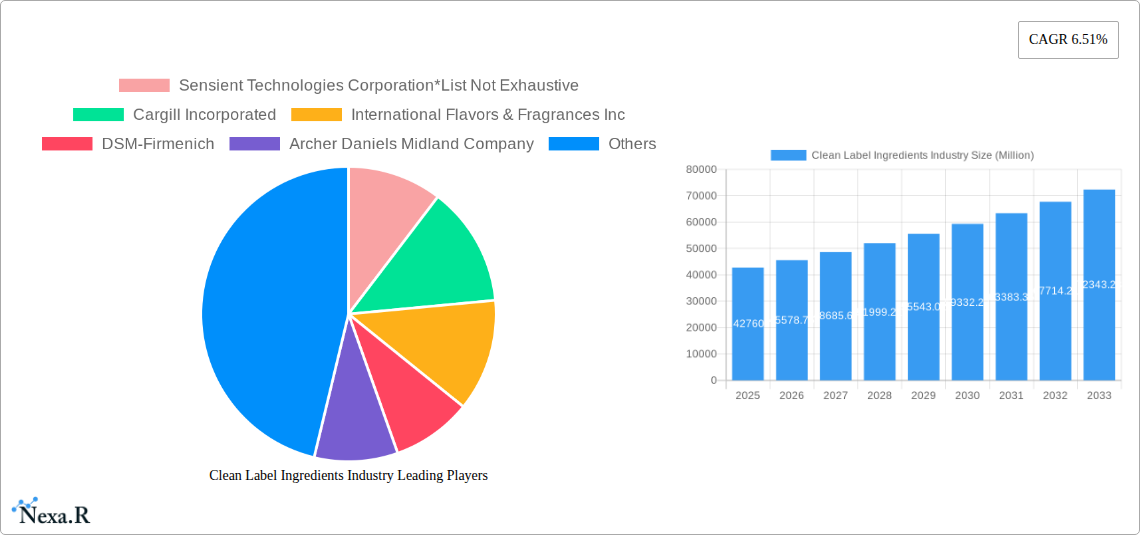
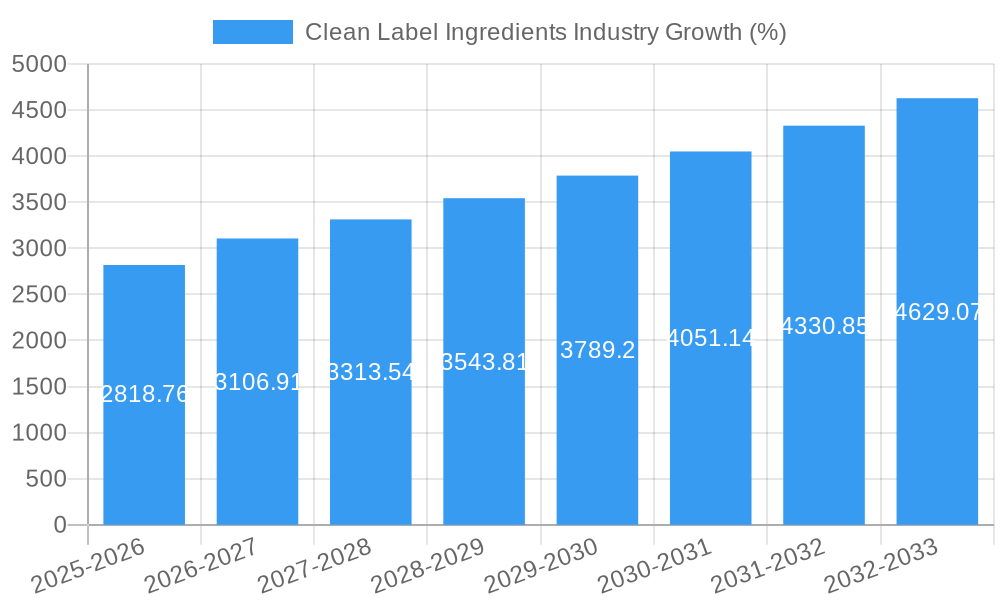
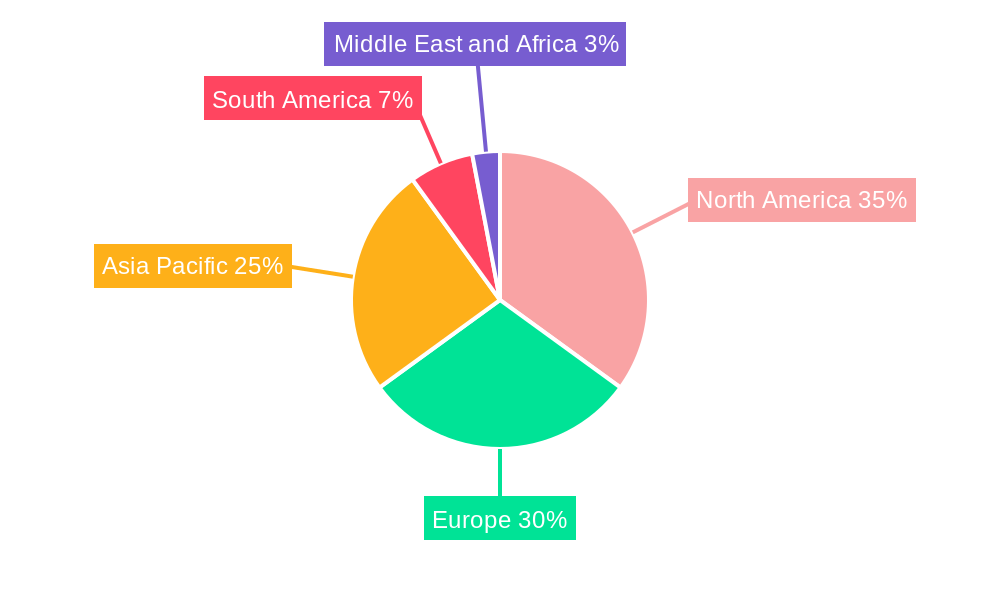
The clean label ingredients market, valued at $42.76 billion in 2025, is experiencing robust growth, projected to expand at a Compound Annual Growth Rate (CAGR) of 6.51% from 2025 to 2033. This surge is driven by increasing consumer demand for transparency and natural, recognizable ingredients in food and beverages. Health-conscious consumers are actively seeking products free from artificial colors, flavors, preservatives, and high-fructose corn syrup, fueling the demand for clean label alternatives. Key product segments driving this growth include food preservatives (naturally derived options like sea salt and vinegar), food sweeteners (stevia, monk fruit), food colorants (sourced from fruits and vegetables), and food flavors and enhancers (botanical extracts and spices). The bakery and confectionery, dairy and frozen desserts, and beverage sectors are major application areas, reflecting the significant shift towards healthier and more natural product formulations across various food categories. Leading companies like Sensient Technologies, Cargill, and IFF are investing heavily in research and development to meet this growing demand, developing innovative and sustainable clean label solutions. Geographic growth is expected across all regions, with North America and Europe currently holding the largest market shares, followed by the rapidly expanding Asia-Pacific region due to rising disposable incomes and changing consumer preferences.
The market's growth trajectory is further influenced by evolving regulatory landscapes that encourage clean label practices and the increasing availability of sustainable and ethically sourced ingredients. However, challenges remain, including higher production costs associated with natural ingredients compared to artificial counterparts and ensuring consistent quality and supply chain stability for these often more complex, naturally derived ingredients. Overcoming these challenges through technological advancements, efficient sourcing strategies, and effective supply chain management will be crucial to sustaining the market's strong growth momentum and meeting the ever-increasing consumer demand for authentic and clean-label food and beverage products. Furthermore, the market is likely to witness increasing innovation in ingredient functionality and applications, fostering further growth across various food and beverage segments.
Clean Label Ingredients Industry Market Report: 2019-2033
This comprehensive report provides an in-depth analysis of the Clean Label Ingredients market, encompassing market dynamics, growth trends, regional dominance, product landscape, key players, and future outlook. With a study period spanning 2019-2033 (base year 2025), this report is an essential resource for industry professionals, investors, and stakeholders seeking to navigate this rapidly evolving sector. The report covers both parent markets (Food Ingredients) and child markets (specific clean label ingredient types and applications) for a holistic view. Market values are presented in Million units.
Clean Label Ingredients Industry Market Dynamics & Structure
The Clean Label Ingredients market is characterized by moderate concentration, with key players like Sensient Technologies Corporation, Cargill Incorporated, International Flavors & Fragrances Inc, DSM-Firmenich, Archer Daniels Midland Company, Ajinomoto Co Inc, Tate & Lyle PLC, Kerry Group PLC, Ingredion Incorporated, and Corbion NV holding significant market share. However, the market also features numerous smaller players and emerging startups driving innovation.
- Market Concentration: The top 10 players collectively hold approximately xx% of the market share in 2025, indicating a moderately concentrated landscape. This is expected to shift slightly by 2033 with increased competition.
- Technological Innovation: Demand for natural, non-GMO, and organic ingredients fuels innovation in extraction technologies, fermentation processes, and ingredient modification.
- Regulatory Frameworks: Stringent regulations regarding labeling and ingredient safety influence product development and market entry. Variations in regulations across regions create complexities.
- Competitive Product Substitutes: The market faces competition from conventional ingredients and emerging alternatives, depending on the specific product type and application.
- End-User Demographics: Growing consumer awareness of health and wellness, along with increasing disposable income in developing economies, are key drivers.
- M&A Trends: The industry witnesses frequent mergers and acquisitions (M&A) activities, with approximately xx deals recorded between 2019 and 2024, totaling xx Million USD in value. This trend is expected to continue, driven by companies aiming to expand their product portfolios and market reach.
Clean Label Ingredients Industry Growth Trends & Insights
The Clean Label Ingredients market exhibits robust growth, driven by the increasing consumer preference for natural, minimally processed foods. The market size expanded from xx Million in 2019 to xx Million in 2024, registering a CAGR of xx%. This positive trend is expected to continue, with the market projected to reach xx Million by 2033, exhibiting a CAGR of xx% during the forecast period (2025-2033). Market penetration is currently at xx% in developed regions and is expected to increase to xx% by 2033 due to increasing awareness of health and wellness. Technological disruptions, such as precision fermentation and advanced extraction techniques, are further accelerating market expansion. Consumer behavior shifts towards clean eating and ethical sourcing underpin this growth trajectory. The shift in demand is notably influencing product development and marketing strategies across the industry.
Dominant Regions, Countries, or Segments in Clean Label Ingredients Industry
North America and Europe currently dominate the Clean Label Ingredients market, driven by high consumer demand and robust regulatory frameworks. However, the Asia-Pacific region demonstrates significant growth potential due to rising disposable incomes and changing consumer preferences.
- Product Type: Food Flavors and Enhancers and Food Sweeteners represent the largest segments, with projected values of xx Million and xx Million in 2025 respectively, reflecting the broad appeal of taste and sweetness in food products.
- Application: The Bakery and Confectionery and Beverages applications are leading segments, with estimated values of xx Million and xx Million in 2025 respectively, owing to the high volume of clean label ingredient usage in these product categories.
- Key Drivers (Regional):
- North America: High consumer awareness, stringent regulations, and robust innovation ecosystem.
- Europe: Stringent regulations, focus on sustainability, and high demand for organic and natural ingredients.
- Asia-Pacific: Rising disposable incomes, changing dietary habits, and increasing demand for convenience foods.
The dominance of these regions and segments is projected to continue, although other regions may witness faster growth rates.
Clean Label Ingredients Industry Product Landscape
The Clean Label Ingredients market offers a diverse range of products, including natural preservatives, sweeteners derived from plant sources, fruit and vegetable-based colorants, plant-based hydrocolloids, and naturally derived flavors and enhancers. Product innovation focuses on enhancing functionality, improving taste profiles, and expanding application versatility, addressing consumer demand for naturally sourced, clean-label alternatives. This drive for better product performance combined with the increasing demand for cleaner labels is creating a dynamic and evolving landscape.
Key Drivers, Barriers & Challenges in Clean Label Ingredients Industry
Key Drivers:
- Growing consumer demand for natural and healthy food products.
- Increasing awareness of the health implications of artificial ingredients.
- Stringent regulations regarding food labeling and ingredient safety.
- Technological advancements in ingredient extraction and processing.
Key Challenges:
- High production costs compared to conventional ingredients.
- Supply chain vulnerabilities and inconsistent sourcing of raw materials.
- Maintaining the stability and functionality of clean label ingredients.
- Meeting stringent regulatory requirements across diverse geographical regions. Regulatory compliance incurs significant costs and delays product launch, impacting overall market growth by approximately xx% in 2025.
Emerging Opportunities in Clean Label Ingredients Industry
Emerging opportunities exist in the development of novel clean label ingredients, tailored to specific functional requirements in various food applications. Untapped markets in developing economies, coupled with the increasing consumer preference for clean-label ingredients, present significant growth potential. Expansion into novel applications, such as personalized nutrition and functional foods, will drive innovation and future market growth. Developing ingredients for niche diets, like vegan or gluten-free products, presents significant market opportunities.
Growth Accelerators in the Clean Label Ingredients Industry
Strategic partnerships between ingredient suppliers and food manufacturers accelerate product development and market penetration. Technological advancements in fermentation and extraction techniques are improving the efficiency and scalability of clean label ingredient production. Expansion into new geographical markets and tapping into emerging consumer preferences, such as free-from and functional foods, will propel long-term growth.
Key Players Shaping the Clean Label Ingredients Industry Market
- Sensient Technologies Corporation
- Cargill Incorporated
- International Flavors & Fragrances Inc
- DSM-Firmenich
- Archer Daniels Midland Company
- Ajinomoto Co Inc
- Tate & Lyle PLC
- Kerry Group PLC
- Ingredion Incorporated
- Corbion NV
Notable Milestones in Clean Label Ingredients Industry Sector
- February 2024: Ajinomoto Co. opened a new office in Silicon Valley, expanding its reach in the US clean label ingredients market. This signifies a strategic move to tap into the growing demand for clean label ingredients in a key market.
- October 2023: International Flavor and Fragrances Inc. launched Methanova, a plant-based methylcellulose, expanding its portfolio into the biotechnology sector and showcasing its commitment to innovation in sustainable, clean-label solutions.
- August 2022: Archer-Daniels-Midland Company's partnership with New Culture strengthens its position in the growing animal-free dairy market, highlighting the trend toward plant-based alternatives and sustainable food systems.
In-Depth Clean Label Ingredients Industry Market Outlook
The Clean Label Ingredients market is poised for continued robust growth, driven by evolving consumer preferences, technological advancements, and strategic industry collaborations. Future market potential lies in expanding into new applications, developing innovative and sustainable ingredients, and catering to the growing demand for specialized and functional clean label products. Strategic investments in research and development, coupled with effective marketing and distribution strategies, will be crucial for success in this dynamic market.
Clean Label Ingredients Industry Segmentation
-
1. Product Type
- 1.1. Food Preservatives
- 1.2. Food Sweeteners
- 1.3. Food Colorants
- 1.4. Food Hydrocolloids
- 1.5. Food Flavors and Enhancers
- 1.6. Other Product Types
-
2. Application
- 2.1. Bakery and Confectionery
- 2.2. Dairy and Frozen Desserts
- 2.3. Beverages
- 2.4. Meat and Meat Products
- 2.5. Sauces and Condiments
- 2.6. Other Applications
Clean Label Ingredients Industry Segmentation By Geography
-
1. North America
- 1.1. United States
- 1.2. Canada
- 1.3. Mexico
- 1.4. Rest of North America
-
2. Europe
- 2.1. United Kingdom
- 2.2. Germany
- 2.3. Spain
- 2.4. France
- 2.5. Italy
- 2.6. Russia
- 2.7. Rest of Europe
-
3. Asia Pacific
- 3.1. China
- 3.2. Japan
- 3.3. India
- 3.4. Australia
- 3.5. Rest of Asia Pacific
-
4. South America
- 4.1. Brazil
- 4.2. Argentina
- 4.3. Rest of South America
-
5. Middle East and Africa
- 5.1. South Africa
- 5.2. Saudi Arabia
- 5.3. Rest of Middle East and Africa
Clean Label Ingredients Industry REPORT HIGHLIGHTS
| Aspects | Details |
|---|---|
| Study Period | 2019-2033 |
| Base Year | 2024 |
| Estimated Year | 2025 |
| Forecast Period | 2025-2033 |
| Historical Period | 2019-2024 |
| Growth Rate | CAGR of 6.51% from 2019-2033 |
| Segmentation |
|
Table of Contents
- 1. Introduction
- 1.1. Research Scope
- 1.2. Market Segmentation
- 1.3. Research Methodology
- 1.4. Definitions and Assumptions
- 2. Executive Summary
- 2.1. Introduction
- 3. Market Dynamics
- 3.1. Introduction
- 3.2. Market Drivers
- 3.2.1. Increasing Health and Wellness Trends Fueling Market Growth; Rising Demand for Natural Ingredients
- 3.3. Market Restrains
- 3.3.1. High Cost Hampering Market Growth
- 3.4. Market Trends
- 3.4.1. Increasing Health and Wellness Trends Fueling Market Growth
- 4. Market Factor Analysis
- 4.1. Porters Five Forces
- 4.2. Supply/Value Chain
- 4.3. PESTEL analysis
- 4.4. Market Entropy
- 4.5. Patent/Trademark Analysis
- 5. Global Clean Label Ingredients Industry Analysis, Insights and Forecast, 2019-2031
- 5.1. Market Analysis, Insights and Forecast - by Product Type
- 5.1.1. Food Preservatives
- 5.1.2. Food Sweeteners
- 5.1.3. Food Colorants
- 5.1.4. Food Hydrocolloids
- 5.1.5. Food Flavors and Enhancers
- 5.1.6. Other Product Types
- 5.2. Market Analysis, Insights and Forecast - by Application
- 5.2.1. Bakery and Confectionery
- 5.2.2. Dairy and Frozen Desserts
- 5.2.3. Beverages
- 5.2.4. Meat and Meat Products
- 5.2.5. Sauces and Condiments
- 5.2.6. Other Applications
- 5.3. Market Analysis, Insights and Forecast - by Region
- 5.3.1. North America
- 5.3.2. Europe
- 5.3.3. Asia Pacific
- 5.3.4. South America
- 5.3.5. Middle East and Africa
- 5.1. Market Analysis, Insights and Forecast - by Product Type
- 6. North America Clean Label Ingredients Industry Analysis, Insights and Forecast, 2019-2031
- 6.1. Market Analysis, Insights and Forecast - by Product Type
- 6.1.1. Food Preservatives
- 6.1.2. Food Sweeteners
- 6.1.3. Food Colorants
- 6.1.4. Food Hydrocolloids
- 6.1.5. Food Flavors and Enhancers
- 6.1.6. Other Product Types
- 6.2. Market Analysis, Insights and Forecast - by Application
- 6.2.1. Bakery and Confectionery
- 6.2.2. Dairy and Frozen Desserts
- 6.2.3. Beverages
- 6.2.4. Meat and Meat Products
- 6.2.5. Sauces and Condiments
- 6.2.6. Other Applications
- 6.1. Market Analysis, Insights and Forecast - by Product Type
- 7. Europe Clean Label Ingredients Industry Analysis, Insights and Forecast, 2019-2031
- 7.1. Market Analysis, Insights and Forecast - by Product Type
- 7.1.1. Food Preservatives
- 7.1.2. Food Sweeteners
- 7.1.3. Food Colorants
- 7.1.4. Food Hydrocolloids
- 7.1.5. Food Flavors and Enhancers
- 7.1.6. Other Product Types
- 7.2. Market Analysis, Insights and Forecast - by Application
- 7.2.1. Bakery and Confectionery
- 7.2.2. Dairy and Frozen Desserts
- 7.2.3. Beverages
- 7.2.4. Meat and Meat Products
- 7.2.5. Sauces and Condiments
- 7.2.6. Other Applications
- 7.1. Market Analysis, Insights and Forecast - by Product Type
- 8. Asia Pacific Clean Label Ingredients Industry Analysis, Insights and Forecast, 2019-2031
- 8.1. Market Analysis, Insights and Forecast - by Product Type
- 8.1.1. Food Preservatives
- 8.1.2. Food Sweeteners
- 8.1.3. Food Colorants
- 8.1.4. Food Hydrocolloids
- 8.1.5. Food Flavors and Enhancers
- 8.1.6. Other Product Types
- 8.2. Market Analysis, Insights and Forecast - by Application
- 8.2.1. Bakery and Confectionery
- 8.2.2. Dairy and Frozen Desserts
- 8.2.3. Beverages
- 8.2.4. Meat and Meat Products
- 8.2.5. Sauces and Condiments
- 8.2.6. Other Applications
- 8.1. Market Analysis, Insights and Forecast - by Product Type
- 9. South America Clean Label Ingredients Industry Analysis, Insights and Forecast, 2019-2031
- 9.1. Market Analysis, Insights and Forecast - by Product Type
- 9.1.1. Food Preservatives
- 9.1.2. Food Sweeteners
- 9.1.3. Food Colorants
- 9.1.4. Food Hydrocolloids
- 9.1.5. Food Flavors and Enhancers
- 9.1.6. Other Product Types
- 9.2. Market Analysis, Insights and Forecast - by Application
- 9.2.1. Bakery and Confectionery
- 9.2.2. Dairy and Frozen Desserts
- 9.2.3. Beverages
- 9.2.4. Meat and Meat Products
- 9.2.5. Sauces and Condiments
- 9.2.6. Other Applications
- 9.1. Market Analysis, Insights and Forecast - by Product Type
- 10. Middle East and Africa Clean Label Ingredients Industry Analysis, Insights and Forecast, 2019-2031
- 10.1. Market Analysis, Insights and Forecast - by Product Type
- 10.1.1. Food Preservatives
- 10.1.2. Food Sweeteners
- 10.1.3. Food Colorants
- 10.1.4. Food Hydrocolloids
- 10.1.5. Food Flavors and Enhancers
- 10.1.6. Other Product Types
- 10.2. Market Analysis, Insights and Forecast - by Application
- 10.2.1. Bakery and Confectionery
- 10.2.2. Dairy and Frozen Desserts
- 10.2.3. Beverages
- 10.2.4. Meat and Meat Products
- 10.2.5. Sauces and Condiments
- 10.2.6. Other Applications
- 10.1. Market Analysis, Insights and Forecast - by Product Type
- 11. North America Clean Label Ingredients Industry Analysis, Insights and Forecast, 2019-2031
- 11.1. Market Analysis, Insights and Forecast - By Country/Sub-region
- 11.1.1 United States
- 11.1.2 Canada
- 11.1.3 Mexico
- 11.1.4 Rest of North America
- 12. Europe Clean Label Ingredients Industry Analysis, Insights and Forecast, 2019-2031
- 12.1. Market Analysis, Insights and Forecast - By Country/Sub-region
- 12.1.1 United Kingdom
- 12.1.2 Germany
- 12.1.3 Spain
- 12.1.4 France
- 12.1.5 Italy
- 12.1.6 Russia
- 12.1.7 Rest of Europe
- 13. Asia Pacific Clean Label Ingredients Industry Analysis, Insights and Forecast, 2019-2031
- 13.1. Market Analysis, Insights and Forecast - By Country/Sub-region
- 13.1.1 China
- 13.1.2 Japan
- 13.1.3 India
- 13.1.4 Australia
- 13.1.5 Rest of Asia Pacific
- 14. South America Clean Label Ingredients Industry Analysis, Insights and Forecast, 2019-2031
- 14.1. Market Analysis, Insights and Forecast - By Country/Sub-region
- 14.1.1 Brazil
- 14.1.2 Argentina
- 14.1.3 Rest of South America
- 15. Middle East and Africa Clean Label Ingredients Industry Analysis, Insights and Forecast, 2019-2031
- 15.1. Market Analysis, Insights and Forecast - By Country/Sub-region
- 15.1.1 South Africa
- 15.1.2 Saudi Arabia
- 15.1.3 Rest of Middle East and Africa
- 16. Competitive Analysis
- 16.1. Global Market Share Analysis 2024
- 16.2. Company Profiles
- 16.2.1 Sensient Technologies Corporation*List Not Exhaustive
- 16.2.1.1. Overview
- 16.2.1.2. Products
- 16.2.1.3. SWOT Analysis
- 16.2.1.4. Recent Developments
- 16.2.1.5. Financials (Based on Availability)
- 16.2.2 Cargill Incorporated
- 16.2.2.1. Overview
- 16.2.2.2. Products
- 16.2.2.3. SWOT Analysis
- 16.2.2.4. Recent Developments
- 16.2.2.5. Financials (Based on Availability)
- 16.2.3 International Flavors & Fragrances Inc
- 16.2.3.1. Overview
- 16.2.3.2. Products
- 16.2.3.3. SWOT Analysis
- 16.2.3.4. Recent Developments
- 16.2.3.5. Financials (Based on Availability)
- 16.2.4 DSM-Firmenich
- 16.2.4.1. Overview
- 16.2.4.2. Products
- 16.2.4.3. SWOT Analysis
- 16.2.4.4. Recent Developments
- 16.2.4.5. Financials (Based on Availability)
- 16.2.5 Archer Daniels Midland Company
- 16.2.5.1. Overview
- 16.2.5.2. Products
- 16.2.5.3. SWOT Analysis
- 16.2.5.4. Recent Developments
- 16.2.5.5. Financials (Based on Availability)
- 16.2.6 Ajinomoto Co Inc
- 16.2.6.1. Overview
- 16.2.6.2. Products
- 16.2.6.3. SWOT Analysis
- 16.2.6.4. Recent Developments
- 16.2.6.5. Financials (Based on Availability)
- 16.2.7 Tate & Lyle PLC
- 16.2.7.1. Overview
- 16.2.7.2. Products
- 16.2.7.3. SWOT Analysis
- 16.2.7.4. Recent Developments
- 16.2.7.5. Financials (Based on Availability)
- 16.2.8 Kerry Group PLC
- 16.2.8.1. Overview
- 16.2.8.2. Products
- 16.2.8.3. SWOT Analysis
- 16.2.8.4. Recent Developments
- 16.2.8.5. Financials (Based on Availability)
- 16.2.9 Ingredion Incorporated
- 16.2.9.1. Overview
- 16.2.9.2. Products
- 16.2.9.3. SWOT Analysis
- 16.2.9.4. Recent Developments
- 16.2.9.5. Financials (Based on Availability)
- 16.2.10 Corbion NV
- 16.2.10.1. Overview
- 16.2.10.2. Products
- 16.2.10.3. SWOT Analysis
- 16.2.10.4. Recent Developments
- 16.2.10.5. Financials (Based on Availability)
- 16.2.1 Sensient Technologies Corporation*List Not Exhaustive
List of Figures
- Figure 1: Global Clean Label Ingredients Industry Revenue Breakdown (Million, %) by Region 2024 & 2032
- Figure 2: North America Clean Label Ingredients Industry Revenue (Million), by Country 2024 & 2032
- Figure 3: North America Clean Label Ingredients Industry Revenue Share (%), by Country 2024 & 2032
- Figure 4: Europe Clean Label Ingredients Industry Revenue (Million), by Country 2024 & 2032
- Figure 5: Europe Clean Label Ingredients Industry Revenue Share (%), by Country 2024 & 2032
- Figure 6: Asia Pacific Clean Label Ingredients Industry Revenue (Million), by Country 2024 & 2032
- Figure 7: Asia Pacific Clean Label Ingredients Industry Revenue Share (%), by Country 2024 & 2032
- Figure 8: South America Clean Label Ingredients Industry Revenue (Million), by Country 2024 & 2032
- Figure 9: South America Clean Label Ingredients Industry Revenue Share (%), by Country 2024 & 2032
- Figure 10: Middle East and Africa Clean Label Ingredients Industry Revenue (Million), by Country 2024 & 2032
- Figure 11: Middle East and Africa Clean Label Ingredients Industry Revenue Share (%), by Country 2024 & 2032
- Figure 12: North America Clean Label Ingredients Industry Revenue (Million), by Product Type 2024 & 2032
- Figure 13: North America Clean Label Ingredients Industry Revenue Share (%), by Product Type 2024 & 2032
- Figure 14: North America Clean Label Ingredients Industry Revenue (Million), by Application 2024 & 2032
- Figure 15: North America Clean Label Ingredients Industry Revenue Share (%), by Application 2024 & 2032
- Figure 16: North America Clean Label Ingredients Industry Revenue (Million), by Country 2024 & 2032
- Figure 17: North America Clean Label Ingredients Industry Revenue Share (%), by Country 2024 & 2032
- Figure 18: Europe Clean Label Ingredients Industry Revenue (Million), by Product Type 2024 & 2032
- Figure 19: Europe Clean Label Ingredients Industry Revenue Share (%), by Product Type 2024 & 2032
- Figure 20: Europe Clean Label Ingredients Industry Revenue (Million), by Application 2024 & 2032
- Figure 21: Europe Clean Label Ingredients Industry Revenue Share (%), by Application 2024 & 2032
- Figure 22: Europe Clean Label Ingredients Industry Revenue (Million), by Country 2024 & 2032
- Figure 23: Europe Clean Label Ingredients Industry Revenue Share (%), by Country 2024 & 2032
- Figure 24: Asia Pacific Clean Label Ingredients Industry Revenue (Million), by Product Type 2024 & 2032
- Figure 25: Asia Pacific Clean Label Ingredients Industry Revenue Share (%), by Product Type 2024 & 2032
- Figure 26: Asia Pacific Clean Label Ingredients Industry Revenue (Million), by Application 2024 & 2032
- Figure 27: Asia Pacific Clean Label Ingredients Industry Revenue Share (%), by Application 2024 & 2032
- Figure 28: Asia Pacific Clean Label Ingredients Industry Revenue (Million), by Country 2024 & 2032
- Figure 29: Asia Pacific Clean Label Ingredients Industry Revenue Share (%), by Country 2024 & 2032
- Figure 30: South America Clean Label Ingredients Industry Revenue (Million), by Product Type 2024 & 2032
- Figure 31: South America Clean Label Ingredients Industry Revenue Share (%), by Product Type 2024 & 2032
- Figure 32: South America Clean Label Ingredients Industry Revenue (Million), by Application 2024 & 2032
- Figure 33: South America Clean Label Ingredients Industry Revenue Share (%), by Application 2024 & 2032
- Figure 34: South America Clean Label Ingredients Industry Revenue (Million), by Country 2024 & 2032
- Figure 35: South America Clean Label Ingredients Industry Revenue Share (%), by Country 2024 & 2032
- Figure 36: Middle East and Africa Clean Label Ingredients Industry Revenue (Million), by Product Type 2024 & 2032
- Figure 37: Middle East and Africa Clean Label Ingredients Industry Revenue Share (%), by Product Type 2024 & 2032
- Figure 38: Middle East and Africa Clean Label Ingredients Industry Revenue (Million), by Application 2024 & 2032
- Figure 39: Middle East and Africa Clean Label Ingredients Industry Revenue Share (%), by Application 2024 & 2032
- Figure 40: Middle East and Africa Clean Label Ingredients Industry Revenue (Million), by Country 2024 & 2032
- Figure 41: Middle East and Africa Clean Label Ingredients Industry Revenue Share (%), by Country 2024 & 2032
List of Tables
- Table 1: Global Clean Label Ingredients Industry Revenue Million Forecast, by Region 2019 & 2032
- Table 2: Global Clean Label Ingredients Industry Revenue Million Forecast, by Product Type 2019 & 2032
- Table 3: Global Clean Label Ingredients Industry Revenue Million Forecast, by Application 2019 & 2032
- Table 4: Global Clean Label Ingredients Industry Revenue Million Forecast, by Region 2019 & 2032
- Table 5: Global Clean Label Ingredients Industry Revenue Million Forecast, by Country 2019 & 2032
- Table 6: United States Clean Label Ingredients Industry Revenue (Million) Forecast, by Application 2019 & 2032
- Table 7: Canada Clean Label Ingredients Industry Revenue (Million) Forecast, by Application 2019 & 2032
- Table 8: Mexico Clean Label Ingredients Industry Revenue (Million) Forecast, by Application 2019 & 2032
- Table 9: Rest of North America Clean Label Ingredients Industry Revenue (Million) Forecast, by Application 2019 & 2032
- Table 10: Global Clean Label Ingredients Industry Revenue Million Forecast, by Country 2019 & 2032
- Table 11: United Kingdom Clean Label Ingredients Industry Revenue (Million) Forecast, by Application 2019 & 2032
- Table 12: Germany Clean Label Ingredients Industry Revenue (Million) Forecast, by Application 2019 & 2032
- Table 13: Spain Clean Label Ingredients Industry Revenue (Million) Forecast, by Application 2019 & 2032
- Table 14: France Clean Label Ingredients Industry Revenue (Million) Forecast, by Application 2019 & 2032
- Table 15: Italy Clean Label Ingredients Industry Revenue (Million) Forecast, by Application 2019 & 2032
- Table 16: Russia Clean Label Ingredients Industry Revenue (Million) Forecast, by Application 2019 & 2032
- Table 17: Rest of Europe Clean Label Ingredients Industry Revenue (Million) Forecast, by Application 2019 & 2032
- Table 18: Global Clean Label Ingredients Industry Revenue Million Forecast, by Country 2019 & 2032
- Table 19: China Clean Label Ingredients Industry Revenue (Million) Forecast, by Application 2019 & 2032
- Table 20: Japan Clean Label Ingredients Industry Revenue (Million) Forecast, by Application 2019 & 2032
- Table 21: India Clean Label Ingredients Industry Revenue (Million) Forecast, by Application 2019 & 2032
- Table 22: Australia Clean Label Ingredients Industry Revenue (Million) Forecast, by Application 2019 & 2032
- Table 23: Rest of Asia Pacific Clean Label Ingredients Industry Revenue (Million) Forecast, by Application 2019 & 2032
- Table 24: Global Clean Label Ingredients Industry Revenue Million Forecast, by Country 2019 & 2032
- Table 25: Brazil Clean Label Ingredients Industry Revenue (Million) Forecast, by Application 2019 & 2032
- Table 26: Argentina Clean Label Ingredients Industry Revenue (Million) Forecast, by Application 2019 & 2032
- Table 27: Rest of South America Clean Label Ingredients Industry Revenue (Million) Forecast, by Application 2019 & 2032
- Table 28: Global Clean Label Ingredients Industry Revenue Million Forecast, by Country 2019 & 2032
- Table 29: South Africa Clean Label Ingredients Industry Revenue (Million) Forecast, by Application 2019 & 2032
- Table 30: Saudi Arabia Clean Label Ingredients Industry Revenue (Million) Forecast, by Application 2019 & 2032
- Table 31: Rest of Middle East and Africa Clean Label Ingredients Industry Revenue (Million) Forecast, by Application 2019 & 2032
- Table 32: Global Clean Label Ingredients Industry Revenue Million Forecast, by Product Type 2019 & 2032
- Table 33: Global Clean Label Ingredients Industry Revenue Million Forecast, by Application 2019 & 2032
- Table 34: Global Clean Label Ingredients Industry Revenue Million Forecast, by Country 2019 & 2032
- Table 35: United States Clean Label Ingredients Industry Revenue (Million) Forecast, by Application 2019 & 2032
- Table 36: Canada Clean Label Ingredients Industry Revenue (Million) Forecast, by Application 2019 & 2032
- Table 37: Mexico Clean Label Ingredients Industry Revenue (Million) Forecast, by Application 2019 & 2032
- Table 38: Rest of North America Clean Label Ingredients Industry Revenue (Million) Forecast, by Application 2019 & 2032
- Table 39: Global Clean Label Ingredients Industry Revenue Million Forecast, by Product Type 2019 & 2032
- Table 40: Global Clean Label Ingredients Industry Revenue Million Forecast, by Application 2019 & 2032
- Table 41: Global Clean Label Ingredients Industry Revenue Million Forecast, by Country 2019 & 2032
- Table 42: United Kingdom Clean Label Ingredients Industry Revenue (Million) Forecast, by Application 2019 & 2032
- Table 43: Germany Clean Label Ingredients Industry Revenue (Million) Forecast, by Application 2019 & 2032
- Table 44: Spain Clean Label Ingredients Industry Revenue (Million) Forecast, by Application 2019 & 2032
- Table 45: France Clean Label Ingredients Industry Revenue (Million) Forecast, by Application 2019 & 2032
- Table 46: Italy Clean Label Ingredients Industry Revenue (Million) Forecast, by Application 2019 & 2032
- Table 47: Russia Clean Label Ingredients Industry Revenue (Million) Forecast, by Application 2019 & 2032
- Table 48: Rest of Europe Clean Label Ingredients Industry Revenue (Million) Forecast, by Application 2019 & 2032
- Table 49: Global Clean Label Ingredients Industry Revenue Million Forecast, by Product Type 2019 & 2032
- Table 50: Global Clean Label Ingredients Industry Revenue Million Forecast, by Application 2019 & 2032
- Table 51: Global Clean Label Ingredients Industry Revenue Million Forecast, by Country 2019 & 2032
- Table 52: China Clean Label Ingredients Industry Revenue (Million) Forecast, by Application 2019 & 2032
- Table 53: Japan Clean Label Ingredients Industry Revenue (Million) Forecast, by Application 2019 & 2032
- Table 54: India Clean Label Ingredients Industry Revenue (Million) Forecast, by Application 2019 & 2032
- Table 55: Australia Clean Label Ingredients Industry Revenue (Million) Forecast, by Application 2019 & 2032
- Table 56: Rest of Asia Pacific Clean Label Ingredients Industry Revenue (Million) Forecast, by Application 2019 & 2032
- Table 57: Global Clean Label Ingredients Industry Revenue Million Forecast, by Product Type 2019 & 2032
- Table 58: Global Clean Label Ingredients Industry Revenue Million Forecast, by Application 2019 & 2032
- Table 59: Global Clean Label Ingredients Industry Revenue Million Forecast, by Country 2019 & 2032
- Table 60: Brazil Clean Label Ingredients Industry Revenue (Million) Forecast, by Application 2019 & 2032
- Table 61: Argentina Clean Label Ingredients Industry Revenue (Million) Forecast, by Application 2019 & 2032
- Table 62: Rest of South America Clean Label Ingredients Industry Revenue (Million) Forecast, by Application 2019 & 2032
- Table 63: Global Clean Label Ingredients Industry Revenue Million Forecast, by Product Type 2019 & 2032
- Table 64: Global Clean Label Ingredients Industry Revenue Million Forecast, by Application 2019 & 2032
- Table 65: Global Clean Label Ingredients Industry Revenue Million Forecast, by Country 2019 & 2032
- Table 66: South Africa Clean Label Ingredients Industry Revenue (Million) Forecast, by Application 2019 & 2032
- Table 67: Saudi Arabia Clean Label Ingredients Industry Revenue (Million) Forecast, by Application 2019 & 2032
- Table 68: Rest of Middle East and Africa Clean Label Ingredients Industry Revenue (Million) Forecast, by Application 2019 & 2032
Frequently Asked Questions
1. What is the projected Compound Annual Growth Rate (CAGR) of the Clean Label Ingredients Industry?
The projected CAGR is approximately 6.51%.
2. Which companies are prominent players in the Clean Label Ingredients Industry?
Key companies in the market include Sensient Technologies Corporation*List Not Exhaustive, Cargill Incorporated, International Flavors & Fragrances Inc, DSM-Firmenich, Archer Daniels Midland Company, Ajinomoto Co Inc, Tate & Lyle PLC, Kerry Group PLC, Ingredion Incorporated, Corbion NV.
3. What are the main segments of the Clean Label Ingredients Industry?
The market segments include Product Type, Application.
4. Can you provide details about the market size?
The market size is estimated to be USD 42.76 Million as of 2022.
5. What are some drivers contributing to market growth?
Increasing Health and Wellness Trends Fueling Market Growth; Rising Demand for Natural Ingredients.
6. What are the notable trends driving market growth?
Increasing Health and Wellness Trends Fueling Market Growth.
7. Are there any restraints impacting market growth?
High Cost Hampering Market Growth.
8. Can you provide examples of recent developments in the market?
February 2024: Ajinomoto Co. opened a new office in Silicon Valley, United States. The office provides different types of food solutions, including clean label ingredients in the US market. The purpose of this expansion was to expand the company’s business.
9. What pricing options are available for accessing the report?
Pricing options include single-user, multi-user, and enterprise licenses priced at USD 4750, USD 5250, and USD 8750 respectively.
10. Is the market size provided in terms of value or volume?
The market size is provided in terms of value, measured in Million.
11. Are there any specific market keywords associated with the report?
Yes, the market keyword associated with the report is "Clean Label Ingredients Industry," which aids in identifying and referencing the specific market segment covered.
12. How do I determine which pricing option suits my needs best?
The pricing options vary based on user requirements and access needs. Individual users may opt for single-user licenses, while businesses requiring broader access may choose multi-user or enterprise licenses for cost-effective access to the report.
13. Are there any additional resources or data provided in the Clean Label Ingredients Industry report?
While the report offers comprehensive insights, it's advisable to review the specific contents or supplementary materials provided to ascertain if additional resources or data are available.
14. How can I stay updated on further developments or reports in the Clean Label Ingredients Industry?
To stay informed about further developments, trends, and reports in the Clean Label Ingredients Industry, consider subscribing to industry newsletters, following relevant companies and organizations, or regularly checking reputable industry news sources and publications.
Methodology
Step 1 - Identification of Relevant Samples Size from Population Database


Step 2 - Approaches for Defining Global Market Size (Value, Volume* & Price*)

Note*: In applicable scenarios
Step 3 - Data Sources
Primary Research
- Web Analytics
- Survey Reports
- Research Institute
- Latest Research Reports
- Opinion Leaders
Secondary Research
- Annual Reports
- White Paper
- Latest Press Release
- Industry Association
- Paid Database
- Investor Presentations

Step 4 - Data Triangulation
Involves using different sources of information in order to increase the validity of a study
These sources are likely to be stakeholders in a program - participants, other researchers, program staff, other community members, and so on.
Then we put all data in single framework & apply various statistical tools to find out the dynamic on the market.
During the analysis stage, feedback from the stakeholder groups would be compared to determine areas of agreement as well as areas of divergence
