

Key Insights
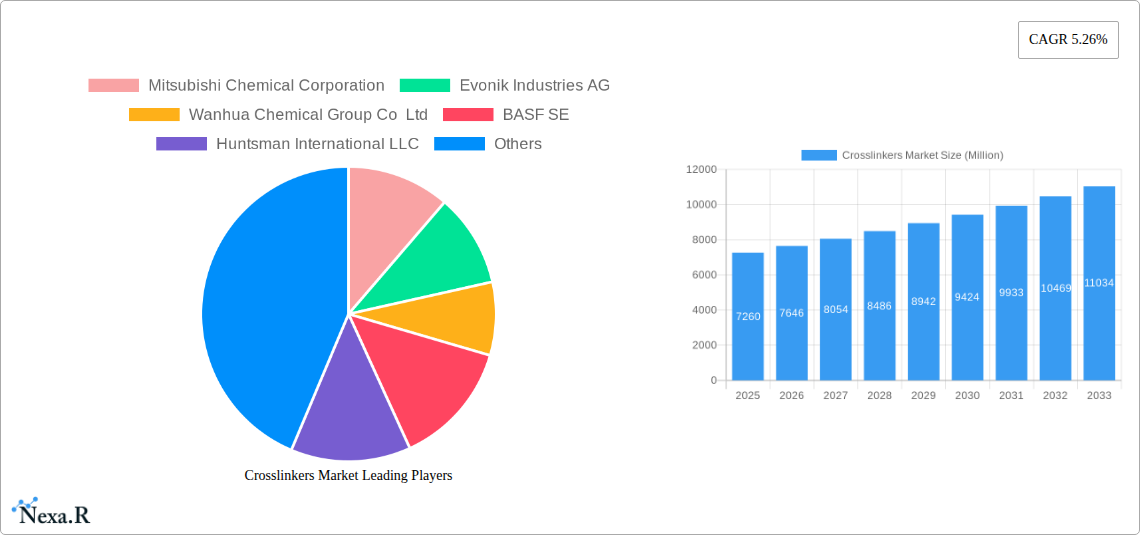
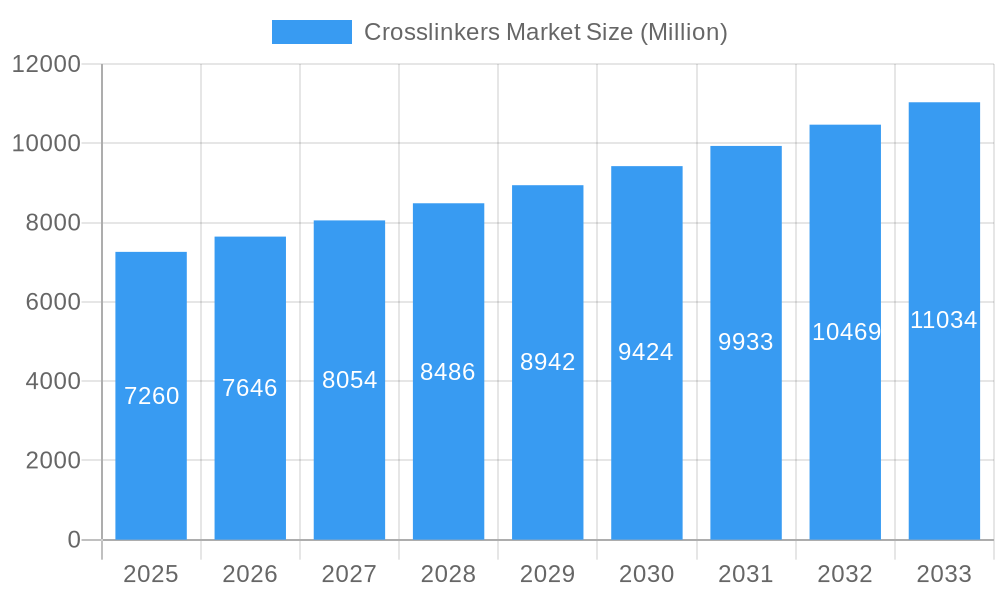
The global crosslinkers market, valued at $7.26 billion in 2025, is projected to experience robust growth, driven by increasing demand from key application sectors like automotive coatings, construction materials, and packaging. A Compound Annual Growth Rate (CAGR) of 5.26% from 2025 to 2033 indicates a substantial market expansion, reaching an estimated value exceeding $11 billion by 2033. This growth is fueled by several factors, including the rising adoption of high-performance coatings requiring enhanced durability and flexibility, the increasing focus on sustainable manufacturing processes within these industries, and the expanding global construction and automotive sectors. Specific growth drivers include the increasing demand for lightweight materials in automotive applications, leading to a higher requirement for effective crosslinkers in composite materials. Furthermore, the growing preference for eco-friendly water-based coatings is driving innovation in crosslinker technology, focusing on low-VOC and bio-based alternatives.
Crosslinkers Market Market Size (In Billion)
However, the market also faces certain restraints. Fluctuations in raw material prices, particularly for isocyanates and amines, can impact profitability and pricing strategies. Additionally, stringent environmental regulations concerning volatile organic compounds (VOCs) necessitate continuous innovation and development of eco-friendly crosslinkers. Despite these challenges, the market's positive outlook is reinforced by ongoing research and development efforts focused on improving crosslinker efficiency, performance, and sustainability. This includes the exploration of novel chemistries like bio-based crosslinkers and the optimization of existing technologies to reduce their environmental impact. The market segmentation, encompassing various application areas and chemical types, further showcases the diverse opportunities for growth and innovation within this dynamic sector. The competitive landscape is characterized by a mix of established global players and regional manufacturers, indicative of a mature yet evolving market.
Crosslinkers Market Company Market Share
Crosslinkers Market: A Comprehensive Report (2019-2033)
This in-depth report provides a comprehensive analysis of the Crosslinkers Market, encompassing market dynamics, growth trends, regional dominance, product landscape, and key players. It covers the parent market of Coatings and Adhesives and the child market of Crosslinkers, offering invaluable insights for industry professionals, investors, and strategic decision-makers. The study period spans from 2019 to 2033, with 2025 serving as the base and estimated year.
Study Period: 2019-2033 Base Year: 2025 Estimated Year: 2025 Forecast Period: 2025-2033 Historical Period: 2019-2024
Crosslinkers Market Market Dynamics & Structure
The Crosslinkers market, valued at xx Million in 2024, is characterized by moderate concentration, with key players like BASF SE, Dow, and Evonik Industries AG holding significant market share. Technological innovation, particularly in developing sustainable and high-performance crosslinkers, is a major driver. Stringent environmental regulations are influencing product development, pushing for reduced VOC emissions and improved biodegradability. Competition from alternative bonding technologies and the increasing prevalence of M&A activities are shaping the market landscape. The market is segmented by application (Automotive Coatings, Decorative Coatings, Industrial Coatings, Packaging Coatings, Other Applications) and type (Amide, Amine, Amino, Carbodiimide, Isocyanate, Other Types).
- Market Concentration: Moderately concentrated, with top 5 players holding approximately xx% market share in 2024.
- Technological Innovation: Focus on sustainable and high-performance crosslinkers with reduced VOCs and improved biodegradability.
- Regulatory Framework: Stringent environmental regulations driving the development of eco-friendly crosslinkers.
- Competitive Substitutes: Competition from alternative bonding technologies impacting market growth.
- M&A Activity: Significant M&A activity observed in recent years, leading to market consolidation and reshaping the competitive landscape (see Notable Milestones). Approximately xx M&A deals were recorded between 2019 and 2024.
- End-User Demographics: Growth driven by increasing demand from automotive, construction, and packaging industries.
Crosslinkers Market Growth Trends & Insights
The Crosslinkers market is projected to experience significant growth during the forecast period (2025-2033), with a CAGR of xx%. This growth is fueled by rising demand from various end-use sectors, particularly the automotive and construction industries. Technological advancements leading to the development of high-performance crosslinkers with improved properties are contributing to increased adoption rates. Shifting consumer preferences towards eco-friendly products are also impacting market trends, stimulating demand for bio-based and sustainable crosslinkers. Market penetration is expected to increase from xx% in 2024 to xx% by 2033. Factors such as increasing disposable incomes in developing economies and robust infrastructure development are also expected to positively impact market growth. Further analysis using XXX model reveals that the market will reach xx Million by 2033. The adoption of innovative crosslinking technologies is also driving faster growth within specific application segments.
Dominant Regions, Countries, or Segments in Crosslinkers Market
The Asia Pacific region is projected to dominate the Crosslinkers market during the forecast period, driven by rapid industrialization, robust infrastructure development, and increasing demand from the automotive and construction sectors. Within applications, Automotive Coatings holds the largest market share, followed by Industrial Coatings. The strong growth in the automotive industry, particularly in countries like China and India, is fueling demand for high-performance crosslinkers.
- Key Drivers in Asia Pacific:
- Rapid industrialization and infrastructure development.
- Increasing demand from the automotive and construction sectors.
- Favorable government policies promoting industrial growth.
- Dominant Application Segment: Automotive Coatings (xx% market share in 2024).
- Dominant Type Segment: Isocyanate (xx% market share in 2024).
- Growth Potential: Significant growth potential in emerging economies like India and Southeast Asia.
Crosslinkers Market Product Landscape
The Crosslinkers market features a diverse range of products, each catering to specific application requirements. Recent innovations focus on enhancing performance characteristics like durability, flexibility, and chemical resistance. Manufacturers are also focusing on developing eco-friendly crosslinkers with reduced VOC emissions and improved biodegradability to meet stringent environmental regulations. Unique selling propositions often center on superior performance characteristics, cost-effectiveness, and ease of application.
Key Drivers, Barriers & Challenges in Crosslinkers Market
Key Drivers:
- Increasing demand from the automotive and construction industries.
- Technological advancements leading to improved product performance.
- Growing awareness of the importance of sustainability and eco-friendly materials.
Challenges & Restraints:
- Fluctuations in raw material prices impacting profitability.
- Stringent environmental regulations requiring significant investments in R&D.
- Intense competition from existing players and the emergence of new entrants. This has resulted in a price war in certain segments, reducing profit margins by an estimated xx% in 2024.
Emerging Opportunities in Crosslinkers Market
- Growing demand for sustainable and bio-based crosslinkers.
- Expansion into new applications, such as 3D printing and biomedical engineering.
- Development of high-performance crosslinkers for demanding environments.
Growth Accelerators in the Crosslinkers Market Industry
Technological breakthroughs, particularly in the area of nanotechnology and bio-based materials, are driving long-term growth. Strategic partnerships between manufacturers and end-users are fostering innovation and expanding market reach. Aggressive market expansion strategies, focusing on emerging economies and untapped market segments, are also expected to contribute significantly to market growth.
Key Players Shaping the Crosslinkers Market Market
- Mitsubishi Chemical Corporation
- Evonik Industries AG
- Wanhua Chemical Group Co Ltd
- BASF SE
- Huntsman International LLC
- Dow
- Aditya Birla Chemicals
- KUMHO P&B CHEMICALS INC
- Allnex GMBH
- Hexion
- NIPPON SHOKUBAI CO LTD
- Covestro AG
- Nisshinbo Chemical Inc
Notable Milestones in Crosslinkers Market Sector
- December 2021: Allnex acquired by PTT Global Chemical for approximately USD 4.25 billion, significantly impacting market consolidation.
- February 2022: Hexion sold its epoxy-based Coatings and Composite businesses for USD 1.2 billion to Westlake Chemical Corporation, altering the competitive landscape.
In-Depth Crosslinkers Market Market Outlook
The Crosslinkers market is poised for sustained growth, driven by technological innovation, expanding applications, and increasing demand from key industries. Strategic partnerships and acquisitions will continue to reshape the market landscape, creating both opportunities and challenges for existing and emerging players. The focus on sustainability and the development of eco-friendly solutions will be critical for future success in this dynamic market. The market is projected to reach xx Million by 2033, presenting significant opportunities for investors and industry participants.
Crosslinkers Market Segmentation
-
1. Type
- 1.1. Amide
- 1.2. Amine
- 1.3. Amino
- 1.4. Carbodiimide
- 1.5. Isocyanate
- 1.6. Other Types
-
2. Application
- 2.1. Automotive Coatings
- 2.2. Decorative Coatings
- 2.3. Industrial Coatings
- 2.4. Packaging Coatings
- 2.5. Other Applications
Crosslinkers Market Segmentation By Geography
-
1. Asia Pacific
- 1.1. China
- 1.2. India
- 1.3. Japan
- 1.4. South Korea
- 1.5. Rest of Asia Pacific
-
2. North America
- 2.1. United States
- 2.2. Canada
- 2.3. Mexico
-
3. Europe
- 3.1. Germany
- 3.2. United Kingdom
- 3.3. France
- 3.4. Italy
- 3.5. Rest of Europe
-
4. South America
- 4.1. Brazil
- 4.2. Argentina
- 4.3. Rest of South America
-
5. Middle East and Africa
- 5.1. Saudi Arabia
- 5.2. South Africa
- 5.3. Rest of Middle East and Africa
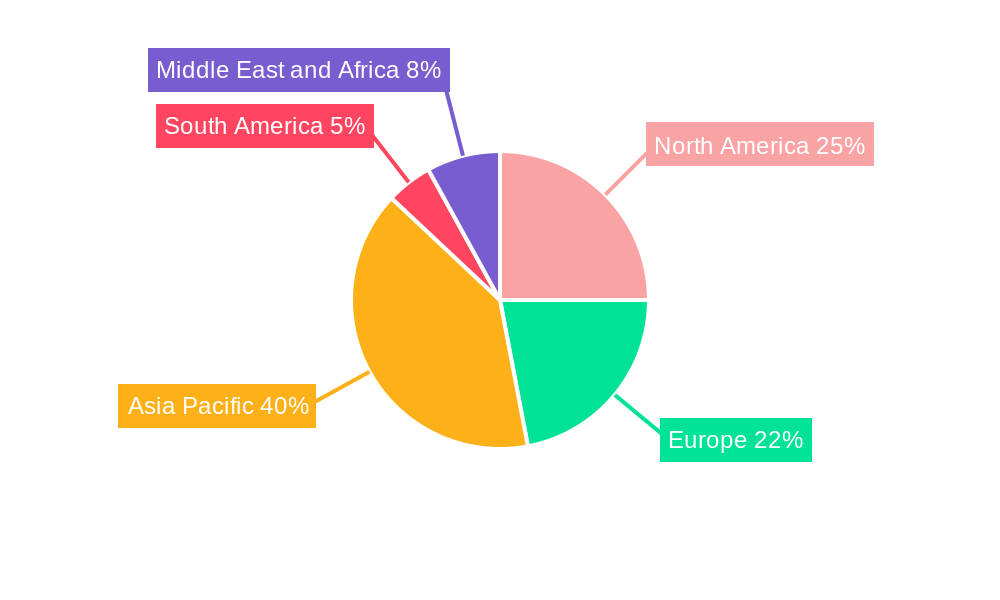
Crosslinkers Market Regional Market Share
Geographic Coverage of Crosslinkers Market
Crosslinkers Market REPORT HIGHLIGHTS
| Aspects | Details |
|---|---|
| Study Period | 2020-2034 |
| Base Year | 2025 |
| Estimated Year | 2026 |
| Forecast Period | 2026-2034 |
| Historical Period | 2020-2025 |
| Growth Rate | CAGR of 5.26% from 2020-2034 |
| Segmentation |
|
Table of Contents
- 1. Introduction
- 1.1. Research Scope
- 1.2. Market Segmentation
- 1.3. Research Objective
- 1.4. Definitions and Assumptions
- 2. Executive Summary
- 2.1. Market Snapshot
- 3. Market Dynamics
- 3.1. Market Drivers
- 3.2. Market Restrains
- 3.3. Market Trends
- 3.4. Market Opportunities
- 4. Market Factor Analysis
- 4.1. Porters Five Forces
- 4.1.1. Bargaining Power of Suppliers
- 4.1.2. Bargaining Power of Buyers
- 4.1.3. Threat of New Entrants
- 4.1.4. Threat of Substitutes
- 4.1.5. Competitive Rivalry
- 4.2. PESTEL analysis
- 4.3. BCG Analysis
- 4.3.1. Stars (High Growth, High Market Share)
- 4.3.2. Cash Cows (Low Growth, High Market Share)
- 4.3.3. Question Mark (High Growth, Low Market Share)
- 4.3.4. Dogs (Low Growth, Low Market Share)
- 4.4. Ansoff Matrix Analysis
- 4.5. Supply Chain Analysis
- 4.6. Regulatory Landscape
- 4.7. Current Market Potential and Opportunity Assessment (TAM–SAM–SOM Framework)
- 4.8. NRP Analyst Note
- 4.1. Porters Five Forces
- 5. Market Analysis, Insights and Forecast 2021-2033
- 5.1. Market Analysis, Insights and Forecast - by Type
- 5.1.1. Amide
- 5.1.2. Amine
- 5.1.3. Amino
- 5.1.4. Carbodiimide
- 5.1.5. Isocyanate
- 5.1.6. Other Types
- 5.2. Market Analysis, Insights and Forecast - by Application
- 5.2.1. Automotive Coatings
- 5.2.2. Decorative Coatings
- 5.2.3. Industrial Coatings
- 5.2.4. Packaging Coatings
- 5.2.5. Other Applications
- 5.3. Market Analysis, Insights and Forecast - by Region
- 5.3.1. Asia Pacific
- 5.3.2. North America
- 5.3.3. Europe
- 5.3.4. South America
- 5.3.5. Middle East and Africa
- 5.1. Market Analysis, Insights and Forecast - by Type
- 6. Global Crosslinkers Market Analysis, Insights and Forecast, 2021-2033
- 6.1. Market Analysis, Insights and Forecast - by Type
- 6.1.1. Amide
- 6.1.2. Amine
- 6.1.3. Amino
- 6.1.4. Carbodiimide
- 6.1.5. Isocyanate
- 6.1.6. Other Types
- 6.2. Market Analysis, Insights and Forecast - by Application
- 6.2.1. Automotive Coatings
- 6.2.2. Decorative Coatings
- 6.2.3. Industrial Coatings
- 6.2.4. Packaging Coatings
- 6.2.5. Other Applications
- 6.1. Market Analysis, Insights and Forecast - by Type
- 7. Asia Pacific Crosslinkers Market Analysis, Insights and Forecast, 2020-2032
- 7.1. Market Analysis, Insights and Forecast - by Type
- 7.1.1. Amide
- 7.1.2. Amine
- 7.1.3. Amino
- 7.1.4. Carbodiimide
- 7.1.5. Isocyanate
- 7.1.6. Other Types
- 7.2. Market Analysis, Insights and Forecast - by Application
- 7.2.1. Automotive Coatings
- 7.2.2. Decorative Coatings
- 7.2.3. Industrial Coatings
- 7.2.4. Packaging Coatings
- 7.2.5. Other Applications
- 7.1. Market Analysis, Insights and Forecast - by Type
- 8. North America Crosslinkers Market Analysis, Insights and Forecast, 2020-2032
- 8.1. Market Analysis, Insights and Forecast - by Type
- 8.1.1. Amide
- 8.1.2. Amine
- 8.1.3. Amino
- 8.1.4. Carbodiimide
- 8.1.5. Isocyanate
- 8.1.6. Other Types
- 8.2. Market Analysis, Insights and Forecast - by Application
- 8.2.1. Automotive Coatings
- 8.2.2. Decorative Coatings
- 8.2.3. Industrial Coatings
- 8.2.4. Packaging Coatings
- 8.2.5. Other Applications
- 8.1. Market Analysis, Insights and Forecast - by Type
- 9. Europe Crosslinkers Market Analysis, Insights and Forecast, 2020-2032
- 9.1. Market Analysis, Insights and Forecast - by Type
- 9.1.1. Amide
- 9.1.2. Amine
- 9.1.3. Amino
- 9.1.4. Carbodiimide
- 9.1.5. Isocyanate
- 9.1.6. Other Types
- 9.2. Market Analysis, Insights and Forecast - by Application
- 9.2.1. Automotive Coatings
- 9.2.2. Decorative Coatings
- 9.2.3. Industrial Coatings
- 9.2.4. Packaging Coatings
- 9.2.5. Other Applications
- 9.1. Market Analysis, Insights and Forecast - by Type
- 10. South America Crosslinkers Market Analysis, Insights and Forecast, 2020-2032
- 10.1. Market Analysis, Insights and Forecast - by Type
- 10.1.1. Amide
- 10.1.2. Amine
- 10.1.3. Amino
- 10.1.4. Carbodiimide
- 10.1.5. Isocyanate
- 10.1.6. Other Types
- 10.2. Market Analysis, Insights and Forecast - by Application
- 10.2.1. Automotive Coatings
- 10.2.2. Decorative Coatings
- 10.2.3. Industrial Coatings
- 10.2.4. Packaging Coatings
- 10.2.5. Other Applications
- 10.1. Market Analysis, Insights and Forecast - by Type
- 11. Middle East and Africa Crosslinkers Market Analysis, Insights and Forecast, 2020-2032
- 11.1. Market Analysis, Insights and Forecast - by Type
- 11.1.1. Amide
- 11.1.2. Amine
- 11.1.3. Amino
- 11.1.4. Carbodiimide
- 11.1.5. Isocyanate
- 11.1.6. Other Types
- 11.2. Market Analysis, Insights and Forecast - by Application
- 11.2.1. Automotive Coatings
- 11.2.2. Decorative Coatings
- 11.2.3. Industrial Coatings
- 11.2.4. Packaging Coatings
- 11.2.5. Other Applications
- 11.1. Market Analysis, Insights and Forecast - by Type
- 12. Competitive Analysis
- 12.1. Company Profiles
- 12.1.1 Mitsubishi Chemical Corporation
- 12.1.1.1. Company Overview
- 12.1.1.2. Products
- 12.1.1.3. Company Financials
- 12.1.1.4. SWOT Analysis
- 12.1.2 Evonik Industries AG
- 12.1.2.1. Company Overview
- 12.1.2.2. Products
- 12.1.2.3. Company Financials
- 12.1.2.4. SWOT Analysis
- 12.1.3 Wanhua Chemical Group Co Ltd
- 12.1.3.1. Company Overview
- 12.1.3.2. Products
- 12.1.3.3. Company Financials
- 12.1.3.4. SWOT Analysis
- 12.1.4 BASF SE
- 12.1.4.1. Company Overview
- 12.1.4.2. Products
- 12.1.4.3. Company Financials
- 12.1.4.4. SWOT Analysis
- 12.1.5 Huntsman International LLC
- 12.1.5.1. Company Overview
- 12.1.5.2. Products
- 12.1.5.3. Company Financials
- 12.1.5.4. SWOT Analysis
- 12.1.6 Dow
- 12.1.6.1. Company Overview
- 12.1.6.2. Products
- 12.1.6.3. Company Financials
- 12.1.6.4. SWOT Analysis
- 12.1.7 Aditya Birla Chemicals
- 12.1.7.1. Company Overview
- 12.1.7.2. Products
- 12.1.7.3. Company Financials
- 12.1.7.4. SWOT Analysis
- 12.1.8 KUMHO P&B CHEMICALS INC *List Not Exhaustive
- 12.1.8.1. Company Overview
- 12.1.8.2. Products
- 12.1.8.3. Company Financials
- 12.1.8.4. SWOT Analysis
- 12.1.9 Allnex GMBH
- 12.1.9.1. Company Overview
- 12.1.9.2. Products
- 12.1.9.3. Company Financials
- 12.1.9.4. SWOT Analysis
- 12.1.10 Hexion
- 12.1.10.1. Company Overview
- 12.1.10.2. Products
- 12.1.10.3. Company Financials
- 12.1.10.4. SWOT Analysis
- 12.1.11 NIPPON SHOKUBAI CO LTD
- 12.1.11.1. Company Overview
- 12.1.11.2. Products
- 12.1.11.3. Company Financials
- 12.1.11.4. SWOT Analysis
- 12.1.12 Covestro AG
- 12.1.12.1. Company Overview
- 12.1.12.2. Products
- 12.1.12.3. Company Financials
- 12.1.12.4. SWOT Analysis
- 12.1.13 Nisshinbo Chemical Inc
- 12.1.13.1. Company Overview
- 12.1.13.2. Products
- 12.1.13.3. Company Financials
- 12.1.13.4. SWOT Analysis
- 12.1.1 Mitsubishi Chemical Corporation
- 12.2. Market Entropy
- 12.2.1 Company's Key Areas Served
- 12.2.2 Recent Developments
- 12.3. Company Market Share Analysis 2025
- 12.3.1 Top 5 Companies Market Share Analysis
- 12.3.2 Top 3 Companies Market Share Analysis
- 12.4. List of Potential Customers
- 13. Research Methodology
List of Figures
- Figure 1: Global Crosslinkers Market Revenue Breakdown (Million, %) by Region 2025 & 2033
- Figure 2: Asia Pacific Crosslinkers Market Revenue (Million), by Type 2025 & 2033
- Figure 3: Asia Pacific Crosslinkers Market Revenue Share (%), by Type 2025 & 2033
- Figure 4: Asia Pacific Crosslinkers Market Revenue (Million), by Application 2025 & 2033
- Figure 5: Asia Pacific Crosslinkers Market Revenue Share (%), by Application 2025 & 2033
- Figure 6: Asia Pacific Crosslinkers Market Revenue (Million), by Country 2025 & 2033
- Figure 7: Asia Pacific Crosslinkers Market Revenue Share (%), by Country 2025 & 2033
- Figure 8: North America Crosslinkers Market Revenue (Million), by Type 2025 & 2033
- Figure 9: North America Crosslinkers Market Revenue Share (%), by Type 2025 & 2033
- Figure 10: North America Crosslinkers Market Revenue (Million), by Application 2025 & 2033
- Figure 11: North America Crosslinkers Market Revenue Share (%), by Application 2025 & 2033
- Figure 12: North America Crosslinkers Market Revenue (Million), by Country 2025 & 2033
- Figure 13: North America Crosslinkers Market Revenue Share (%), by Country 2025 & 2033
- Figure 14: Europe Crosslinkers Market Revenue (Million), by Type 2025 & 2033
- Figure 15: Europe Crosslinkers Market Revenue Share (%), by Type 2025 & 2033
- Figure 16: Europe Crosslinkers Market Revenue (Million), by Application 2025 & 2033
- Figure 17: Europe Crosslinkers Market Revenue Share (%), by Application 2025 & 2033
- Figure 18: Europe Crosslinkers Market Revenue (Million), by Country 2025 & 2033
- Figure 19: Europe Crosslinkers Market Revenue Share (%), by Country 2025 & 2033
- Figure 20: South America Crosslinkers Market Revenue (Million), by Type 2025 & 2033
- Figure 21: South America Crosslinkers Market Revenue Share (%), by Type 2025 & 2033
- Figure 22: South America Crosslinkers Market Revenue (Million), by Application 2025 & 2033
- Figure 23: South America Crosslinkers Market Revenue Share (%), by Application 2025 & 2033
- Figure 24: South America Crosslinkers Market Revenue (Million), by Country 2025 & 2033
- Figure 25: South America Crosslinkers Market Revenue Share (%), by Country 2025 & 2033
- Figure 26: Middle East and Africa Crosslinkers Market Revenue (Million), by Type 2025 & 2033
- Figure 27: Middle East and Africa Crosslinkers Market Revenue Share (%), by Type 2025 & 2033
- Figure 28: Middle East and Africa Crosslinkers Market Revenue (Million), by Application 2025 & 2033
- Figure 29: Middle East and Africa Crosslinkers Market Revenue Share (%), by Application 2025 & 2033
- Figure 30: Middle East and Africa Crosslinkers Market Revenue (Million), by Country 2025 & 2033
- Figure 31: Middle East and Africa Crosslinkers Market Revenue Share (%), by Country 2025 & 2033
List of Tables
- Table 1: Global Crosslinkers Market Revenue Million Forecast, by Type 2020 & 2033
- Table 2: Global Crosslinkers Market Revenue Million Forecast, by Application 2020 & 2033
- Table 3: Global Crosslinkers Market Revenue Million Forecast, by Region 2020 & 2033
- Table 4: Global Crosslinkers Market Revenue Million Forecast, by Type 2020 & 2033
- Table 5: Global Crosslinkers Market Revenue Million Forecast, by Application 2020 & 2033
- Table 6: Global Crosslinkers Market Revenue Million Forecast, by Country 2020 & 2033
- Table 7: China Crosslinkers Market Revenue (Million) Forecast, by Application 2020 & 2033
- Table 8: India Crosslinkers Market Revenue (Million) Forecast, by Application 2020 & 2033
- Table 9: Japan Crosslinkers Market Revenue (Million) Forecast, by Application 2020 & 2033
- Table 10: South Korea Crosslinkers Market Revenue (Million) Forecast, by Application 2020 & 2033
- Table 11: Rest of Asia Pacific Crosslinkers Market Revenue (Million) Forecast, by Application 2020 & 2033
- Table 12: Global Crosslinkers Market Revenue Million Forecast, by Type 2020 & 2033
- Table 13: Global Crosslinkers Market Revenue Million Forecast, by Application 2020 & 2033
- Table 14: Global Crosslinkers Market Revenue Million Forecast, by Country 2020 & 2033
- Table 15: United States Crosslinkers Market Revenue (Million) Forecast, by Application 2020 & 2033
- Table 16: Canada Crosslinkers Market Revenue (Million) Forecast, by Application 2020 & 2033
- Table 17: Mexico Crosslinkers Market Revenue (Million) Forecast, by Application 2020 & 2033
- Table 18: Global Crosslinkers Market Revenue Million Forecast, by Type 2020 & 2033
- Table 19: Global Crosslinkers Market Revenue Million Forecast, by Application 2020 & 2033
- Table 20: Global Crosslinkers Market Revenue Million Forecast, by Country 2020 & 2033
- Table 21: Germany Crosslinkers Market Revenue (Million) Forecast, by Application 2020 & 2033
- Table 22: United Kingdom Crosslinkers Market Revenue (Million) Forecast, by Application 2020 & 2033
- Table 23: France Crosslinkers Market Revenue (Million) Forecast, by Application 2020 & 2033
- Table 24: Italy Crosslinkers Market Revenue (Million) Forecast, by Application 2020 & 2033
- Table 25: Rest of Europe Crosslinkers Market Revenue (Million) Forecast, by Application 2020 & 2033
- Table 26: Global Crosslinkers Market Revenue Million Forecast, by Type 2020 & 2033
- Table 27: Global Crosslinkers Market Revenue Million Forecast, by Application 2020 & 2033
- Table 28: Global Crosslinkers Market Revenue Million Forecast, by Country 2020 & 2033
- Table 29: Brazil Crosslinkers Market Revenue (Million) Forecast, by Application 2020 & 2033
- Table 30: Argentina Crosslinkers Market Revenue (Million) Forecast, by Application 2020 & 2033
- Table 31: Rest of South America Crosslinkers Market Revenue (Million) Forecast, by Application 2020 & 2033
- Table 32: Global Crosslinkers Market Revenue Million Forecast, by Type 2020 & 2033
- Table 33: Global Crosslinkers Market Revenue Million Forecast, by Application 2020 & 2033
- Table 34: Global Crosslinkers Market Revenue Million Forecast, by Country 2020 & 2033
- Table 35: Saudi Arabia Crosslinkers Market Revenue (Million) Forecast, by Application 2020 & 2033
- Table 36: South Africa Crosslinkers Market Revenue (Million) Forecast, by Application 2020 & 2033
- Table 37: Rest of Middle East and Africa Crosslinkers Market Revenue (Million) Forecast, by Application 2020 & 2033
Frequently Asked Questions
1. What is the projected Compound Annual Growth Rate (CAGR) of the Crosslinkers Market?
The projected CAGR is approximately 5.26%.
2. Which companies are prominent players in the Crosslinkers Market?
Key companies in the market include Mitsubishi Chemical Corporation, Evonik Industries AG, Wanhua Chemical Group Co Ltd, BASF SE, Huntsman International LLC, Dow, Aditya Birla Chemicals, KUMHO P&B CHEMICALS INC *List Not Exhaustive, Allnex GMBH, Hexion, NIPPON SHOKUBAI CO LTD, Covestro AG, Nisshinbo Chemical Inc.
3. What are the main segments of the Crosslinkers Market?
The market segments include Type, Application.
4. Can you provide details about the market size?
The market size is estimated to be USD 7.26 Million as of 2022.
5. What are some drivers contributing to market growth?
Increasing Demad for Numerous Coatings; Increasing Focus on High-Performance Crosslinking Agents.
6. What are the notable trends driving market growth?
Increasing Demand for Decorative Coatings.
7. Are there any restraints impacting market growth?
Presence of Self-Crosslinking Agents.
8. Can you provide examples of recent developments in the market?
In February 2022, Hexion completed the sale of its epoxy-based Coatings and Composite businesses, which includes the epoxy specialty resins and base epoxy resins and intermediates product lines for around USD 1.2 billion to Westlake Chemical Corporation.
9. What pricing options are available for accessing the report?
Pricing options include single-user, multi-user, and enterprise licenses priced at USD 4750, USD 5250, and USD 8750 respectively.
10. Is the market size provided in terms of value or volume?
The market size is provided in terms of value, measured in Million.
11. Are there any specific market keywords associated with the report?
Yes, the market keyword associated with the report is "Crosslinkers Market," which aids in identifying and referencing the specific market segment covered.
12. How do I determine which pricing option suits my needs best?
The pricing options vary based on user requirements and access needs. Individual users may opt for single-user licenses, while businesses requiring broader access may choose multi-user or enterprise licenses for cost-effective access to the report.
13. Are there any additional resources or data provided in the Crosslinkers Market report?
While the report offers comprehensive insights, it's advisable to review the specific contents or supplementary materials provided to ascertain if additional resources or data are available.
14. How can I stay updated on further developments or reports in the Crosslinkers Market?
To stay informed about further developments, trends, and reports in the Crosslinkers Market, consider subscribing to industry newsletters, following relevant companies and organizations, or regularly checking reputable industry news sources and publications.
Methodology
Step 1 - Identification of Relevant Samples Size from Population Database


Step 2 - Approaches for Defining Global Market Size (Value, Volume* & Price*)

Note*: In applicable scenarios
Step 3 - Data Sources
Primary Research
- Web Analytics
- Survey Reports
- Research Institute
- Latest Research Reports
- Opinion Leaders
Secondary Research
- Annual Reports
- White Paper
- Latest Press Release
- Industry Association
- Paid Database
- Investor Presentations

Step 4 - Data Triangulation
Involves using different sources of information in order to increase the validity of a study
These sources are likely to be stakeholders in a program - participants, other researchers, program staff, other community members, and so on.
Then we put all data in single framework & apply various statistical tools to find out the dynamic on the market.
During the analysis stage, feedback from the stakeholder groups would be compared to determine areas of agreement as well as areas of divergence