

Key Insights
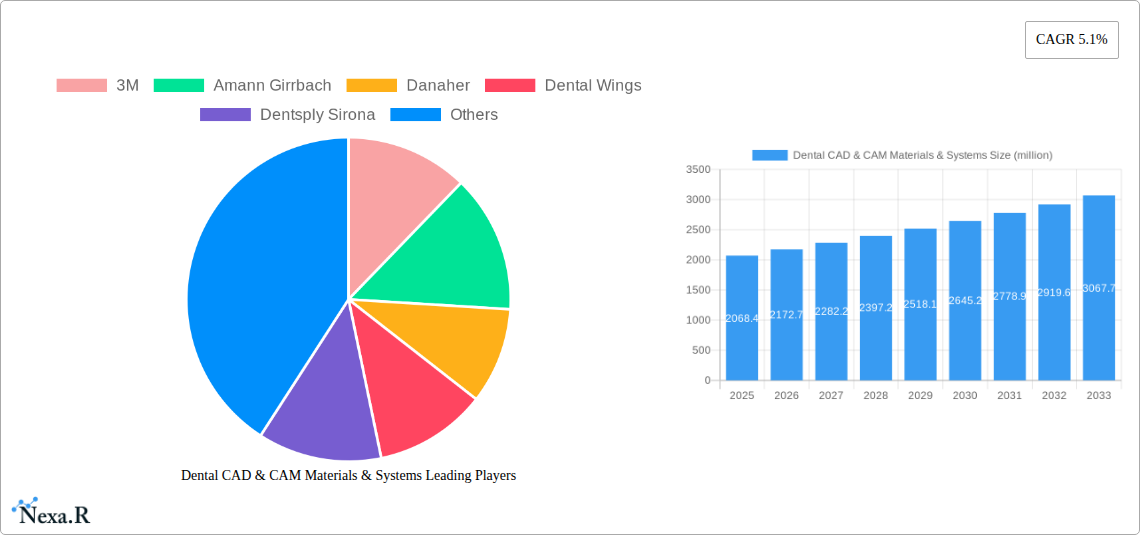
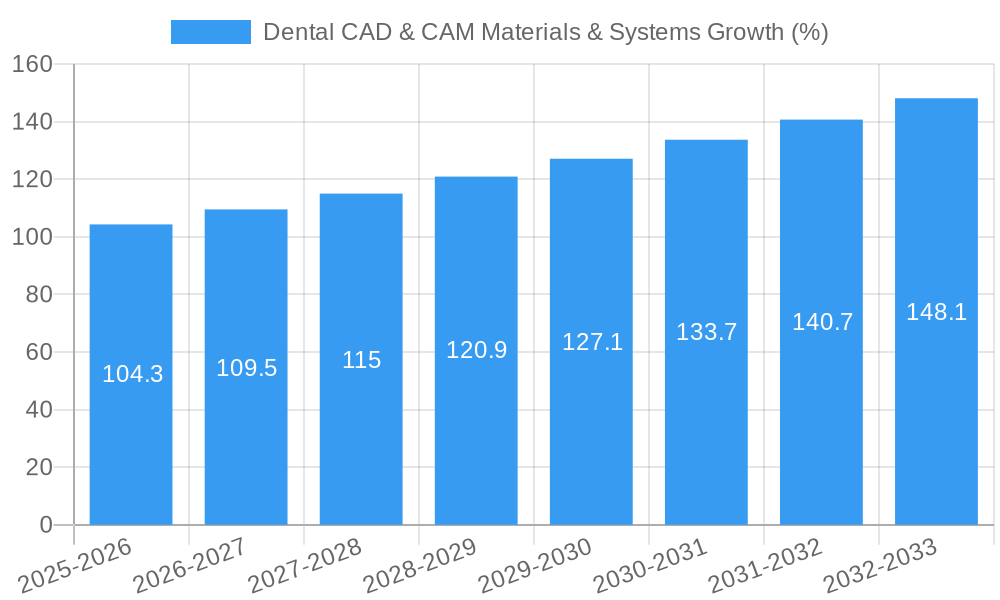
The global dental CAD/CAM materials and systems market, valued at $2068.4 million in 2025, is projected to experience robust growth, driven by several key factors. Technological advancements leading to more precise and efficient digital workflows are significantly impacting the market. The increasing adoption of minimally invasive procedures and the rising demand for aesthetically pleasing restorations are further fueling market expansion. Furthermore, the growing prevalence of dental diseases and an aging global population contribute to increased demand for dental treatments, indirectly boosting the market for CAD/CAM materials and systems. The market is witnessing a shift towards chairside CAD/CAM solutions, providing dentists with greater control and faster turnaround times. This trend, along with the development of biocompatible and high-performance materials, is shaping the competitive landscape.
Despite the positive outlook, certain challenges exist. High initial investment costs for CAD/CAM systems can be a barrier for smaller dental practices. Additionally, the need for specialized training and ongoing maintenance can present challenges for adoption. However, the long-term benefits, including improved efficiency, accuracy, and patient satisfaction, are likely to outweigh these initial hurdles. The market is highly competitive, with key players such as 3M, Dentsply Sirona, and Straumann constantly innovating to maintain their market share. This competitive landscape fosters continuous improvement and offers a diverse range of products and solutions for dentists worldwide. The forecast period of 2025-2033 suggests continued market expansion, driven by technological advancements and increasing demand.
Dental CAD & CAM Materials & Systems Market Report: 2019-2033
This comprehensive report provides a detailed analysis of the global Dental CAD & CAM Materials & Systems market, encompassing market dynamics, growth trends, regional dominance, product landscape, key players, and future outlook. The study period covers 2019-2033, with 2025 serving as the base and estimated year. The forecast period spans 2025-2033, and the historical period encompasses 2019-2024. This report is crucial for industry professionals, investors, and stakeholders seeking to understand and capitalize on opportunities within this rapidly evolving sector. The parent market is the Dental Equipment market (valued at xx million in 2025), while the child market is the digital dentistry segment.
Dental CAD & CAM Materials & Systems Market Dynamics & Structure
The Dental CAD/CAM Materials & Systems market is characterized by moderate concentration, with several key players holding significant market share. Technological innovation, particularly in materials science and software algorithms, is a primary growth driver. Stringent regulatory frameworks governing medical devices influence market access and product development. Competitive substitutes, such as traditional restorative techniques, exert pressure, while the rising adoption of digital dentistry fuels market expansion. End-user demographics, including an aging population and increasing dental awareness, contribute to demand. Consolidation through M&A activity is observed, with xx major deals recorded between 2019 and 2024, representing a xx% increase from the previous five-year period.
- Market Concentration: Moderately concentrated, with the top 5 players holding approximately xx% of the market share in 2025.
- Technological Innovation: Focus on biocompatible materials, improved software accuracy, and faster processing speeds.
- Regulatory Landscape: Stringent FDA and CE mark approvals influence market entry and product features.
- Competitive Substitutes: Traditional restorative methods (e.g., amalgam, composite) continue to compete.
- M&A Activity: Consolidation through acquisitions and mergers drives market expansion and innovation.
- Innovation Barriers: High R&D costs and stringent regulatory pathways pose challenges for new entrants.
Dental CAD & CAM Materials & Systems Growth Trends & Insights
The global Dental CAD & CAM Materials & Systems market is experiencing robust growth, driven by the increasing adoption of digital dentistry workflows. The market size is estimated at $xx million in 2025, exhibiting a CAGR of xx% during the historical period (2019-2024). This growth is projected to continue throughout the forecast period (2025-2033), reaching $xx million by 2033. Market penetration is increasing, particularly in developed regions, driven by factors such as improved accuracy, efficiency, and aesthetic outcomes compared to traditional methods. Technological advancements, such as AI-powered design software and the development of novel biocompatible materials, are further accelerating market growth. Shifting consumer preferences towards minimally invasive and aesthetically pleasing treatments also contribute positively.
Dominant Regions, Countries, or Segments in Dental CAD & CAM Materials & Systems
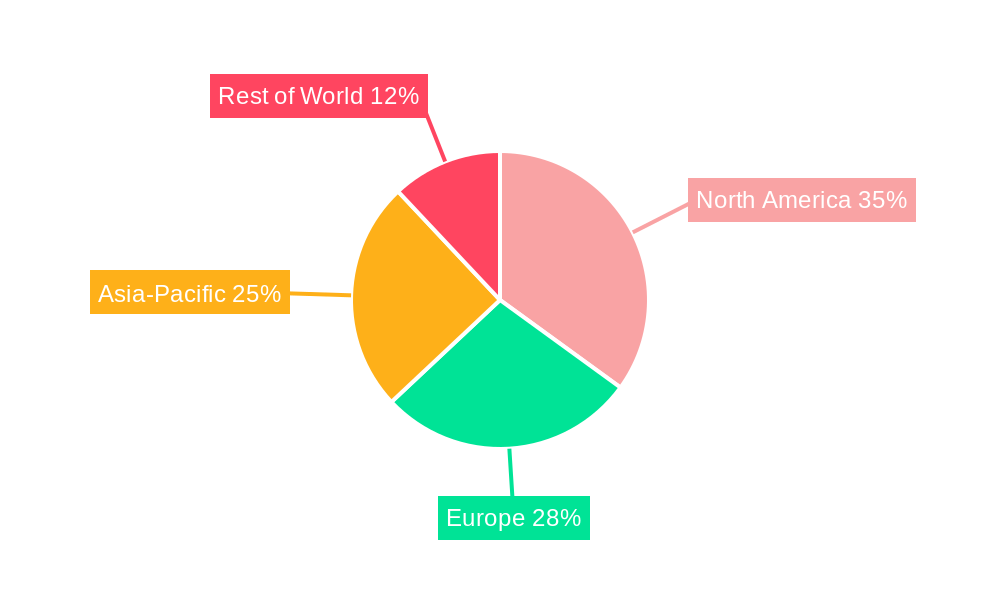
North America currently holds the largest market share in the Dental CAD & CAM Materials & Systems market, driven by high adoption rates, advanced infrastructure, and strong regulatory support. However, the Asia-Pacific region is expected to experience the fastest growth rate during the forecast period due to increasing dental awareness, rising disposable incomes, and growing investments in dental infrastructure. Within North America, the United States dominates due to its large dental market and high adoption of digital technologies. Europe holds a significant share, with Germany and France being key contributors.
- North America: High adoption rates, advanced infrastructure, robust regulatory support.
- Asia-Pacific: Rapid growth potential, driven by increasing dental awareness and disposable income.
- Europe: Significant market share, with strong presence in Germany and France.
- Rest of the World: Emerging markets with untapped potential, experiencing gradual market growth.
Dental CAD & CAM Materials & Systems Product Landscape
The market encompasses a wide range of materials, including zirconia, ceramic, PMMA, and composites, each tailored to specific applications. Software solutions for design and milling are integral, with advancements in AI-powered design and automated workflows enhancing efficiency and precision. The focus is on developing materials with enhanced biocompatibility, strength, and aesthetic properties. Unique selling propositions include improved precision, reduced treatment time, and enhanced patient comfort.
Key Drivers, Barriers & Challenges in Dental CAD & CAM Materials & Systems
Key Drivers: Rising demand for minimally invasive procedures, increasing adoption of digital workflows in dental practices, advancements in material science leading to stronger and more aesthetically pleasing restorations, and supportive government regulations.
Key Barriers & Challenges: High initial investment costs for equipment, a learning curve associated with CAD/CAM technology, limited availability of skilled professionals, supply chain disruptions impacting material availability, and stringent regulatory requirements for new product approvals which can delay market entry. Supply chain disruptions alone impacted the market by an estimated xx million in 2022.
Emerging Opportunities in Dental CAD & CAM Materials & Systems
Emerging opportunities include the integration of AI and machine learning for improved design and automated workflows, expansion into emerging markets with growing dental infrastructure, development of biocompatible and personalized materials, the introduction of 3D-printed temporary restorations, and the development of user-friendly software solutions to simplify the CAD/CAM workflow for dentists.
Growth Accelerators in the Dental CAD & CAM Materials & Systems Industry
Strategic partnerships between material manufacturers and software developers, technological breakthroughs leading to improved material properties and faster processing times, expansion into emerging markets, and the integration of CAD/CAM technology into wider dental workflows are all contributing to market expansion. Furthermore, increasing education and training programs for dental professionals are facilitating wider adoption.
Key Players Shaping the Dental CAD & CAM Materials & Systems Market
- 3M
- Amann Girrbach
- Danaher
- Dental Wings
- Dentsply Sirona
- Institut Straumann
- Ivoclar Vivadent
- PLANMECA
- Zimmer Biomet Holdings
- ZIRKONZAHN
- ALIGN TECHNOLOGY
- 3Shape
- Carestream Dental
- SHINING 3D TECH
Notable Milestones in Dental CAD & CAM Materials & Systems Sector
- 2020: Introduction of AI-powered design software by 3Shape significantly improves workflow efficiency.
- 2021: Dentsply Sirona acquires a key competitor, expanding its market share.
- 2022: Launch of a new biocompatible zirconia material by Zirkonzahn improves the esthetics and strength of restorations.
- 2023: Several companies introduce new milling machines that improve speed and precision.
- 2024: Increased investment in R&D by key players, driving innovation in materials and software.
In-Depth Dental CAD & CAM Materials & Systems Market Outlook
The future of the Dental CAD & CAM Materials & Systems market looks bright, with continued growth driven by technological advancements, increasing demand for digital dentistry, and expansion into emerging markets. Strategic partnerships, increased R&D investments, and the introduction of innovative materials and software solutions will shape the market's trajectory. The market presents significant opportunities for both established players and new entrants to capitalize on growing demand and emerging technological advancements. The integration of AI and machine learning will further revolutionize the industry, paving the way for greater efficiency, accuracy, and personalization in dental treatments.
Dental CAD & CAM Materials & Systems Segmentation
-
1. Application
- 1.1. Hospital
- 1.2. Dental Clinic
- 1.3. Others
-
2. Types
- 2.1. Glass Ceramics
- 2.2. Alumina-based Ceramics
- 2.3. Lithium Di-silicate
- 2.4. Zirconia
- 2.5. Others
Dental CAD & CAM Materials & Systems Segmentation By Geography
-
1. North America
- 1.1. United States
- 1.2. Canada
- 1.3. Mexico
-
2. South America
- 2.1. Brazil
- 2.2. Argentina
- 2.3. Rest of South America
-
3. Europe
- 3.1. United Kingdom
- 3.2. Germany
- 3.3. France
- 3.4. Italy
- 3.5. Spain
- 3.6. Russia
- 3.7. Benelux
- 3.8. Nordics
- 3.9. Rest of Europe
-
4. Middle East & Africa
- 4.1. Turkey
- 4.2. Israel
- 4.3. GCC
- 4.4. North Africa
- 4.5. South Africa
- 4.6. Rest of Middle East & Africa
-
5. Asia Pacific
- 5.1. China
- 5.2. India
- 5.3. Japan
- 5.4. South Korea
- 5.5. ASEAN
- 5.6. Oceania
- 5.7. Rest of Asia Pacific
Dental CAD & CAM Materials & Systems REPORT HIGHLIGHTS
| Aspects | Details |
|---|---|
| Study Period | 2019-2033 |
| Base Year | 2024 |
| Estimated Year | 2025 |
| Forecast Period | 2025-2033 |
| Historical Period | 2019-2024 |
| Growth Rate | CAGR of 5.1% from 2019-2033 |
| Segmentation |
|
Table of Contents
- 1. Introduction
- 1.1. Research Scope
- 1.2. Market Segmentation
- 1.3. Research Methodology
- 1.4. Definitions and Assumptions
- 2. Executive Summary
- 2.1. Introduction
- 3. Market Dynamics
- 3.1. Introduction
- 3.2. Market Drivers
- 3.3. Market Restrains
- 3.4. Market Trends
- 4. Market Factor Analysis
- 4.1. Porters Five Forces
- 4.2. Supply/Value Chain
- 4.3. PESTEL analysis
- 4.4. Market Entropy
- 4.5. Patent/Trademark Analysis
- 5. Global Dental CAD & CAM Materials & Systems Analysis, Insights and Forecast, 2019-2031
- 5.1. Market Analysis, Insights and Forecast - by Application
- 5.1.1. Hospital
- 5.1.2. Dental Clinic
- 5.1.3. Others
- 5.2. Market Analysis, Insights and Forecast - by Types
- 5.2.1. Glass Ceramics
- 5.2.2. Alumina-based Ceramics
- 5.2.3. Lithium Di-silicate
- 5.2.4. Zirconia
- 5.2.5. Others
- 5.3. Market Analysis, Insights and Forecast - by Region
- 5.3.1. North America
- 5.3.2. South America
- 5.3.3. Europe
- 5.3.4. Middle East & Africa
- 5.3.5. Asia Pacific
- 5.1. Market Analysis, Insights and Forecast - by Application
- 6. North America Dental CAD & CAM Materials & Systems Analysis, Insights and Forecast, 2019-2031
- 6.1. Market Analysis, Insights and Forecast - by Application
- 6.1.1. Hospital
- 6.1.2. Dental Clinic
- 6.1.3. Others
- 6.2. Market Analysis, Insights and Forecast - by Types
- 6.2.1. Glass Ceramics
- 6.2.2. Alumina-based Ceramics
- 6.2.3. Lithium Di-silicate
- 6.2.4. Zirconia
- 6.2.5. Others
- 6.1. Market Analysis, Insights and Forecast - by Application
- 7. South America Dental CAD & CAM Materials & Systems Analysis, Insights and Forecast, 2019-2031
- 7.1. Market Analysis, Insights and Forecast - by Application
- 7.1.1. Hospital
- 7.1.2. Dental Clinic
- 7.1.3. Others
- 7.2. Market Analysis, Insights and Forecast - by Types
- 7.2.1. Glass Ceramics
- 7.2.2. Alumina-based Ceramics
- 7.2.3. Lithium Di-silicate
- 7.2.4. Zirconia
- 7.2.5. Others
- 7.1. Market Analysis, Insights and Forecast - by Application
- 8. Europe Dental CAD & CAM Materials & Systems Analysis, Insights and Forecast, 2019-2031
- 8.1. Market Analysis, Insights and Forecast - by Application
- 8.1.1. Hospital
- 8.1.2. Dental Clinic
- 8.1.3. Others
- 8.2. Market Analysis, Insights and Forecast - by Types
- 8.2.1. Glass Ceramics
- 8.2.2. Alumina-based Ceramics
- 8.2.3. Lithium Di-silicate
- 8.2.4. Zirconia
- 8.2.5. Others
- 8.1. Market Analysis, Insights and Forecast - by Application
- 9. Middle East & Africa Dental CAD & CAM Materials & Systems Analysis, Insights and Forecast, 2019-2031
- 9.1. Market Analysis, Insights and Forecast - by Application
- 9.1.1. Hospital
- 9.1.2. Dental Clinic
- 9.1.3. Others
- 9.2. Market Analysis, Insights and Forecast - by Types
- 9.2.1. Glass Ceramics
- 9.2.2. Alumina-based Ceramics
- 9.2.3. Lithium Di-silicate
- 9.2.4. Zirconia
- 9.2.5. Others
- 9.1. Market Analysis, Insights and Forecast - by Application
- 10. Asia Pacific Dental CAD & CAM Materials & Systems Analysis, Insights and Forecast, 2019-2031
- 10.1. Market Analysis, Insights and Forecast - by Application
- 10.1.1. Hospital
- 10.1.2. Dental Clinic
- 10.1.3. Others
- 10.2. Market Analysis, Insights and Forecast - by Types
- 10.2.1. Glass Ceramics
- 10.2.2. Alumina-based Ceramics
- 10.2.3. Lithium Di-silicate
- 10.2.4. Zirconia
- 10.2.5. Others
- 10.1. Market Analysis, Insights and Forecast - by Application
- 11. Competitive Analysis
- 11.1. Global Market Share Analysis 2024
- 11.2. Company Profiles
- 11.2.1 3M
- 11.2.1.1. Overview
- 11.2.1.2. Products
- 11.2.1.3. SWOT Analysis
- 11.2.1.4. Recent Developments
- 11.2.1.5. Financials (Based on Availability)
- 11.2.2 Amann Girrbach
- 11.2.2.1. Overview
- 11.2.2.2. Products
- 11.2.2.3. SWOT Analysis
- 11.2.2.4. Recent Developments
- 11.2.2.5. Financials (Based on Availability)
- 11.2.3 Danaher
- 11.2.3.1. Overview
- 11.2.3.2. Products
- 11.2.3.3. SWOT Analysis
- 11.2.3.4. Recent Developments
- 11.2.3.5. Financials (Based on Availability)
- 11.2.4 Dental Wings
- 11.2.4.1. Overview
- 11.2.4.2. Products
- 11.2.4.3. SWOT Analysis
- 11.2.4.4. Recent Developments
- 11.2.4.5. Financials (Based on Availability)
- 11.2.5 Dentsply Sirona
- 11.2.5.1. Overview
- 11.2.5.2. Products
- 11.2.5.3. SWOT Analysis
- 11.2.5.4. Recent Developments
- 11.2.5.5. Financials (Based on Availability)
- 11.2.6 Institut Straumann
- 11.2.6.1. Overview
- 11.2.6.2. Products
- 11.2.6.3. SWOT Analysis
- 11.2.6.4. Recent Developments
- 11.2.6.5. Financials (Based on Availability)
- 11.2.7 Ivoclar Vivadent
- 11.2.7.1. Overview
- 11.2.7.2. Products
- 11.2.7.3. SWOT Analysis
- 11.2.7.4. Recent Developments
- 11.2.7.5. Financials (Based on Availability)
- 11.2.8 PLANMECA
- 11.2.8.1. Overview
- 11.2.8.2. Products
- 11.2.8.3. SWOT Analysis
- 11.2.8.4. Recent Developments
- 11.2.8.5. Financials (Based on Availability)
- 11.2.9 Zimmer Biomet Holdings
- 11.2.9.1. Overview
- 11.2.9.2. Products
- 11.2.9.3. SWOT Analysis
- 11.2.9.4. Recent Developments
- 11.2.9.5. Financials (Based on Availability)
- 11.2.10 ZIRKONZAHN
- 11.2.10.1. Overview
- 11.2.10.2. Products
- 11.2.10.3. SWOT Analysis
- 11.2.10.4. Recent Developments
- 11.2.10.5. Financials (Based on Availability)
- 11.2.11 ALIGN TECHNOLOGY
- 11.2.11.1. Overview
- 11.2.11.2. Products
- 11.2.11.3. SWOT Analysis
- 11.2.11.4. Recent Developments
- 11.2.11.5. Financials (Based on Availability)
- 11.2.12 3Shape
- 11.2.12.1. Overview
- 11.2.12.2. Products
- 11.2.12.3. SWOT Analysis
- 11.2.12.4. Recent Developments
- 11.2.12.5. Financials (Based on Availability)
- 11.2.13 Carestream Dental
- 11.2.13.1. Overview
- 11.2.13.2. Products
- 11.2.13.3. SWOT Analysis
- 11.2.13.4. Recent Developments
- 11.2.13.5. Financials (Based on Availability)
- 11.2.14 SHINING 3D TECH
- 11.2.14.1. Overview
- 11.2.14.2. Products
- 11.2.14.3. SWOT Analysis
- 11.2.14.4. Recent Developments
- 11.2.14.5. Financials (Based on Availability)
- 11.2.1 3M
List of Figures
- Figure 1: Global Dental CAD & CAM Materials & Systems Revenue Breakdown (million, %) by Region 2024 & 2032
- Figure 2: North America Dental CAD & CAM Materials & Systems Revenue (million), by Application 2024 & 2032
- Figure 3: North America Dental CAD & CAM Materials & Systems Revenue Share (%), by Application 2024 & 2032
- Figure 4: North America Dental CAD & CAM Materials & Systems Revenue (million), by Types 2024 & 2032
- Figure 5: North America Dental CAD & CAM Materials & Systems Revenue Share (%), by Types 2024 & 2032
- Figure 6: North America Dental CAD & CAM Materials & Systems Revenue (million), by Country 2024 & 2032
- Figure 7: North America Dental CAD & CAM Materials & Systems Revenue Share (%), by Country 2024 & 2032
- Figure 8: South America Dental CAD & CAM Materials & Systems Revenue (million), by Application 2024 & 2032
- Figure 9: South America Dental CAD & CAM Materials & Systems Revenue Share (%), by Application 2024 & 2032
- Figure 10: South America Dental CAD & CAM Materials & Systems Revenue (million), by Types 2024 & 2032
- Figure 11: South America Dental CAD & CAM Materials & Systems Revenue Share (%), by Types 2024 & 2032
- Figure 12: South America Dental CAD & CAM Materials & Systems Revenue (million), by Country 2024 & 2032
- Figure 13: South America Dental CAD & CAM Materials & Systems Revenue Share (%), by Country 2024 & 2032
- Figure 14: Europe Dental CAD & CAM Materials & Systems Revenue (million), by Application 2024 & 2032
- Figure 15: Europe Dental CAD & CAM Materials & Systems Revenue Share (%), by Application 2024 & 2032
- Figure 16: Europe Dental CAD & CAM Materials & Systems Revenue (million), by Types 2024 & 2032
- Figure 17: Europe Dental CAD & CAM Materials & Systems Revenue Share (%), by Types 2024 & 2032
- Figure 18: Europe Dental CAD & CAM Materials & Systems Revenue (million), by Country 2024 & 2032
- Figure 19: Europe Dental CAD & CAM Materials & Systems Revenue Share (%), by Country 2024 & 2032
- Figure 20: Middle East & Africa Dental CAD & CAM Materials & Systems Revenue (million), by Application 2024 & 2032
- Figure 21: Middle East & Africa Dental CAD & CAM Materials & Systems Revenue Share (%), by Application 2024 & 2032
- Figure 22: Middle East & Africa Dental CAD & CAM Materials & Systems Revenue (million), by Types 2024 & 2032
- Figure 23: Middle East & Africa Dental CAD & CAM Materials & Systems Revenue Share (%), by Types 2024 & 2032
- Figure 24: Middle East & Africa Dental CAD & CAM Materials & Systems Revenue (million), by Country 2024 & 2032
- Figure 25: Middle East & Africa Dental CAD & CAM Materials & Systems Revenue Share (%), by Country 2024 & 2032
- Figure 26: Asia Pacific Dental CAD & CAM Materials & Systems Revenue (million), by Application 2024 & 2032
- Figure 27: Asia Pacific Dental CAD & CAM Materials & Systems Revenue Share (%), by Application 2024 & 2032
- Figure 28: Asia Pacific Dental CAD & CAM Materials & Systems Revenue (million), by Types 2024 & 2032
- Figure 29: Asia Pacific Dental CAD & CAM Materials & Systems Revenue Share (%), by Types 2024 & 2032
- Figure 30: Asia Pacific Dental CAD & CAM Materials & Systems Revenue (million), by Country 2024 & 2032
- Figure 31: Asia Pacific Dental CAD & CAM Materials & Systems Revenue Share (%), by Country 2024 & 2032
List of Tables
- Table 1: Global Dental CAD & CAM Materials & Systems Revenue million Forecast, by Region 2019 & 2032
- Table 2: Global Dental CAD & CAM Materials & Systems Revenue million Forecast, by Application 2019 & 2032
- Table 3: Global Dental CAD & CAM Materials & Systems Revenue million Forecast, by Types 2019 & 2032
- Table 4: Global Dental CAD & CAM Materials & Systems Revenue million Forecast, by Region 2019 & 2032
- Table 5: Global Dental CAD & CAM Materials & Systems Revenue million Forecast, by Application 2019 & 2032
- Table 6: Global Dental CAD & CAM Materials & Systems Revenue million Forecast, by Types 2019 & 2032
- Table 7: Global Dental CAD & CAM Materials & Systems Revenue million Forecast, by Country 2019 & 2032
- Table 8: United States Dental CAD & CAM Materials & Systems Revenue (million) Forecast, by Application 2019 & 2032
- Table 9: Canada Dental CAD & CAM Materials & Systems Revenue (million) Forecast, by Application 2019 & 2032
- Table 10: Mexico Dental CAD & CAM Materials & Systems Revenue (million) Forecast, by Application 2019 & 2032
- Table 11: Global Dental CAD & CAM Materials & Systems Revenue million Forecast, by Application 2019 & 2032
- Table 12: Global Dental CAD & CAM Materials & Systems Revenue million Forecast, by Types 2019 & 2032
- Table 13: Global Dental CAD & CAM Materials & Systems Revenue million Forecast, by Country 2019 & 2032
- Table 14: Brazil Dental CAD & CAM Materials & Systems Revenue (million) Forecast, by Application 2019 & 2032
- Table 15: Argentina Dental CAD & CAM Materials & Systems Revenue (million) Forecast, by Application 2019 & 2032
- Table 16: Rest of South America Dental CAD & CAM Materials & Systems Revenue (million) Forecast, by Application 2019 & 2032
- Table 17: Global Dental CAD & CAM Materials & Systems Revenue million Forecast, by Application 2019 & 2032
- Table 18: Global Dental CAD & CAM Materials & Systems Revenue million Forecast, by Types 2019 & 2032
- Table 19: Global Dental CAD & CAM Materials & Systems Revenue million Forecast, by Country 2019 & 2032
- Table 20: United Kingdom Dental CAD & CAM Materials & Systems Revenue (million) Forecast, by Application 2019 & 2032
- Table 21: Germany Dental CAD & CAM Materials & Systems Revenue (million) Forecast, by Application 2019 & 2032
- Table 22: France Dental CAD & CAM Materials & Systems Revenue (million) Forecast, by Application 2019 & 2032
- Table 23: Italy Dental CAD & CAM Materials & Systems Revenue (million) Forecast, by Application 2019 & 2032
- Table 24: Spain Dental CAD & CAM Materials & Systems Revenue (million) Forecast, by Application 2019 & 2032
- Table 25: Russia Dental CAD & CAM Materials & Systems Revenue (million) Forecast, by Application 2019 & 2032
- Table 26: Benelux Dental CAD & CAM Materials & Systems Revenue (million) Forecast, by Application 2019 & 2032
- Table 27: Nordics Dental CAD & CAM Materials & Systems Revenue (million) Forecast, by Application 2019 & 2032
- Table 28: Rest of Europe Dental CAD & CAM Materials & Systems Revenue (million) Forecast, by Application 2019 & 2032
- Table 29: Global Dental CAD & CAM Materials & Systems Revenue million Forecast, by Application 2019 & 2032
- Table 30: Global Dental CAD & CAM Materials & Systems Revenue million Forecast, by Types 2019 & 2032
- Table 31: Global Dental CAD & CAM Materials & Systems Revenue million Forecast, by Country 2019 & 2032
- Table 32: Turkey Dental CAD & CAM Materials & Systems Revenue (million) Forecast, by Application 2019 & 2032
- Table 33: Israel Dental CAD & CAM Materials & Systems Revenue (million) Forecast, by Application 2019 & 2032
- Table 34: GCC Dental CAD & CAM Materials & Systems Revenue (million) Forecast, by Application 2019 & 2032
- Table 35: North Africa Dental CAD & CAM Materials & Systems Revenue (million) Forecast, by Application 2019 & 2032
- Table 36: South Africa Dental CAD & CAM Materials & Systems Revenue (million) Forecast, by Application 2019 & 2032
- Table 37: Rest of Middle East & Africa Dental CAD & CAM Materials & Systems Revenue (million) Forecast, by Application 2019 & 2032
- Table 38: Global Dental CAD & CAM Materials & Systems Revenue million Forecast, by Application 2019 & 2032
- Table 39: Global Dental CAD & CAM Materials & Systems Revenue million Forecast, by Types 2019 & 2032
- Table 40: Global Dental CAD & CAM Materials & Systems Revenue million Forecast, by Country 2019 & 2032
- Table 41: China Dental CAD & CAM Materials & Systems Revenue (million) Forecast, by Application 2019 & 2032
- Table 42: India Dental CAD & CAM Materials & Systems Revenue (million) Forecast, by Application 2019 & 2032
- Table 43: Japan Dental CAD & CAM Materials & Systems Revenue (million) Forecast, by Application 2019 & 2032
- Table 44: South Korea Dental CAD & CAM Materials & Systems Revenue (million) Forecast, by Application 2019 & 2032
- Table 45: ASEAN Dental CAD & CAM Materials & Systems Revenue (million) Forecast, by Application 2019 & 2032
- Table 46: Oceania Dental CAD & CAM Materials & Systems Revenue (million) Forecast, by Application 2019 & 2032
- Table 47: Rest of Asia Pacific Dental CAD & CAM Materials & Systems Revenue (million) Forecast, by Application 2019 & 2032
Frequently Asked Questions
1. What is the projected Compound Annual Growth Rate (CAGR) of the Dental CAD & CAM Materials & Systems?
The projected CAGR is approximately 5.1%.
2. Which companies are prominent players in the Dental CAD & CAM Materials & Systems?
Key companies in the market include 3M, Amann Girrbach, Danaher, Dental Wings, Dentsply Sirona, Institut Straumann, Ivoclar Vivadent, PLANMECA, Zimmer Biomet Holdings, ZIRKONZAHN, ALIGN TECHNOLOGY, 3Shape, Carestream Dental, SHINING 3D TECH.
3. What are the main segments of the Dental CAD & CAM Materials & Systems?
The market segments include Application, Types.
4. Can you provide details about the market size?
The market size is estimated to be USD 2068.4 million as of 2022.
5. What are some drivers contributing to market growth?
N/A
6. What are the notable trends driving market growth?
N/A
7. Are there any restraints impacting market growth?
N/A
8. Can you provide examples of recent developments in the market?
N/A
9. What pricing options are available for accessing the report?
Pricing options include single-user, multi-user, and enterprise licenses priced at USD 4900.00, USD 7350.00, and USD 9800.00 respectively.
10. Is the market size provided in terms of value or volume?
The market size is provided in terms of value, measured in million.
11. Are there any specific market keywords associated with the report?
Yes, the market keyword associated with the report is "Dental CAD & CAM Materials & Systems," which aids in identifying and referencing the specific market segment covered.
12. How do I determine which pricing option suits my needs best?
The pricing options vary based on user requirements and access needs. Individual users may opt for single-user licenses, while businesses requiring broader access may choose multi-user or enterprise licenses for cost-effective access to the report.
13. Are there any additional resources or data provided in the Dental CAD & CAM Materials & Systems report?
While the report offers comprehensive insights, it's advisable to review the specific contents or supplementary materials provided to ascertain if additional resources or data are available.
14. How can I stay updated on further developments or reports in the Dental CAD & CAM Materials & Systems?
To stay informed about further developments, trends, and reports in the Dental CAD & CAM Materials & Systems, consider subscribing to industry newsletters, following relevant companies and organizations, or regularly checking reputable industry news sources and publications.
Methodology
Step 1 - Identification of Relevant Samples Size from Population Database


Step 2 - Approaches for Defining Global Market Size (Value, Volume* & Price*)

Note*: In applicable scenarios
Step 3 - Data Sources
Primary Research
- Web Analytics
- Survey Reports
- Research Institute
- Latest Research Reports
- Opinion Leaders
Secondary Research
- Annual Reports
- White Paper
- Latest Press Release
- Industry Association
- Paid Database
- Investor Presentations

Step 4 - Data Triangulation
Involves using different sources of information in order to increase the validity of a study
These sources are likely to be stakeholders in a program - participants, other researchers, program staff, other community members, and so on.
Then we put all data in single framework & apply various statistical tools to find out the dynamic on the market.
During the analysis stage, feedback from the stakeholder groups would be compared to determine areas of agreement as well as areas of divergence
