

Key Insights
The global microarray analysis market is poised for substantial expansion, propelled by the escalating incidence of chronic diseases, the burgeoning adoption of personalized medicine, and intensified research in genomics and proteomics. The market, valued at $6.9 billion in the base year 2025, is projected to grow at a compound annual growth rate (CAGR) of 5.7%, reaching an estimated significant value by 2033. This growth trajectory is underpinned by technological innovations enhancing throughput, sensitivity, and cost-effectiveness in microarray analysis. The development of novel applications in oncology, infectious disease diagnostics, and agricultural research further fuels market expansion.
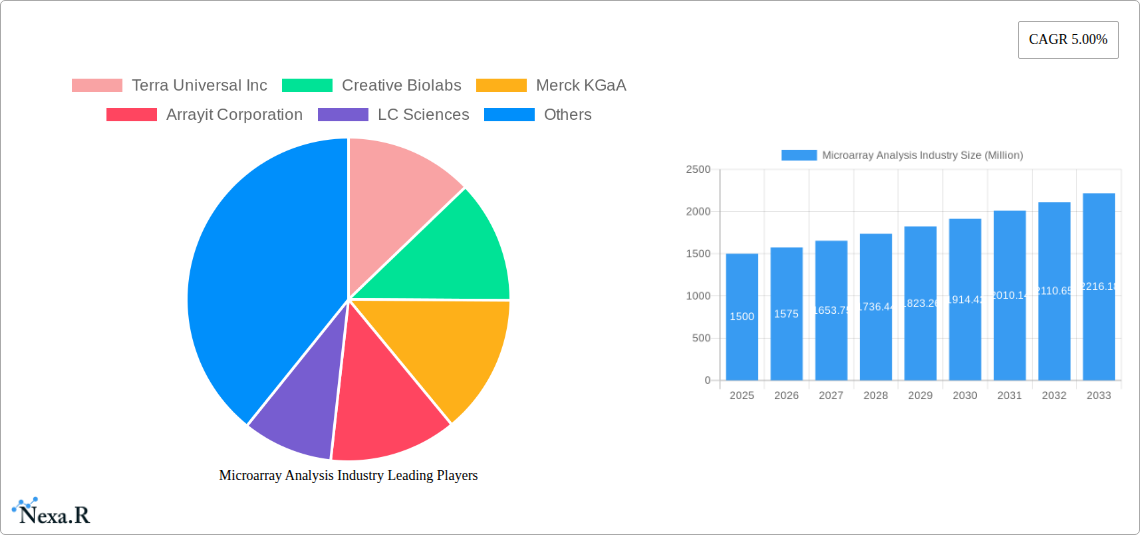
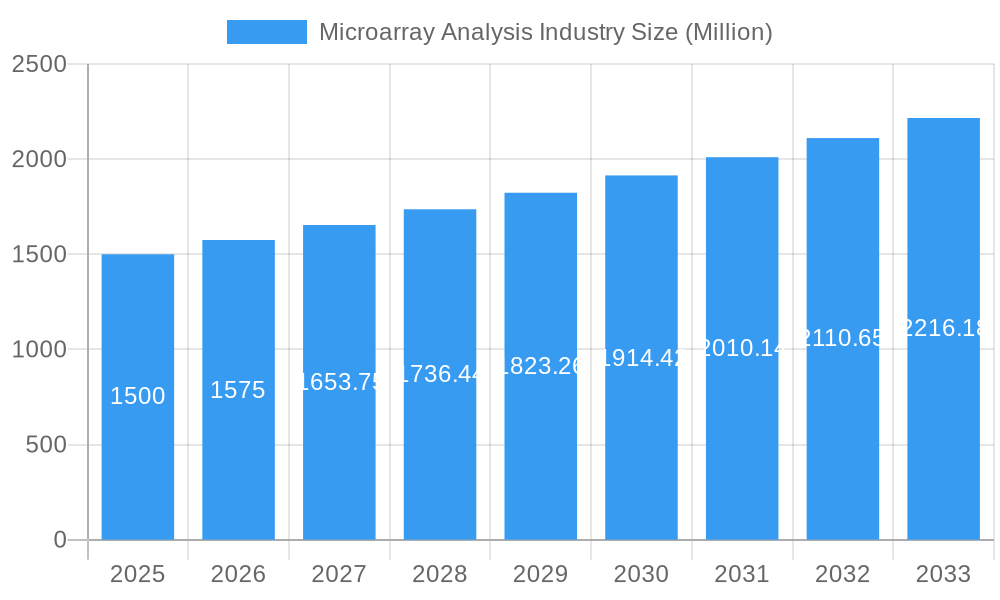
Microarray Analysis Industry Market Size (In Billion)
Key market segments include instruments, driven by scanner technology advancements; reagents, essential for analysis; and services, with growing demand for complex data interpretation. Pharmaceutical and biotechnology companies are primary end-users, leveraging microarrays for drug discovery. Hospitals are increasingly integrating microarray technology for enhanced diagnostics, while academic institutions remain critical for research advancements. Geographically, North America and Europe currently dominate, with the Asia-Pacific region expected to exhibit the most rapid growth due to rising healthcare investments and technological progress. Potential restraints include high initial investment and the availability of alternative technologies.
Microarray Analysis Industry Company Market Share
Microarray Analysis Industry Market Report: 2019-2033
This comprehensive report provides a detailed analysis of the Microarray Analysis industry, encompassing market size, growth trends, competitive landscape, and future outlook. The study period covers 2019-2033, with 2025 as the base and estimated year. This report is crucial for industry professionals, investors, and researchers seeking insights into this dynamic sector.
Parent Market: Life Sciences Research Tools and Services Market Child Market: Genomics and Proteomics Research Market
Microarray Analysis Industry Market Dynamics & Structure
The Microarray Analysis market, valued at xx Million in 2025, exhibits a moderately concentrated structure with key players holding significant market share. Technological innovation, particularly in high-throughput screening and next-generation sequencing (NGS), is a primary growth driver. Stringent regulatory frameworks, especially concerning data privacy and clinical validation, impact market expansion. Competitive substitutes, such as PCR and next-generation sequencing, pose challenges, while the increasing prevalence of chronic diseases fuels demand. End-user demographics, notably a growing emphasis on personalized medicine within pharmaceutical and biotechnology companies, are shaping market dynamics. Mergers and acquisitions (M&A) activity, as evidenced by recent deals, suggests consolidation and a pursuit of technological expertise.
- Market Concentration: Moderately concentrated, with top 5 players holding approximately xx% market share in 2025.
- Technological Innovation: High-throughput screening, NGS integration driving growth.
- Regulatory Framework: Stringent regulations concerning data privacy and clinical validation.
- Competitive Substitutes: PCR and NGS pose competitive pressure.
- End-User Demographics: Growing demand from pharmaceutical and biotechnology companies due to personalized medicine focus.
- M&A Trends: Increasing consolidation through strategic acquisitions, xx major deals observed in the past 3 years.
Microarray Analysis Industry Growth Trends & Insights
The Microarray Analysis market experienced robust growth during the historical period (2019-2024), primarily driven by advancements in technology, increased adoption in research and development, and the rising prevalence of chronic diseases. The market is projected to witness a CAGR of xx% from 2025 to 2033, reaching a value of xx Million by 2033. This growth is further fueled by the increasing adoption of microarray technology in various applications, such as drug discovery, disease diagnostics, and personalized medicine. Technological disruptions, particularly the integration of AI and machine learning for data analysis, are enhancing the efficiency and accuracy of microarray analysis, driving market expansion. Consumer behavior shifts towards personalized healthcare solutions are also bolstering demand. Market penetration within the research and academic institutes segment is projected to reach xx% by 2033.
Dominant Regions, Countries, or Segments in Microarray Analysis Industry
North America currently dominates the Microarray Analysis market, holding the largest market share in 2025, primarily driven by robust research and development activities, high adoption rates in pharmaceutical and biotechnology companies, and strong regulatory support. Europe follows as a significant market, boosted by growing investments in healthcare infrastructure and increasing prevalence of chronic diseases. Within the segments, the reagents segment holds the largest share, reflecting the high demand for consumables in microarray experiments. Pharmaceutical and biotechnology companies are the largest end-users, owing to their extensive research and development activities focused on drug discovery and personalized medicine.
- Key Drivers in North America: Strong R&D investments, high adoption rates in pharma/biotech, supportive regulatory environment.
- Key Drivers in Europe: Growing healthcare infrastructure investment, increasing prevalence of chronic diseases.
- Dominant Segment (Type): Reagents segment holds the largest market share due to high consumable demand.
- Dominant Segment (End-User): Pharmaceutical and Biotechnology companies represent the largest end-user segment.
Microarray Analysis Industry Product Landscape
Microarray analysis products encompass a range of instruments, reagents, and services, each catering to specific research needs. Technological advancements have led to the development of high-throughput systems, improved data analysis software, and specialized reagents enabling greater sensitivity and specificity. Unique selling propositions often focus on ease of use, reduced turnaround time, high data quality, and cost-effectiveness. Innovations in miniaturization and multiplexing are increasing the efficiency and accessibility of microarray analysis.
Key Drivers, Barriers & Challenges in Microarray Analysis Industry
Key Drivers:
- Advancements in microarray technology, leading to higher throughput and sensitivity.
- Increased focus on personalized medicine and diagnostics.
- Growing investments in life sciences research.
Key Challenges:
- High initial investment costs for equipment.
- Data analysis complexity and interpretation challenges.
- Competition from alternative technologies (NGS, PCR).
- xx% decrease in funding for certain research projects in 2023 impacted the market negatively.
Emerging Opportunities in Microarray Analysis Industry
- Expanding applications in clinical diagnostics, particularly for personalized cancer therapies.
- Development of new microarray platforms with improved sensitivity and resolution.
- Integration of artificial intelligence for data analysis and interpretation.
- Untapped markets in developing economies with growing healthcare infrastructure investment.
Growth Accelerators in the Microarray Analysis Industry
Strategic partnerships between technology providers and pharmaceutical companies are driving innovation and market expansion. Technological breakthroughs, including advancements in bioinformatics and data analysis, improve the efficiency and accessibility of microarray analysis. Focus on expanding into new geographical markets, especially in developing economies, and increased marketing efforts to educate and broaden the user base, are also significantly contributing to market growth.
Key Players Shaping the Microarray Analysis Industry Market
- Terra Universal Inc
- Creative Biolabs
- Merck KGaA
- Arrayit Corporation
- LC Sciences
- Thermo Fischer Scientific (Affymetrix)
- PEPperPRINT
- Bio-Rad Laboratories
- JPT Peptide Technologies
- Grace Bio-Labs
- ProImmune Ltd
Notable Milestones in Microarray Analysis Industry Sector
- June 2022: Ariceum Therapeutics secured EUR 25M Series A funding to advance its Satoreotide cancer treatment, indicating investor confidence in the therapeutic applications of microarray analysis.
- May 2022: Pfizer's acquisition of Biohaven, a migraine therapy company, highlights the industry’s consolidation and expansion into related therapeutic areas.
In-Depth Microarray Analysis Industry Market Outlook
The future of the Microarray Analysis market is promising, driven by ongoing technological advancements, increased adoption across various applications, and expanding market penetration in emerging economies. Strategic partnerships, investments in R&D, and the continued development of sophisticated data analysis tools will further fuel market growth. Opportunities exist in developing novel applications and expanding into untapped markets, creating a robust and promising outlook for the coming decade.
Microarray Analysis Industry Segmentation
-
1. Type
- 1.1. Instruments
- 1.2. Reagents
- 1.3. Services
-
2. End User
- 2.1. Hospitals
- 2.2. Pharmaceutical and Biotechnology Companies
- 2.3. Research and Academic Institutes
Microarray Analysis Industry Segmentation By Geography
-
1. North America
- 1.1. United States
- 1.2. Canada
- 1.3. Mexico
-
2. Europe
- 2.1. Germany
- 2.2. United Kingdom
- 2.3. France
- 2.4. Italy
- 2.5. Spain
- 2.6. Rest of Europe
-
3. Asia Pacific
- 3.1. China
- 3.2. Japan
- 3.3. India
- 3.4. Australia
- 3.5. South Korea
- 3.6. Rest of Asia Pacific
- 4. Middle East
-
5. GCC
- 5.1. South Africa
- 5.2. Rest of Middle East
-
6. South America
- 6.1. Brazil
- 6.2. Argentina
- 6.3. Rest of South America
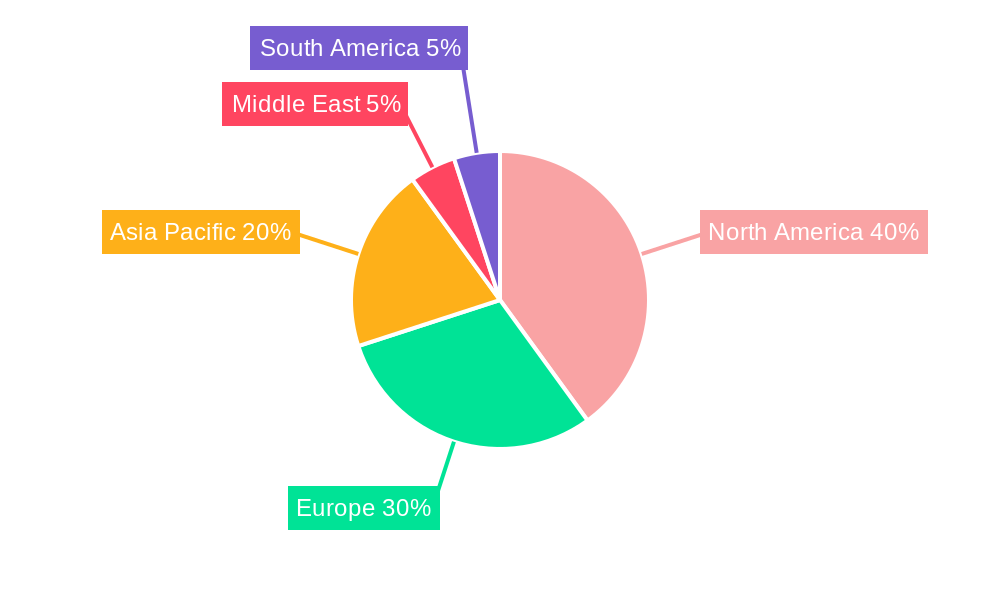
Microarray Analysis Industry Regional Market Share
Geographic Coverage of Microarray Analysis Industry
Microarray Analysis Industry REPORT HIGHLIGHTS
| Aspects | Details |
|---|---|
| Study Period | 2020-2034 |
| Base Year | 2025 |
| Estimated Year | 2026 |
| Forecast Period | 2026-2034 |
| Historical Period | 2020-2025 |
| Growth Rate | CAGR of 5.7% from 2020-2034 |
| Segmentation |
|
Table of Contents
- 1. Introduction
- 1.1. Research Scope
- 1.2. Market Segmentation
- 1.3. Research Objective
- 1.4. Definitions and Assumptions
- 2. Executive Summary
- 2.1. Market Snapshot
- 3. Market Dynamics
- 3.1. Market Drivers
- 3.2. Market Restrains
- 3.3. Market Trends
- 3.4. Market Opportunities
- 4. Market Factor Analysis
- 4.1. Porters Five Forces
- 4.1.1. Bargaining Power of Suppliers
- 4.1.2. Bargaining Power of Buyers
- 4.1.3. Threat of New Entrants
- 4.1.4. Threat of Substitutes
- 4.1.5. Competitive Rivalry
- 4.2. PESTEL analysis
- 4.3. BCG Analysis
- 4.3.1. Stars (High Growth, High Market Share)
- 4.3.2. Cash Cows (Low Growth, High Market Share)
- 4.3.3. Question Mark (High Growth, Low Market Share)
- 4.3.4. Dogs (Low Growth, Low Market Share)
- 4.4. Ansoff Matrix Analysis
- 4.5. Supply Chain Analysis
- 4.6. Regulatory Landscape
- 4.7. Current Market Potential and Opportunity Assessment (TAM–SAM–SOM Framework)
- 4.8. NRP Analyst Note
- 4.1. Porters Five Forces
- 5. Market Analysis, Insights and Forecast 2021-2033
- 5.1. Market Analysis, Insights and Forecast - by Type
- 5.1.1. Instruments
- 5.1.2. Reagents
- 5.1.3. Services
- 5.2. Market Analysis, Insights and Forecast - by End User
- 5.2.1. Hospitals
- 5.2.2. Pharmaceutical and Biotechnology Companies
- 5.2.3. Research and Academic Institutes
- 5.3. Market Analysis, Insights and Forecast - by Region
- 5.3.1. North America
- 5.3.2. Europe
- 5.3.3. Asia Pacific
- 5.3.4. Middle East
- 5.3.5. GCC
- 5.3.6. South America
- 5.1. Market Analysis, Insights and Forecast - by Type
- 6. Global Microarray Analysis Industry Analysis, Insights and Forecast, 2021-2033
- 6.1. Market Analysis, Insights and Forecast - by Type
- 6.1.1. Instruments
- 6.1.2. Reagents
- 6.1.3. Services
- 6.2. Market Analysis, Insights and Forecast - by End User
- 6.2.1. Hospitals
- 6.2.2. Pharmaceutical and Biotechnology Companies
- 6.2.3. Research and Academic Institutes
- 6.1. Market Analysis, Insights and Forecast - by Type
- 7. North America Microarray Analysis Industry Analysis, Insights and Forecast, 2020-2032
- 7.1. Market Analysis, Insights and Forecast - by Type
- 7.1.1. Instruments
- 7.1.2. Reagents
- 7.1.3. Services
- 7.2. Market Analysis, Insights and Forecast - by End User
- 7.2.1. Hospitals
- 7.2.2. Pharmaceutical and Biotechnology Companies
- 7.2.3. Research and Academic Institutes
- 7.1. Market Analysis, Insights and Forecast - by Type
- 8. Europe Microarray Analysis Industry Analysis, Insights and Forecast, 2020-2032
- 8.1. Market Analysis, Insights and Forecast - by Type
- 8.1.1. Instruments
- 8.1.2. Reagents
- 8.1.3. Services
- 8.2. Market Analysis, Insights and Forecast - by End User
- 8.2.1. Hospitals
- 8.2.2. Pharmaceutical and Biotechnology Companies
- 8.2.3. Research and Academic Institutes
- 8.1. Market Analysis, Insights and Forecast - by Type
- 9. Asia Pacific Microarray Analysis Industry Analysis, Insights and Forecast, 2020-2032
- 9.1. Market Analysis, Insights and Forecast - by Type
- 9.1.1. Instruments
- 9.1.2. Reagents
- 9.1.3. Services
- 9.2. Market Analysis, Insights and Forecast - by End User
- 9.2.1. Hospitals
- 9.2.2. Pharmaceutical and Biotechnology Companies
- 9.2.3. Research and Academic Institutes
- 9.1. Market Analysis, Insights and Forecast - by Type
- 10. Middle East Microarray Analysis Industry Analysis, Insights and Forecast, 2020-2032
- 10.1. Market Analysis, Insights and Forecast - by Type
- 10.1.1. Instruments
- 10.1.2. Reagents
- 10.1.3. Services
- 10.2. Market Analysis, Insights and Forecast - by End User
- 10.2.1. Hospitals
- 10.2.2. Pharmaceutical and Biotechnology Companies
- 10.2.3. Research and Academic Institutes
- 10.1. Market Analysis, Insights and Forecast - by Type
- 11. GCC Microarray Analysis Industry Analysis, Insights and Forecast, 2020-2032
- 11.1. Market Analysis, Insights and Forecast - by Type
- 11.1.1. Instruments
- 11.1.2. Reagents
- 11.1.3. Services
- 11.2. Market Analysis, Insights and Forecast - by End User
- 11.2.1. Hospitals
- 11.2.2. Pharmaceutical and Biotechnology Companies
- 11.2.3. Research and Academic Institutes
- 11.1. Market Analysis, Insights and Forecast - by Type
- 12. South America Microarray Analysis Industry Analysis, Insights and Forecast, 2020-2032
- 12.1. Market Analysis, Insights and Forecast - by Type
- 12.1.1. Instruments
- 12.1.2. Reagents
- 12.1.3. Services
- 12.2. Market Analysis, Insights and Forecast - by End User
- 12.2.1. Hospitals
- 12.2.2. Pharmaceutical and Biotechnology Companies
- 12.2.3. Research and Academic Institutes
- 12.1. Market Analysis, Insights and Forecast - by Type
- 13. Competitive Analysis
- 13.1. Company Profiles
- 13.1.1 Terra Universal Inc
- 13.1.1.1. Company Overview
- 13.1.1.2. Products
- 13.1.1.3. Company Financials
- 13.1.1.4. SWOT Analysis
- 13.1.2 Creative Biolabs
- 13.1.2.1. Company Overview
- 13.1.2.2. Products
- 13.1.2.3. Company Financials
- 13.1.2.4. SWOT Analysis
- 13.1.3 Merck KGaA
- 13.1.3.1. Company Overview
- 13.1.3.2. Products
- 13.1.3.3. Company Financials
- 13.1.3.4. SWOT Analysis
- 13.1.4 Arrayit Corporation
- 13.1.4.1. Company Overview
- 13.1.4.2. Products
- 13.1.4.3. Company Financials
- 13.1.4.4. SWOT Analysis
- 13.1.5 LC Sciences
- 13.1.5.1. Company Overview
- 13.1.5.2. Products
- 13.1.5.3. Company Financials
- 13.1.5.4. SWOT Analysis
- 13.1.6 Thermo Fischer Scientific (Affymetrix)
- 13.1.6.1. Company Overview
- 13.1.6.2. Products
- 13.1.6.3. Company Financials
- 13.1.6.4. SWOT Analysis
- 13.1.7 PEPperPRINT
- 13.1.7.1. Company Overview
- 13.1.7.2. Products
- 13.1.7.3. Company Financials
- 13.1.7.4. SWOT Analysis
- 13.1.8 Bio-Rad Laboratories
- 13.1.8.1. Company Overview
- 13.1.8.2. Products
- 13.1.8.3. Company Financials
- 13.1.8.4. SWOT Analysis
- 13.1.9 JPT Peptide Technologies
- 13.1.9.1. Company Overview
- 13.1.9.2. Products
- 13.1.9.3. Company Financials
- 13.1.9.4. SWOT Analysis
- 13.1.10 Grace Bio-Labs
- 13.1.10.1. Company Overview
- 13.1.10.2. Products
- 13.1.10.3. Company Financials
- 13.1.10.4. SWOT Analysis
- 13.1.11 ProImmune Ltd
- 13.1.11.1. Company Overview
- 13.1.11.2. Products
- 13.1.11.3. Company Financials
- 13.1.11.4. SWOT Analysis
- 13.1.1 Terra Universal Inc
- 13.2. Market Entropy
- 13.2.1 Company's Key Areas Served
- 13.2.2 Recent Developments
- 13.3. Company Market Share Analysis 2025
- 13.3.1 Top 5 Companies Market Share Analysis
- 13.3.2 Top 3 Companies Market Share Analysis
- 13.4. List of Potential Customers
- 14. Research Methodology
List of Figures
- Figure 1: Global Microarray Analysis Industry Revenue Breakdown (billion, %) by Region 2025 & 2033
- Figure 2: Global Microarray Analysis Industry Volume Breakdown (K Unit, %) by Region 2025 & 2033
- Figure 3: North America Microarray Analysis Industry Revenue (billion), by Type 2025 & 2033
- Figure 4: North America Microarray Analysis Industry Volume (K Unit), by Type 2025 & 2033
- Figure 5: North America Microarray Analysis Industry Revenue Share (%), by Type 2025 & 2033
- Figure 6: North America Microarray Analysis Industry Volume Share (%), by Type 2025 & 2033
- Figure 7: North America Microarray Analysis Industry Revenue (billion), by End User 2025 & 2033
- Figure 8: North America Microarray Analysis Industry Volume (K Unit), by End User 2025 & 2033
- Figure 9: North America Microarray Analysis Industry Revenue Share (%), by End User 2025 & 2033
- Figure 10: North America Microarray Analysis Industry Volume Share (%), by End User 2025 & 2033
- Figure 11: North America Microarray Analysis Industry Revenue (billion), by Country 2025 & 2033
- Figure 12: North America Microarray Analysis Industry Volume (K Unit), by Country 2025 & 2033
- Figure 13: North America Microarray Analysis Industry Revenue Share (%), by Country 2025 & 2033
- Figure 14: North America Microarray Analysis Industry Volume Share (%), by Country 2025 & 2033
- Figure 15: Europe Microarray Analysis Industry Revenue (billion), by Type 2025 & 2033
- Figure 16: Europe Microarray Analysis Industry Volume (K Unit), by Type 2025 & 2033
- Figure 17: Europe Microarray Analysis Industry Revenue Share (%), by Type 2025 & 2033
- Figure 18: Europe Microarray Analysis Industry Volume Share (%), by Type 2025 & 2033
- Figure 19: Europe Microarray Analysis Industry Revenue (billion), by End User 2025 & 2033
- Figure 20: Europe Microarray Analysis Industry Volume (K Unit), by End User 2025 & 2033
- Figure 21: Europe Microarray Analysis Industry Revenue Share (%), by End User 2025 & 2033
- Figure 22: Europe Microarray Analysis Industry Volume Share (%), by End User 2025 & 2033
- Figure 23: Europe Microarray Analysis Industry Revenue (billion), by Country 2025 & 2033
- Figure 24: Europe Microarray Analysis Industry Volume (K Unit), by Country 2025 & 2033
- Figure 25: Europe Microarray Analysis Industry Revenue Share (%), by Country 2025 & 2033
- Figure 26: Europe Microarray Analysis Industry Volume Share (%), by Country 2025 & 2033
- Figure 27: Asia Pacific Microarray Analysis Industry Revenue (billion), by Type 2025 & 2033
- Figure 28: Asia Pacific Microarray Analysis Industry Volume (K Unit), by Type 2025 & 2033
- Figure 29: Asia Pacific Microarray Analysis Industry Revenue Share (%), by Type 2025 & 2033
- Figure 30: Asia Pacific Microarray Analysis Industry Volume Share (%), by Type 2025 & 2033
- Figure 31: Asia Pacific Microarray Analysis Industry Revenue (billion), by End User 2025 & 2033
- Figure 32: Asia Pacific Microarray Analysis Industry Volume (K Unit), by End User 2025 & 2033
- Figure 33: Asia Pacific Microarray Analysis Industry Revenue Share (%), by End User 2025 & 2033
- Figure 34: Asia Pacific Microarray Analysis Industry Volume Share (%), by End User 2025 & 2033
- Figure 35: Asia Pacific Microarray Analysis Industry Revenue (billion), by Country 2025 & 2033
- Figure 36: Asia Pacific Microarray Analysis Industry Volume (K Unit), by Country 2025 & 2033
- Figure 37: Asia Pacific Microarray Analysis Industry Revenue Share (%), by Country 2025 & 2033
- Figure 38: Asia Pacific Microarray Analysis Industry Volume Share (%), by Country 2025 & 2033
- Figure 39: Middle East Microarray Analysis Industry Revenue (billion), by Type 2025 & 2033
- Figure 40: Middle East Microarray Analysis Industry Volume (K Unit), by Type 2025 & 2033
- Figure 41: Middle East Microarray Analysis Industry Revenue Share (%), by Type 2025 & 2033
- Figure 42: Middle East Microarray Analysis Industry Volume Share (%), by Type 2025 & 2033
- Figure 43: Middle East Microarray Analysis Industry Revenue (billion), by End User 2025 & 2033
- Figure 44: Middle East Microarray Analysis Industry Volume (K Unit), by End User 2025 & 2033
- Figure 45: Middle East Microarray Analysis Industry Revenue Share (%), by End User 2025 & 2033
- Figure 46: Middle East Microarray Analysis Industry Volume Share (%), by End User 2025 & 2033
- Figure 47: Middle East Microarray Analysis Industry Revenue (billion), by Country 2025 & 2033
- Figure 48: Middle East Microarray Analysis Industry Volume (K Unit), by Country 2025 & 2033
- Figure 49: Middle East Microarray Analysis Industry Revenue Share (%), by Country 2025 & 2033
- Figure 50: Middle East Microarray Analysis Industry Volume Share (%), by Country 2025 & 2033
- Figure 51: GCC Microarray Analysis Industry Revenue (billion), by Type 2025 & 2033
- Figure 52: GCC Microarray Analysis Industry Volume (K Unit), by Type 2025 & 2033
- Figure 53: GCC Microarray Analysis Industry Revenue Share (%), by Type 2025 & 2033
- Figure 54: GCC Microarray Analysis Industry Volume Share (%), by Type 2025 & 2033
- Figure 55: GCC Microarray Analysis Industry Revenue (billion), by End User 2025 & 2033
- Figure 56: GCC Microarray Analysis Industry Volume (K Unit), by End User 2025 & 2033
- Figure 57: GCC Microarray Analysis Industry Revenue Share (%), by End User 2025 & 2033
- Figure 58: GCC Microarray Analysis Industry Volume Share (%), by End User 2025 & 2033
- Figure 59: GCC Microarray Analysis Industry Revenue (billion), by Country 2025 & 2033
- Figure 60: GCC Microarray Analysis Industry Volume (K Unit), by Country 2025 & 2033
- Figure 61: GCC Microarray Analysis Industry Revenue Share (%), by Country 2025 & 2033
- Figure 62: GCC Microarray Analysis Industry Volume Share (%), by Country 2025 & 2033
- Figure 63: South America Microarray Analysis Industry Revenue (billion), by Type 2025 & 2033
- Figure 64: South America Microarray Analysis Industry Volume (K Unit), by Type 2025 & 2033
- Figure 65: South America Microarray Analysis Industry Revenue Share (%), by Type 2025 & 2033
- Figure 66: South America Microarray Analysis Industry Volume Share (%), by Type 2025 & 2033
- Figure 67: South America Microarray Analysis Industry Revenue (billion), by End User 2025 & 2033
- Figure 68: South America Microarray Analysis Industry Volume (K Unit), by End User 2025 & 2033
- Figure 69: South America Microarray Analysis Industry Revenue Share (%), by End User 2025 & 2033
- Figure 70: South America Microarray Analysis Industry Volume Share (%), by End User 2025 & 2033
- Figure 71: South America Microarray Analysis Industry Revenue (billion), by Country 2025 & 2033
- Figure 72: South America Microarray Analysis Industry Volume (K Unit), by Country 2025 & 2033
- Figure 73: South America Microarray Analysis Industry Revenue Share (%), by Country 2025 & 2033
- Figure 74: South America Microarray Analysis Industry Volume Share (%), by Country 2025 & 2033
List of Tables
- Table 1: Global Microarray Analysis Industry Revenue billion Forecast, by Type 2020 & 2033
- Table 2: Global Microarray Analysis Industry Volume K Unit Forecast, by Type 2020 & 2033
- Table 3: Global Microarray Analysis Industry Revenue billion Forecast, by End User 2020 & 2033
- Table 4: Global Microarray Analysis Industry Volume K Unit Forecast, by End User 2020 & 2033
- Table 5: Global Microarray Analysis Industry Revenue billion Forecast, by Region 2020 & 2033
- Table 6: Global Microarray Analysis Industry Volume K Unit Forecast, by Region 2020 & 2033
- Table 7: Global Microarray Analysis Industry Revenue billion Forecast, by Type 2020 & 2033
- Table 8: Global Microarray Analysis Industry Volume K Unit Forecast, by Type 2020 & 2033
- Table 9: Global Microarray Analysis Industry Revenue billion Forecast, by End User 2020 & 2033
- Table 10: Global Microarray Analysis Industry Volume K Unit Forecast, by End User 2020 & 2033
- Table 11: Global Microarray Analysis Industry Revenue billion Forecast, by Country 2020 & 2033
- Table 12: Global Microarray Analysis Industry Volume K Unit Forecast, by Country 2020 & 2033
- Table 13: United States Microarray Analysis Industry Revenue (billion) Forecast, by Application 2020 & 2033
- Table 14: United States Microarray Analysis Industry Volume (K Unit) Forecast, by Application 2020 & 2033
- Table 15: Canada Microarray Analysis Industry Revenue (billion) Forecast, by Application 2020 & 2033
- Table 16: Canada Microarray Analysis Industry Volume (K Unit) Forecast, by Application 2020 & 2033
- Table 17: Mexico Microarray Analysis Industry Revenue (billion) Forecast, by Application 2020 & 2033
- Table 18: Mexico Microarray Analysis Industry Volume (K Unit) Forecast, by Application 2020 & 2033
- Table 19: Global Microarray Analysis Industry Revenue billion Forecast, by Type 2020 & 2033
- Table 20: Global Microarray Analysis Industry Volume K Unit Forecast, by Type 2020 & 2033
- Table 21: Global Microarray Analysis Industry Revenue billion Forecast, by End User 2020 & 2033
- Table 22: Global Microarray Analysis Industry Volume K Unit Forecast, by End User 2020 & 2033
- Table 23: Global Microarray Analysis Industry Revenue billion Forecast, by Country 2020 & 2033
- Table 24: Global Microarray Analysis Industry Volume K Unit Forecast, by Country 2020 & 2033
- Table 25: Germany Microarray Analysis Industry Revenue (billion) Forecast, by Application 2020 & 2033
- Table 26: Germany Microarray Analysis Industry Volume (K Unit) Forecast, by Application 2020 & 2033
- Table 27: United Kingdom Microarray Analysis Industry Revenue (billion) Forecast, by Application 2020 & 2033
- Table 28: United Kingdom Microarray Analysis Industry Volume (K Unit) Forecast, by Application 2020 & 2033
- Table 29: France Microarray Analysis Industry Revenue (billion) Forecast, by Application 2020 & 2033
- Table 30: France Microarray Analysis Industry Volume (K Unit) Forecast, by Application 2020 & 2033
- Table 31: Italy Microarray Analysis Industry Revenue (billion) Forecast, by Application 2020 & 2033
- Table 32: Italy Microarray Analysis Industry Volume (K Unit) Forecast, by Application 2020 & 2033
- Table 33: Spain Microarray Analysis Industry Revenue (billion) Forecast, by Application 2020 & 2033
- Table 34: Spain Microarray Analysis Industry Volume (K Unit) Forecast, by Application 2020 & 2033
- Table 35: Rest of Europe Microarray Analysis Industry Revenue (billion) Forecast, by Application 2020 & 2033
- Table 36: Rest of Europe Microarray Analysis Industry Volume (K Unit) Forecast, by Application 2020 & 2033
- Table 37: Global Microarray Analysis Industry Revenue billion Forecast, by Type 2020 & 2033
- Table 38: Global Microarray Analysis Industry Volume K Unit Forecast, by Type 2020 & 2033
- Table 39: Global Microarray Analysis Industry Revenue billion Forecast, by End User 2020 & 2033
- Table 40: Global Microarray Analysis Industry Volume K Unit Forecast, by End User 2020 & 2033
- Table 41: Global Microarray Analysis Industry Revenue billion Forecast, by Country 2020 & 2033
- Table 42: Global Microarray Analysis Industry Volume K Unit Forecast, by Country 2020 & 2033
- Table 43: China Microarray Analysis Industry Revenue (billion) Forecast, by Application 2020 & 2033
- Table 44: China Microarray Analysis Industry Volume (K Unit) Forecast, by Application 2020 & 2033
- Table 45: Japan Microarray Analysis Industry Revenue (billion) Forecast, by Application 2020 & 2033
- Table 46: Japan Microarray Analysis Industry Volume (K Unit) Forecast, by Application 2020 & 2033
- Table 47: India Microarray Analysis Industry Revenue (billion) Forecast, by Application 2020 & 2033
- Table 48: India Microarray Analysis Industry Volume (K Unit) Forecast, by Application 2020 & 2033
- Table 49: Australia Microarray Analysis Industry Revenue (billion) Forecast, by Application 2020 & 2033
- Table 50: Australia Microarray Analysis Industry Volume (K Unit) Forecast, by Application 2020 & 2033
- Table 51: South Korea Microarray Analysis Industry Revenue (billion) Forecast, by Application 2020 & 2033
- Table 52: South Korea Microarray Analysis Industry Volume (K Unit) Forecast, by Application 2020 & 2033
- Table 53: Rest of Asia Pacific Microarray Analysis Industry Revenue (billion) Forecast, by Application 2020 & 2033
- Table 54: Rest of Asia Pacific Microarray Analysis Industry Volume (K Unit) Forecast, by Application 2020 & 2033
- Table 55: Global Microarray Analysis Industry Revenue billion Forecast, by Type 2020 & 2033
- Table 56: Global Microarray Analysis Industry Volume K Unit Forecast, by Type 2020 & 2033
- Table 57: Global Microarray Analysis Industry Revenue billion Forecast, by End User 2020 & 2033
- Table 58: Global Microarray Analysis Industry Volume K Unit Forecast, by End User 2020 & 2033
- Table 59: Global Microarray Analysis Industry Revenue billion Forecast, by Country 2020 & 2033
- Table 60: Global Microarray Analysis Industry Volume K Unit Forecast, by Country 2020 & 2033
- Table 61: Global Microarray Analysis Industry Revenue billion Forecast, by Type 2020 & 2033
- Table 62: Global Microarray Analysis Industry Volume K Unit Forecast, by Type 2020 & 2033
- Table 63: Global Microarray Analysis Industry Revenue billion Forecast, by End User 2020 & 2033
- Table 64: Global Microarray Analysis Industry Volume K Unit Forecast, by End User 2020 & 2033
- Table 65: Global Microarray Analysis Industry Revenue billion Forecast, by Country 2020 & 2033
- Table 66: Global Microarray Analysis Industry Volume K Unit Forecast, by Country 2020 & 2033
- Table 67: South Africa Microarray Analysis Industry Revenue (billion) Forecast, by Application 2020 & 2033
- Table 68: South Africa Microarray Analysis Industry Volume (K Unit) Forecast, by Application 2020 & 2033
- Table 69: Rest of Middle East Microarray Analysis Industry Revenue (billion) Forecast, by Application 2020 & 2033
- Table 70: Rest of Middle East Microarray Analysis Industry Volume (K Unit) Forecast, by Application 2020 & 2033
- Table 71: Global Microarray Analysis Industry Revenue billion Forecast, by Type 2020 & 2033
- Table 72: Global Microarray Analysis Industry Volume K Unit Forecast, by Type 2020 & 2033
- Table 73: Global Microarray Analysis Industry Revenue billion Forecast, by End User 2020 & 2033
- Table 74: Global Microarray Analysis Industry Volume K Unit Forecast, by End User 2020 & 2033
- Table 75: Global Microarray Analysis Industry Revenue billion Forecast, by Country 2020 & 2033
- Table 76: Global Microarray Analysis Industry Volume K Unit Forecast, by Country 2020 & 2033
- Table 77: Brazil Microarray Analysis Industry Revenue (billion) Forecast, by Application 2020 & 2033
- Table 78: Brazil Microarray Analysis Industry Volume (K Unit) Forecast, by Application 2020 & 2033
- Table 79: Argentina Microarray Analysis Industry Revenue (billion) Forecast, by Application 2020 & 2033
- Table 80: Argentina Microarray Analysis Industry Volume (K Unit) Forecast, by Application 2020 & 2033
- Table 81: Rest of South America Microarray Analysis Industry Revenue (billion) Forecast, by Application 2020 & 2033
- Table 82: Rest of South America Microarray Analysis Industry Volume (K Unit) Forecast, by Application 2020 & 2033
Frequently Asked Questions
1. What is the projected Compound Annual Growth Rate (CAGR) of the Microarray Analysis Industry?
The projected CAGR is approximately 5.7%.
2. Which companies are prominent players in the Microarray Analysis Industry?
Key companies in the market include Terra Universal Inc, Creative Biolabs, Merck KGaA, Arrayit Corporation, LC Sciences, Thermo Fischer Scientific (Affymetrix), PEPperPRINT, Bio-Rad Laboratories, JPT Peptide Technologies, Grace Bio-Labs, ProImmune Ltd.
3. What are the main segments of the Microarray Analysis Industry?
The market segments include Type, End User.
4. Can you provide details about the market size?
The market size is estimated to be USD 6.9 billion as of 2022.
5. What are some drivers contributing to market growth?
Growing Burden of Chronic Diseases; Technological Advancements in Diagnostic Testing.
6. What are the notable trends driving market growth?
The Instrument Segment is Expected to Hold a Major Market Share in the Peptide Microarray Market.
7. Are there any restraints impacting market growth?
Reimbursement Issues.
8. Can you provide examples of recent developments in the market?
In June 2022, Ariceum Therapeutics launched with EUR 25M Series A to advance its lead asset, Satoreotide, for the treatment of low- and high-grade neuroendocrine cancers.
9. What pricing options are available for accessing the report?
Pricing options include single-user, multi-user, and enterprise licenses priced at USD 4750, USD 5250, and USD 8750 respectively.
10. Is the market size provided in terms of value or volume?
The market size is provided in terms of value, measured in billion and volume, measured in K Unit.
11. Are there any specific market keywords associated with the report?
Yes, the market keyword associated with the report is "Microarray Analysis Industry," which aids in identifying and referencing the specific market segment covered.
12. How do I determine which pricing option suits my needs best?
The pricing options vary based on user requirements and access needs. Individual users may opt for single-user licenses, while businesses requiring broader access may choose multi-user or enterprise licenses for cost-effective access to the report.
13. Are there any additional resources or data provided in the Microarray Analysis Industry report?
While the report offers comprehensive insights, it's advisable to review the specific contents or supplementary materials provided to ascertain if additional resources or data are available.
14. How can I stay updated on further developments or reports in the Microarray Analysis Industry?
To stay informed about further developments, trends, and reports in the Microarray Analysis Industry, consider subscribing to industry newsletters, following relevant companies and organizations, or regularly checking reputable industry news sources and publications.
Methodology
Step 1 - Identification of Relevant Samples Size from Population Database


Step 2 - Approaches for Defining Global Market Size (Value, Volume* & Price*)

Note*: In applicable scenarios
Step 3 - Data Sources
Primary Research
- Web Analytics
- Survey Reports
- Research Institute
- Latest Research Reports
- Opinion Leaders
Secondary Research
- Annual Reports
- White Paper
- Latest Press Release
- Industry Association
- Paid Database
- Investor Presentations

Step 4 - Data Triangulation
Involves using different sources of information in order to increase the validity of a study
These sources are likely to be stakeholders in a program - participants, other researchers, program staff, other community members, and so on.
Then we put all data in single framework & apply various statistical tools to find out the dynamic on the market.
During the analysis stage, feedback from the stakeholder groups would be compared to determine areas of agreement as well as areas of divergence