

Key Insights
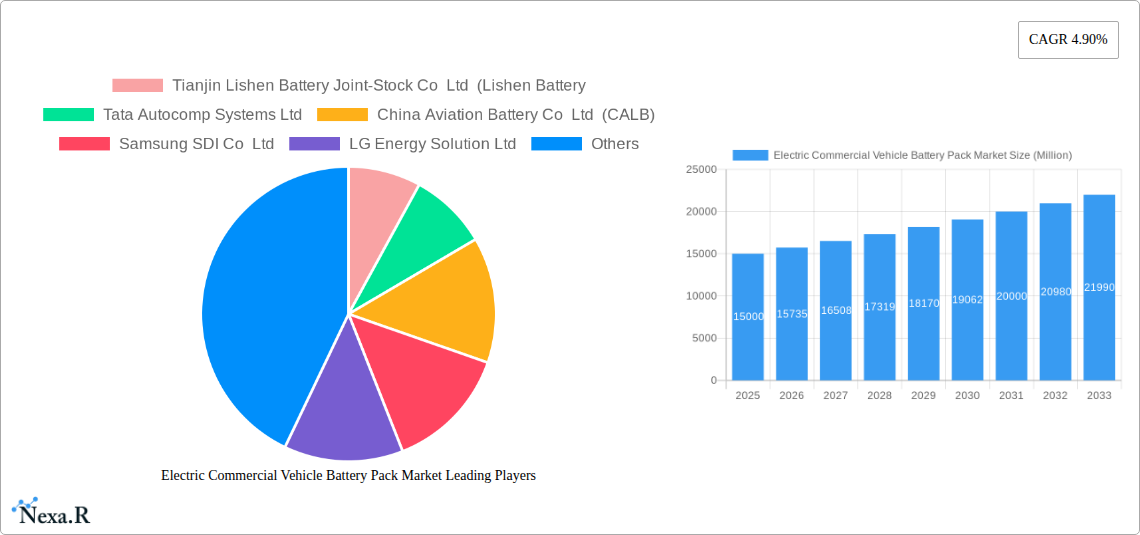
The Electric Commercial Vehicle (ECV) battery pack market is experiencing robust growth, driven by stringent emission regulations, increasing fuel costs, and the rising adoption of sustainable transportation solutions globally. The market's Compound Annual Growth Rate (CAGR) of 4.90% from 2019-2033 indicates a significant expansion, with the market size expected to substantially increase over the forecast period (2025-2033). Key segments driving this growth include Battery Electric Vehicles (BEVs), which are rapidly gaining traction due to their zero-tailpipe emissions, and high-capacity battery packs (above 80 kWh) catering to the needs of long-haul and heavy-duty commercial vehicles. The prevalence of Lithium-ion battery chemistries, particularly NMC and LFP, reflects their superior energy density and cost-effectiveness. Prismatic battery form factors are gaining prominence due to their suitability for large-scale integration in commercial vehicles. Leading players like CATL, LG Energy Solution, and BYD are aggressively investing in R&D and expanding their manufacturing capabilities to meet the surging demand. Market restraints include the high initial investment costs associated with ECV adoption and the need for robust charging infrastructure development, although governmental incentives and technological advancements are progressively mitigating these challenges.
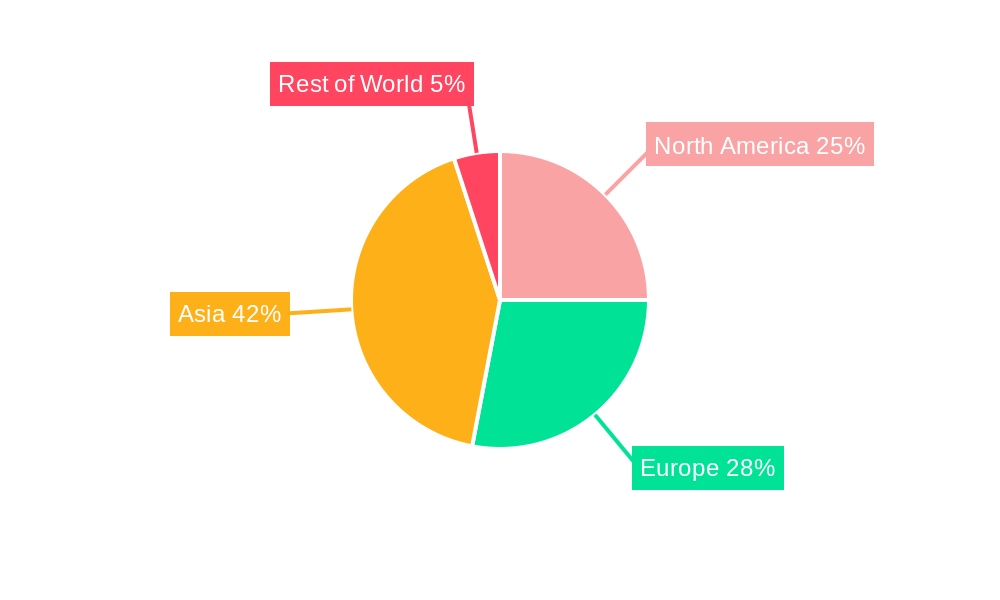
Furthermore, geographical variations in market penetration are expected, with regions like North America and Europe showing strong growth due to supportive government policies and a rapidly evolving charging infrastructure. Asia, particularly China, remains a dominant force, driven by a massive domestic market and aggressive manufacturing capabilities. The market segmentation by propulsion type (BEV, PHEV), battery chemistry (LFP, NCA, NMC), capacity, form factor (cylindrical, pouch, prismatic), manufacturing method (laser, wire), and component (anode, cathode, electrolyte, separator) offers granular insights for targeted market strategies. The ongoing research and development in solid-state batteries and improved battery management systems promise further advancements, leading to enhanced energy density, longer lifespans, and increased safety features, further propelling market growth in the coming years.
Electric Commercial Vehicle Battery Pack Market: A Comprehensive Report (2019-2033)
This comprehensive report provides an in-depth analysis of the Electric Commercial Vehicle (ECV) Battery Pack market, encompassing its parent market (Electric Vehicle Battery Market) and child markets (specific battery chemistries, capacities, and vehicle types). The study period covers 2019-2033, with 2025 as the base and estimated year. The report forecasts market trends from 2025 to 2033, analyzing historical data from 2019-2024. The market is segmented by propulsion type (BEV, PHEV), battery chemistry (LFP, NCA, NCM, NMC, Others), capacity (Less than 15 kWh, 15 kWh to 40 kWh, 40 kWh to 80 kWh, Above 80 kWh), battery form (Cylindrical, Pouch, Prismatic), manufacturing method (Laser, Wire), battery components (Anode, Cathode, Electrolyte, Separator), material type (Cobalt, Lithium, Manganese, Natural Graphite, Nickel, Other Materials), and body type (Bus, LCV, M&HDT). Key players analyzed include Tianjin Lishen Battery Joint-Stock Co Ltd (Lishen Battery), Tata Autocomp Systems Ltd, China Aviation Battery Co Ltd (CALB), Samsung SDI Co Ltd, LG Energy Solution Ltd, A123 Systems LLC, Guoxuan High-tech Co Ltd, Farasis Energy (Ganzhou) Co Ltd, Contemporary Amperex Technology Co Ltd (CATL), BYD Company Ltd, Sunwoda Electric Vehicle Battery Co Ltd (Sunwoda), SK Innovation Co Ltd, EVE Energy Co Ltd, and Panasonic Holdings Corporation. The report is valued at xx Million units.
Electric Commercial Vehicle Battery Pack Market Market Dynamics & Structure
The ECV battery pack market is characterized by moderate concentration, with a few major players holding significant market share. Technological innovation, particularly in battery chemistry and energy density, is a key driver, alongside stringent government regulations promoting ECV adoption. The market faces competition from alternative powertrains, such as fuel cells, and the evolving end-user demographics (fleet operators, logistics companies) influence demand. M&A activity is notable, with xx deals recorded in the past five years, indicating consolidation and strategic expansion.
- Market Concentration: CATL and BYD hold approximately xx% of the global market share combined. Other significant players represent xx%.
- Technological Innovation: Focus on improving energy density, lifespan, and fast-charging capabilities drives innovation. Challenges include cost reduction and raw material sourcing.
- Regulatory Framework: Government incentives (tax credits, subsidies) and emission regulations are major catalysts for ECV adoption.
- Competitive Product Substitutes: Fuel cell technology and alternative energy sources pose a competitive threat.
- End-User Demographics: The shift towards sustainable logistics is fueling demand, with large fleet operators driving substantial volume growth.
- M&A Trends: Consolidation amongst battery manufacturers and collaborations between battery makers and vehicle manufacturers are prominent trends.
Electric Commercial Vehicle Battery Pack Market Growth Trends & Insights
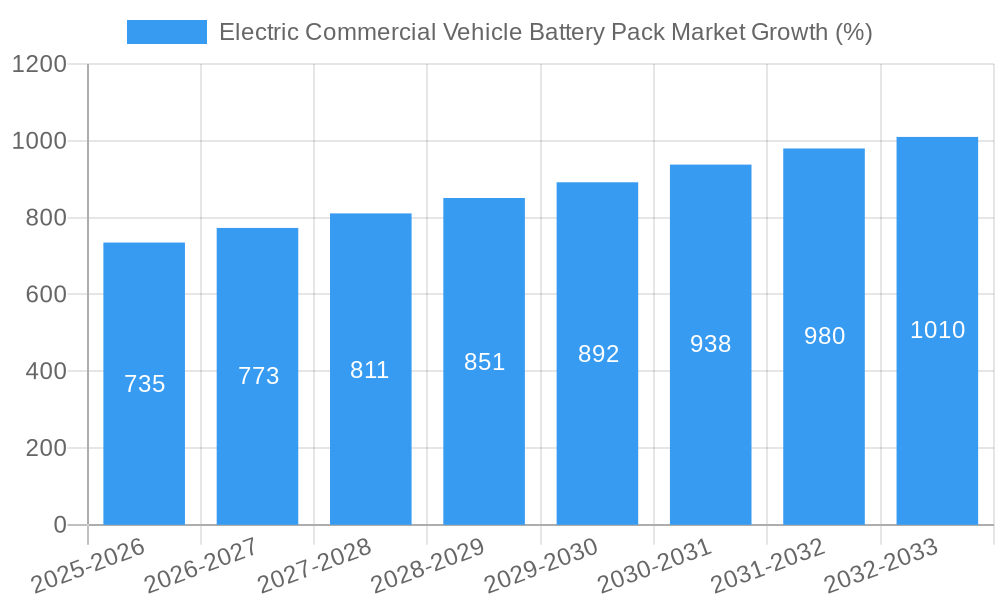
The ECV battery pack market is experiencing robust growth, driven by increasing demand for sustainable transportation and supportive government policies. The market size is projected to reach xx Million units by 2033, registering a CAGR of xx% during the forecast period (2025-2033). This growth is fueled by the rising adoption of electric buses and light commercial vehicles in urban areas and the increasing penetration of EVs in the logistics sector. Technological advancements, including improvements in battery chemistry and energy density, are further driving adoption. Consumer behavior is shifting towards eco-friendly transportation options, creating a significant demand for electric commercial vehicles and their associated battery packs. The market penetration rate of ECVs is anticipated to reach xx% by 2033.
Dominant Regions, Countries, or Segments in Electric Commercial Vehicle Battery Pack Market
China dominates the ECV battery pack market, owing to its massive electric vehicle production and supportive government policies. Europe and North America follow, experiencing significant growth driven by stringent emission regulations and increased consumer awareness. Within segments, BEV propulsion systems represent a larger market share compared to PHEV, while LFP battery chemistry is cost-effective, holding a dominant position. High-capacity batteries (above 80 kWh) are preferred for long-haul applications, while prismatic battery form is dominant due to its scalability and cost-effectiveness. Buses and M&HDTs (Medium and Heavy-Duty Trucks) represent the largest share of the body type segment.
- Key Drivers: Favorable government policies in China and Europe, expanding charging infrastructure, and declining battery costs.
- Dominance Factors: High ECV adoption rate in China and other emerging economies, established manufacturing base, and access to raw materials.
Electric Commercial Vehicle Battery Pack Market Product Landscape
The ECV battery pack market offers a diverse range of products tailored to specific vehicle types and operational requirements. Innovations focus on improving energy density, reducing weight, and enhancing safety features. Advanced battery management systems (BMS) optimize battery performance and lifespan. Key product features include thermal management, fast-charging capabilities, and modular designs for flexible integration. Unique selling propositions include extended warranties, robust safety features, and optimized lifecycle performance.
Key Drivers, Barriers & Challenges in Electric Commercial Vehicle Battery Pack Market
Key Drivers: Stringent emission regulations globally are driving the adoption of electric commercial vehicles, leading to higher demand for battery packs. Government incentives, such as subsidies and tax breaks, are further accelerating market growth. Technological advancements in battery chemistry, improving energy density and reducing costs, are also significant drivers.
Key Challenges: High initial investment costs for ECVs and battery packs remain a significant barrier for adoption, particularly in developing economies. The limited charging infrastructure in many regions hinders widespread adoption. Supply chain disruptions, particularly concerning raw materials like lithium and cobalt, pose challenges to production and cost stability.
Emerging Opportunities in Electric Commercial Vehicle Battery Pack Market
Untapped markets in developing economies present significant growth opportunities, particularly in regions with rapidly expanding urban transportation and logistics sectors. Innovative applications, such as in off-highway commercial vehicles and specialized industrial equipment, offer further market expansion. Evolving consumer preferences towards sustainable transportation solutions and increased awareness of environmental concerns are driving demand.
Growth Accelerators in the Electric Commercial Vehicle Battery Pack Market Industry
Technological breakthroughs in solid-state batteries and advancements in battery management systems are expected to propel long-term growth. Strategic partnerships between battery manufacturers and vehicle manufacturers are streamlining supply chains and facilitating product innovation. Market expansion into developing economies and diversification into new applications will further drive market growth.
Key Players Shaping the Electric Commercial Vehicle Battery Pack Market Market
- Tianjin Lishen Battery Joint-Stock Co Ltd (Lishen Battery)
- Tata Autocomp Systems Ltd
- China Aviation Battery Co Ltd (CALB)
- Samsung SDI Co Ltd
- LG Energy Solution Ltd
- A123 Systems LLC
- Guoxuan High-tech Co Ltd
- Farasis Energy (Ganzhou) Co Ltd
- Contemporary Amperex Technology Co Ltd (CATL)
- BYD Company Ltd
- Sunwoda Electric Vehicle Battery Co Ltd (Sunwoda)
- SK Innovation Co Ltd
- EVE Energy Co Ltd
- Panasonic Holdings Corporation
Notable Milestones in Electric Commercial Vehicle Battery Pack Market Sector
- February 2023: LG Energy Solution announced a 50% increase in investment to 10 trillion won, expanding its global production capacity to 300 GWh. This signifies a major commitment to meeting growing demand.
- February 2023: LG Energy Solution launched the world's first battery passport, promoting transparency and sustainability in the battery value chain. This move enhances consumer trust and improves environmental impact.
- February 2023: LG Energy Solution and Freudenberg e-Power Systems signed a multi-year contract for 19 GWh of lithium-ion battery cell modules, highlighting strategic partnerships and increased production capacity.
In-Depth Electric Commercial Vehicle Battery Pack Market Market Outlook
The future of the ECV battery pack market looks promising, fueled by continuous technological advancements, supportive government policies, and increasing environmental awareness. Strategic partnerships and expansion into new markets will further accelerate growth. The focus on enhancing battery performance, reducing costs, and addressing supply chain challenges will shape future market dynamics. Opportunities abound for companies that can innovate, adapt, and meet the growing demand for sustainable transportation solutions.
Electric Commercial Vehicle Battery Pack Market Segmentation
-
1. Body Type
- 1.1. Bus
- 1.2. LCV
- 1.3. M&HDT
-
2. Propulsion Type
- 2.1. BEV
- 2.2. PHEV
-
3. Battery Chemistry
- 3.1. LFP
- 3.2. NCA
- 3.3. NCM
- 3.4. NMC
- 3.5. Others
-
4. Capacity
- 4.1. 15 kWh to 40 kWh
- 4.2. 40 kWh to 80 kWh
- 4.3. Above 80 kWh
- 4.4. Less than 15 kWh
-
5. Battery Form
- 5.1. Cylindrical
- 5.2. Pouch
- 5.3. Prismatic
-
6. Method
- 6.1. Laser
- 6.2. Wire
-
7. Component
- 7.1. Anode
- 7.2. Cathode
- 7.3. Electrolyte
- 7.4. Separator
-
8. Material Type
- 8.1. Cobalt
- 8.2. Lithium
- 8.3. Manganese
- 8.4. Natural Graphite
- 8.5. Nickel
- 8.6. Other Materials
Electric Commercial Vehicle Battery Pack Market Segmentation By Geography
-
1. North America
- 1.1. United States
- 1.2. Canada
- 1.3. Mexico
-
2. South America
- 2.1. Brazil
- 2.2. Argentina
- 2.3. Rest of South America
-
3. Europe
- 3.1. United Kingdom
- 3.2. Germany
- 3.3. France
- 3.4. Italy
- 3.5. Spain
- 3.6. Russia
- 3.7. Benelux
- 3.8. Nordics
- 3.9. Rest of Europe
-
4. Middle East & Africa
- 4.1. Turkey
- 4.2. Israel
- 4.3. GCC
- 4.4. North Africa
- 4.5. South Africa
- 4.6. Rest of Middle East & Africa
-
5. Asia Pacific
- 5.1. China
- 5.2. India
- 5.3. Japan
- 5.4. South Korea
- 5.5. ASEAN
- 5.6. Oceania
- 5.7. Rest of Asia Pacific
Electric Commercial Vehicle Battery Pack Market REPORT HIGHLIGHTS
| Aspects | Details |
|---|---|
| Study Period | 2019-2033 |
| Base Year | 2024 |
| Estimated Year | 2025 |
| Forecast Period | 2025-2033 |
| Historical Period | 2019-2024 |
| Growth Rate | CAGR of 4.90% from 2019-2033 |
| Segmentation |
|
Table of Contents
- 1. Introduction
- 1.1. Research Scope
- 1.2. Market Segmentation
- 1.3. Research Methodology
- 1.4. Definitions and Assumptions
- 2. Executive Summary
- 2.1. Introduction
- 3. Market Dynamics
- 3.1. Introduction
- 3.2. Market Drivers
- 3.2.1. The Rise of Trade Agreements Between Nations; Increasing Volume of International Trade
- 3.3. Market Restrains
- 3.3.1. Surge in Fuel Costs Affecting the Market
- 3.4. Market Trends
- 3.4.1. OTHER KEY INDUSTRY TRENDS COVERED IN THE REPORT
- 4. Market Factor Analysis
- 4.1. Porters Five Forces
- 4.2. Supply/Value Chain
- 4.3. PESTEL analysis
- 4.4. Market Entropy
- 4.5. Patent/Trademark Analysis
- 5. Global Electric Commercial Vehicle Battery Pack Market Analysis, Insights and Forecast, 2019-2031
- 5.1. Market Analysis, Insights and Forecast - by Body Type
- 5.1.1. Bus
- 5.1.2. LCV
- 5.1.3. M&HDT
- 5.2. Market Analysis, Insights and Forecast - by Propulsion Type
- 5.2.1. BEV
- 5.2.2. PHEV
- 5.3. Market Analysis, Insights and Forecast - by Battery Chemistry
- 5.3.1. LFP
- 5.3.2. NCA
- 5.3.3. NCM
- 5.3.4. NMC
- 5.3.5. Others
- 5.4. Market Analysis, Insights and Forecast - by Capacity
- 5.4.1. 15 kWh to 40 kWh
- 5.4.2. 40 kWh to 80 kWh
- 5.4.3. Above 80 kWh
- 5.4.4. Less than 15 kWh
- 5.5. Market Analysis, Insights and Forecast - by Battery Form
- 5.5.1. Cylindrical
- 5.5.2. Pouch
- 5.5.3. Prismatic
- 5.6. Market Analysis, Insights and Forecast - by Method
- 5.6.1. Laser
- 5.6.2. Wire
- 5.7. Market Analysis, Insights and Forecast - by Component
- 5.7.1. Anode
- 5.7.2. Cathode
- 5.7.3. Electrolyte
- 5.7.4. Separator
- 5.8. Market Analysis, Insights and Forecast - by Material Type
- 5.8.1. Cobalt
- 5.8.2. Lithium
- 5.8.3. Manganese
- 5.8.4. Natural Graphite
- 5.8.5. Nickel
- 5.8.6. Other Materials
- 5.9. Market Analysis, Insights and Forecast - by Region
- 5.9.1. North America
- 5.9.2. South America
- 5.9.3. Europe
- 5.9.4. Middle East & Africa
- 5.9.5. Asia Pacific
- 5.1. Market Analysis, Insights and Forecast - by Body Type
- 6. North America Electric Commercial Vehicle Battery Pack Market Analysis, Insights and Forecast, 2019-2031
- 6.1. Market Analysis, Insights and Forecast - by Body Type
- 6.1.1. Bus
- 6.1.2. LCV
- 6.1.3. M&HDT
- 6.2. Market Analysis, Insights and Forecast - by Propulsion Type
- 6.2.1. BEV
- 6.2.2. PHEV
- 6.3. Market Analysis, Insights and Forecast - by Battery Chemistry
- 6.3.1. LFP
- 6.3.2. NCA
- 6.3.3. NCM
- 6.3.4. NMC
- 6.3.5. Others
- 6.4. Market Analysis, Insights and Forecast - by Capacity
- 6.4.1. 15 kWh to 40 kWh
- 6.4.2. 40 kWh to 80 kWh
- 6.4.3. Above 80 kWh
- 6.4.4. Less than 15 kWh
- 6.5. Market Analysis, Insights and Forecast - by Battery Form
- 6.5.1. Cylindrical
- 6.5.2. Pouch
- 6.5.3. Prismatic
- 6.6. Market Analysis, Insights and Forecast - by Method
- 6.6.1. Laser
- 6.6.2. Wire
- 6.7. Market Analysis, Insights and Forecast - by Component
- 6.7.1. Anode
- 6.7.2. Cathode
- 6.7.3. Electrolyte
- 6.7.4. Separator
- 6.8. Market Analysis, Insights and Forecast - by Material Type
- 6.8.1. Cobalt
- 6.8.2. Lithium
- 6.8.3. Manganese
- 6.8.4. Natural Graphite
- 6.8.5. Nickel
- 6.8.6. Other Materials
- 6.1. Market Analysis, Insights and Forecast - by Body Type
- 7. South America Electric Commercial Vehicle Battery Pack Market Analysis, Insights and Forecast, 2019-2031
- 7.1. Market Analysis, Insights and Forecast - by Body Type
- 7.1.1. Bus
- 7.1.2. LCV
- 7.1.3. M&HDT
- 7.2. Market Analysis, Insights and Forecast - by Propulsion Type
- 7.2.1. BEV
- 7.2.2. PHEV
- 7.3. Market Analysis, Insights and Forecast - by Battery Chemistry
- 7.3.1. LFP
- 7.3.2. NCA
- 7.3.3. NCM
- 7.3.4. NMC
- 7.3.5. Others
- 7.4. Market Analysis, Insights and Forecast - by Capacity
- 7.4.1. 15 kWh to 40 kWh
- 7.4.2. 40 kWh to 80 kWh
- 7.4.3. Above 80 kWh
- 7.4.4. Less than 15 kWh
- 7.5. Market Analysis, Insights and Forecast - by Battery Form
- 7.5.1. Cylindrical
- 7.5.2. Pouch
- 7.5.3. Prismatic
- 7.6. Market Analysis, Insights and Forecast - by Method
- 7.6.1. Laser
- 7.6.2. Wire
- 7.7. Market Analysis, Insights and Forecast - by Component
- 7.7.1. Anode
- 7.7.2. Cathode
- 7.7.3. Electrolyte
- 7.7.4. Separator
- 7.8. Market Analysis, Insights and Forecast - by Material Type
- 7.8.1. Cobalt
- 7.8.2. Lithium
- 7.8.3. Manganese
- 7.8.4. Natural Graphite
- 7.8.5. Nickel
- 7.8.6. Other Materials
- 7.1. Market Analysis, Insights and Forecast - by Body Type
- 8. Europe Electric Commercial Vehicle Battery Pack Market Analysis, Insights and Forecast, 2019-2031
- 8.1. Market Analysis, Insights and Forecast - by Body Type
- 8.1.1. Bus
- 8.1.2. LCV
- 8.1.3. M&HDT
- 8.2. Market Analysis, Insights and Forecast - by Propulsion Type
- 8.2.1. BEV
- 8.2.2. PHEV
- 8.3. Market Analysis, Insights and Forecast - by Battery Chemistry
- 8.3.1. LFP
- 8.3.2. NCA
- 8.3.3. NCM
- 8.3.4. NMC
- 8.3.5. Others
- 8.4. Market Analysis, Insights and Forecast - by Capacity
- 8.4.1. 15 kWh to 40 kWh
- 8.4.2. 40 kWh to 80 kWh
- 8.4.3. Above 80 kWh
- 8.4.4. Less than 15 kWh
- 8.5. Market Analysis, Insights and Forecast - by Battery Form
- 8.5.1. Cylindrical
- 8.5.2. Pouch
- 8.5.3. Prismatic
- 8.6. Market Analysis, Insights and Forecast - by Method
- 8.6.1. Laser
- 8.6.2. Wire
- 8.7. Market Analysis, Insights and Forecast - by Component
- 8.7.1. Anode
- 8.7.2. Cathode
- 8.7.3. Electrolyte
- 8.7.4. Separator
- 8.8. Market Analysis, Insights and Forecast - by Material Type
- 8.8.1. Cobalt
- 8.8.2. Lithium
- 8.8.3. Manganese
- 8.8.4. Natural Graphite
- 8.8.5. Nickel
- 8.8.6. Other Materials
- 8.1. Market Analysis, Insights and Forecast - by Body Type
- 9. Middle East & Africa Electric Commercial Vehicle Battery Pack Market Analysis, Insights and Forecast, 2019-2031
- 9.1. Market Analysis, Insights and Forecast - by Body Type
- 9.1.1. Bus
- 9.1.2. LCV
- 9.1.3. M&HDT
- 9.2. Market Analysis, Insights and Forecast - by Propulsion Type
- 9.2.1. BEV
- 9.2.2. PHEV
- 9.3. Market Analysis, Insights and Forecast - by Battery Chemistry
- 9.3.1. LFP
- 9.3.2. NCA
- 9.3.3. NCM
- 9.3.4. NMC
- 9.3.5. Others
- 9.4. Market Analysis, Insights and Forecast - by Capacity
- 9.4.1. 15 kWh to 40 kWh
- 9.4.2. 40 kWh to 80 kWh
- 9.4.3. Above 80 kWh
- 9.4.4. Less than 15 kWh
- 9.5. Market Analysis, Insights and Forecast - by Battery Form
- 9.5.1. Cylindrical
- 9.5.2. Pouch
- 9.5.3. Prismatic
- 9.6. Market Analysis, Insights and Forecast - by Method
- 9.6.1. Laser
- 9.6.2. Wire
- 9.7. Market Analysis, Insights and Forecast - by Component
- 9.7.1. Anode
- 9.7.2. Cathode
- 9.7.3. Electrolyte
- 9.7.4. Separator
- 9.8. Market Analysis, Insights and Forecast - by Material Type
- 9.8.1. Cobalt
- 9.8.2. Lithium
- 9.8.3. Manganese
- 9.8.4. Natural Graphite
- 9.8.5. Nickel
- 9.8.6. Other Materials
- 9.1. Market Analysis, Insights and Forecast - by Body Type
- 10. Asia Pacific Electric Commercial Vehicle Battery Pack Market Analysis, Insights and Forecast, 2019-2031
- 10.1. Market Analysis, Insights and Forecast - by Body Type
- 10.1.1. Bus
- 10.1.2. LCV
- 10.1.3. M&HDT
- 10.2. Market Analysis, Insights and Forecast - by Propulsion Type
- 10.2.1. BEV
- 10.2.2. PHEV
- 10.3. Market Analysis, Insights and Forecast - by Battery Chemistry
- 10.3.1. LFP
- 10.3.2. NCA
- 10.3.3. NCM
- 10.3.4. NMC
- 10.3.5. Others
- 10.4. Market Analysis, Insights and Forecast - by Capacity
- 10.4.1. 15 kWh to 40 kWh
- 10.4.2. 40 kWh to 80 kWh
- 10.4.3. Above 80 kWh
- 10.4.4. Less than 15 kWh
- 10.5. Market Analysis, Insights and Forecast - by Battery Form
- 10.5.1. Cylindrical
- 10.5.2. Pouch
- 10.5.3. Prismatic
- 10.6. Market Analysis, Insights and Forecast - by Method
- 10.6.1. Laser
- 10.6.2. Wire
- 10.7. Market Analysis, Insights and Forecast - by Component
- 10.7.1. Anode
- 10.7.2. Cathode
- 10.7.3. Electrolyte
- 10.7.4. Separator
- 10.8. Market Analysis, Insights and Forecast - by Material Type
- 10.8.1. Cobalt
- 10.8.2. Lithium
- 10.8.3. Manganese
- 10.8.4. Natural Graphite
- 10.8.5. Nickel
- 10.8.6. Other Materials
- 10.1. Market Analysis, Insights and Forecast - by Body Type
- 11. Competitive Analysis
- 11.1. Global Market Share Analysis 2024
- 11.2. Company Profiles
- 11.2.1 Tianjin Lishen Battery Joint-Stock Co Ltd (Lishen Battery
- 11.2.1.1. Overview
- 11.2.1.2. Products
- 11.2.1.3. SWOT Analysis
- 11.2.1.4. Recent Developments
- 11.2.1.5. Financials (Based on Availability)
- 11.2.2 Tata Autocomp Systems Ltd
- 11.2.2.1. Overview
- 11.2.2.2. Products
- 11.2.2.3. SWOT Analysis
- 11.2.2.4. Recent Developments
- 11.2.2.5. Financials (Based on Availability)
- 11.2.3 China Aviation Battery Co Ltd (CALB)
- 11.2.3.1. Overview
- 11.2.3.2. Products
- 11.2.3.3. SWOT Analysis
- 11.2.3.4. Recent Developments
- 11.2.3.5. Financials (Based on Availability)
- 11.2.4 Samsung SDI Co Ltd
- 11.2.4.1. Overview
- 11.2.4.2. Products
- 11.2.4.3. SWOT Analysis
- 11.2.4.4. Recent Developments
- 11.2.4.5. Financials (Based on Availability)
- 11.2.5 LG Energy Solution Ltd
- 11.2.5.1. Overview
- 11.2.5.2. Products
- 11.2.5.3. SWOT Analysis
- 11.2.5.4. Recent Developments
- 11.2.5.5. Financials (Based on Availability)
- 11.2.6 A123 Systems LLC
- 11.2.6.1. Overview
- 11.2.6.2. Products
- 11.2.6.3. SWOT Analysis
- 11.2.6.4. Recent Developments
- 11.2.6.5. Financials (Based on Availability)
- 11.2.7 Guoxuan High-tech Co Ltd
- 11.2.7.1. Overview
- 11.2.7.2. Products
- 11.2.7.3. SWOT Analysis
- 11.2.7.4. Recent Developments
- 11.2.7.5. Financials (Based on Availability)
- 11.2.8 Farasis Energy (Ganzhou) Co Ltd
- 11.2.8.1. Overview
- 11.2.8.2. Products
- 11.2.8.3. SWOT Analysis
- 11.2.8.4. Recent Developments
- 11.2.8.5. Financials (Based on Availability)
- 11.2.9 Contemporary Amperex Technology Co Ltd (CATL)
- 11.2.9.1. Overview
- 11.2.9.2. Products
- 11.2.9.3. SWOT Analysis
- 11.2.9.4. Recent Developments
- 11.2.9.5. Financials (Based on Availability)
- 11.2.10 BYD Company Ltd
- 11.2.10.1. Overview
- 11.2.10.2. Products
- 11.2.10.3. SWOT Analysis
- 11.2.10.4. Recent Developments
- 11.2.10.5. Financials (Based on Availability)
- 11.2.11 Sunwoda Electric Vehicle Battery Co Ltd (Sunwoda)
- 11.2.11.1. Overview
- 11.2.11.2. Products
- 11.2.11.3. SWOT Analysis
- 11.2.11.4. Recent Developments
- 11.2.11.5. Financials (Based on Availability)
- 11.2.12 SK Innovation Co Ltd
- 11.2.12.1. Overview
- 11.2.12.2. Products
- 11.2.12.3. SWOT Analysis
- 11.2.12.4. Recent Developments
- 11.2.12.5. Financials (Based on Availability)
- 11.2.13 EVE Energy Co Ltd
- 11.2.13.1. Overview
- 11.2.13.2. Products
- 11.2.13.3. SWOT Analysis
- 11.2.13.4. Recent Developments
- 11.2.13.5. Financials (Based on Availability)
- 11.2.14 Panasonic Holdings Corporation
- 11.2.14.1. Overview
- 11.2.14.2. Products
- 11.2.14.3. SWOT Analysis
- 11.2.14.4. Recent Developments
- 11.2.14.5. Financials (Based on Availability)
- 11.2.1 Tianjin Lishen Battery Joint-Stock Co Ltd (Lishen Battery
List of Figures
- Figure 1: Global Electric Commercial Vehicle Battery Pack Market Revenue Breakdown (Million, %) by Region 2024 & 2032
- Figure 2: North America Electric Commercial Vehicle Battery Pack Market Revenue (Million), by Body Type 2024 & 2032
- Figure 3: North America Electric Commercial Vehicle Battery Pack Market Revenue Share (%), by Body Type 2024 & 2032
- Figure 4: North America Electric Commercial Vehicle Battery Pack Market Revenue (Million), by Propulsion Type 2024 & 2032
- Figure 5: North America Electric Commercial Vehicle Battery Pack Market Revenue Share (%), by Propulsion Type 2024 & 2032
- Figure 6: North America Electric Commercial Vehicle Battery Pack Market Revenue (Million), by Battery Chemistry 2024 & 2032
- Figure 7: North America Electric Commercial Vehicle Battery Pack Market Revenue Share (%), by Battery Chemistry 2024 & 2032
- Figure 8: North America Electric Commercial Vehicle Battery Pack Market Revenue (Million), by Capacity 2024 & 2032
- Figure 9: North America Electric Commercial Vehicle Battery Pack Market Revenue Share (%), by Capacity 2024 & 2032
- Figure 10: North America Electric Commercial Vehicle Battery Pack Market Revenue (Million), by Battery Form 2024 & 2032
- Figure 11: North America Electric Commercial Vehicle Battery Pack Market Revenue Share (%), by Battery Form 2024 & 2032
- Figure 12: North America Electric Commercial Vehicle Battery Pack Market Revenue (Million), by Method 2024 & 2032
- Figure 13: North America Electric Commercial Vehicle Battery Pack Market Revenue Share (%), by Method 2024 & 2032
- Figure 14: North America Electric Commercial Vehicle Battery Pack Market Revenue (Million), by Component 2024 & 2032
- Figure 15: North America Electric Commercial Vehicle Battery Pack Market Revenue Share (%), by Component 2024 & 2032
- Figure 16: North America Electric Commercial Vehicle Battery Pack Market Revenue (Million), by Material Type 2024 & 2032
- Figure 17: North America Electric Commercial Vehicle Battery Pack Market Revenue Share (%), by Material Type 2024 & 2032
- Figure 18: North America Electric Commercial Vehicle Battery Pack Market Revenue (Million), by Country 2024 & 2032
- Figure 19: North America Electric Commercial Vehicle Battery Pack Market Revenue Share (%), by Country 2024 & 2032
- Figure 20: South America Electric Commercial Vehicle Battery Pack Market Revenue (Million), by Body Type 2024 & 2032
- Figure 21: South America Electric Commercial Vehicle Battery Pack Market Revenue Share (%), by Body Type 2024 & 2032
- Figure 22: South America Electric Commercial Vehicle Battery Pack Market Revenue (Million), by Propulsion Type 2024 & 2032
- Figure 23: South America Electric Commercial Vehicle Battery Pack Market Revenue Share (%), by Propulsion Type 2024 & 2032
- Figure 24: South America Electric Commercial Vehicle Battery Pack Market Revenue (Million), by Battery Chemistry 2024 & 2032
- Figure 25: South America Electric Commercial Vehicle Battery Pack Market Revenue Share (%), by Battery Chemistry 2024 & 2032
- Figure 26: South America Electric Commercial Vehicle Battery Pack Market Revenue (Million), by Capacity 2024 & 2032
- Figure 27: South America Electric Commercial Vehicle Battery Pack Market Revenue Share (%), by Capacity 2024 & 2032
- Figure 28: South America Electric Commercial Vehicle Battery Pack Market Revenue (Million), by Battery Form 2024 & 2032
- Figure 29: South America Electric Commercial Vehicle Battery Pack Market Revenue Share (%), by Battery Form 2024 & 2032
- Figure 30: South America Electric Commercial Vehicle Battery Pack Market Revenue (Million), by Method 2024 & 2032
- Figure 31: South America Electric Commercial Vehicle Battery Pack Market Revenue Share (%), by Method 2024 & 2032
- Figure 32: South America Electric Commercial Vehicle Battery Pack Market Revenue (Million), by Component 2024 & 2032
- Figure 33: South America Electric Commercial Vehicle Battery Pack Market Revenue Share (%), by Component 2024 & 2032
- Figure 34: South America Electric Commercial Vehicle Battery Pack Market Revenue (Million), by Material Type 2024 & 2032
- Figure 35: South America Electric Commercial Vehicle Battery Pack Market Revenue Share (%), by Material Type 2024 & 2032
- Figure 36: South America Electric Commercial Vehicle Battery Pack Market Revenue (Million), by Country 2024 & 2032
- Figure 37: South America Electric Commercial Vehicle Battery Pack Market Revenue Share (%), by Country 2024 & 2032
- Figure 38: Europe Electric Commercial Vehicle Battery Pack Market Revenue (Million), by Body Type 2024 & 2032
- Figure 39: Europe Electric Commercial Vehicle Battery Pack Market Revenue Share (%), by Body Type 2024 & 2032
- Figure 40: Europe Electric Commercial Vehicle Battery Pack Market Revenue (Million), by Propulsion Type 2024 & 2032
- Figure 41: Europe Electric Commercial Vehicle Battery Pack Market Revenue Share (%), by Propulsion Type 2024 & 2032
- Figure 42: Europe Electric Commercial Vehicle Battery Pack Market Revenue (Million), by Battery Chemistry 2024 & 2032
- Figure 43: Europe Electric Commercial Vehicle Battery Pack Market Revenue Share (%), by Battery Chemistry 2024 & 2032
- Figure 44: Europe Electric Commercial Vehicle Battery Pack Market Revenue (Million), by Capacity 2024 & 2032
- Figure 45: Europe Electric Commercial Vehicle Battery Pack Market Revenue Share (%), by Capacity 2024 & 2032
- Figure 46: Europe Electric Commercial Vehicle Battery Pack Market Revenue (Million), by Battery Form 2024 & 2032
- Figure 47: Europe Electric Commercial Vehicle Battery Pack Market Revenue Share (%), by Battery Form 2024 & 2032
- Figure 48: Europe Electric Commercial Vehicle Battery Pack Market Revenue (Million), by Method 2024 & 2032
- Figure 49: Europe Electric Commercial Vehicle Battery Pack Market Revenue Share (%), by Method 2024 & 2032
- Figure 50: Europe Electric Commercial Vehicle Battery Pack Market Revenue (Million), by Component 2024 & 2032
- Figure 51: Europe Electric Commercial Vehicle Battery Pack Market Revenue Share (%), by Component 2024 & 2032
- Figure 52: Europe Electric Commercial Vehicle Battery Pack Market Revenue (Million), by Material Type 2024 & 2032
- Figure 53: Europe Electric Commercial Vehicle Battery Pack Market Revenue Share (%), by Material Type 2024 & 2032
- Figure 54: Europe Electric Commercial Vehicle Battery Pack Market Revenue (Million), by Country 2024 & 2032
- Figure 55: Europe Electric Commercial Vehicle Battery Pack Market Revenue Share (%), by Country 2024 & 2032
- Figure 56: Middle East & Africa Electric Commercial Vehicle Battery Pack Market Revenue (Million), by Body Type 2024 & 2032
- Figure 57: Middle East & Africa Electric Commercial Vehicle Battery Pack Market Revenue Share (%), by Body Type 2024 & 2032
- Figure 58: Middle East & Africa Electric Commercial Vehicle Battery Pack Market Revenue (Million), by Propulsion Type 2024 & 2032
- Figure 59: Middle East & Africa Electric Commercial Vehicle Battery Pack Market Revenue Share (%), by Propulsion Type 2024 & 2032
- Figure 60: Middle East & Africa Electric Commercial Vehicle Battery Pack Market Revenue (Million), by Battery Chemistry 2024 & 2032
- Figure 61: Middle East & Africa Electric Commercial Vehicle Battery Pack Market Revenue Share (%), by Battery Chemistry 2024 & 2032
- Figure 62: Middle East & Africa Electric Commercial Vehicle Battery Pack Market Revenue (Million), by Capacity 2024 & 2032
- Figure 63: Middle East & Africa Electric Commercial Vehicle Battery Pack Market Revenue Share (%), by Capacity 2024 & 2032
- Figure 64: Middle East & Africa Electric Commercial Vehicle Battery Pack Market Revenue (Million), by Battery Form 2024 & 2032
- Figure 65: Middle East & Africa Electric Commercial Vehicle Battery Pack Market Revenue Share (%), by Battery Form 2024 & 2032
- Figure 66: Middle East & Africa Electric Commercial Vehicle Battery Pack Market Revenue (Million), by Method 2024 & 2032
- Figure 67: Middle East & Africa Electric Commercial Vehicle Battery Pack Market Revenue Share (%), by Method 2024 & 2032
- Figure 68: Middle East & Africa Electric Commercial Vehicle Battery Pack Market Revenue (Million), by Component 2024 & 2032
- Figure 69: Middle East & Africa Electric Commercial Vehicle Battery Pack Market Revenue Share (%), by Component 2024 & 2032
- Figure 70: Middle East & Africa Electric Commercial Vehicle Battery Pack Market Revenue (Million), by Material Type 2024 & 2032
- Figure 71: Middle East & Africa Electric Commercial Vehicle Battery Pack Market Revenue Share (%), by Material Type 2024 & 2032
- Figure 72: Middle East & Africa Electric Commercial Vehicle Battery Pack Market Revenue (Million), by Country 2024 & 2032
- Figure 73: Middle East & Africa Electric Commercial Vehicle Battery Pack Market Revenue Share (%), by Country 2024 & 2032
- Figure 74: Asia Pacific Electric Commercial Vehicle Battery Pack Market Revenue (Million), by Body Type 2024 & 2032
- Figure 75: Asia Pacific Electric Commercial Vehicle Battery Pack Market Revenue Share (%), by Body Type 2024 & 2032
- Figure 76: Asia Pacific Electric Commercial Vehicle Battery Pack Market Revenue (Million), by Propulsion Type 2024 & 2032
- Figure 77: Asia Pacific Electric Commercial Vehicle Battery Pack Market Revenue Share (%), by Propulsion Type 2024 & 2032
- Figure 78: Asia Pacific Electric Commercial Vehicle Battery Pack Market Revenue (Million), by Battery Chemistry 2024 & 2032
- Figure 79: Asia Pacific Electric Commercial Vehicle Battery Pack Market Revenue Share (%), by Battery Chemistry 2024 & 2032
- Figure 80: Asia Pacific Electric Commercial Vehicle Battery Pack Market Revenue (Million), by Capacity 2024 & 2032
- Figure 81: Asia Pacific Electric Commercial Vehicle Battery Pack Market Revenue Share (%), by Capacity 2024 & 2032
- Figure 82: Asia Pacific Electric Commercial Vehicle Battery Pack Market Revenue (Million), by Battery Form 2024 & 2032
- Figure 83: Asia Pacific Electric Commercial Vehicle Battery Pack Market Revenue Share (%), by Battery Form 2024 & 2032
- Figure 84: Asia Pacific Electric Commercial Vehicle Battery Pack Market Revenue (Million), by Method 2024 & 2032
- Figure 85: Asia Pacific Electric Commercial Vehicle Battery Pack Market Revenue Share (%), by Method 2024 & 2032
- Figure 86: Asia Pacific Electric Commercial Vehicle Battery Pack Market Revenue (Million), by Component 2024 & 2032
- Figure 87: Asia Pacific Electric Commercial Vehicle Battery Pack Market Revenue Share (%), by Component 2024 & 2032
- Figure 88: Asia Pacific Electric Commercial Vehicle Battery Pack Market Revenue (Million), by Material Type 2024 & 2032
- Figure 89: Asia Pacific Electric Commercial Vehicle Battery Pack Market Revenue Share (%), by Material Type 2024 & 2032
- Figure 90: Asia Pacific Electric Commercial Vehicle Battery Pack Market Revenue (Million), by Country 2024 & 2032
- Figure 91: Asia Pacific Electric Commercial Vehicle Battery Pack Market Revenue Share (%), by Country 2024 & 2032
List of Tables
- Table 1: Global Electric Commercial Vehicle Battery Pack Market Revenue Million Forecast, by Region 2019 & 2032
- Table 2: Global Electric Commercial Vehicle Battery Pack Market Revenue Million Forecast, by Body Type 2019 & 2032
- Table 3: Global Electric Commercial Vehicle Battery Pack Market Revenue Million Forecast, by Propulsion Type 2019 & 2032
- Table 4: Global Electric Commercial Vehicle Battery Pack Market Revenue Million Forecast, by Battery Chemistry 2019 & 2032
- Table 5: Global Electric Commercial Vehicle Battery Pack Market Revenue Million Forecast, by Capacity 2019 & 2032
- Table 6: Global Electric Commercial Vehicle Battery Pack Market Revenue Million Forecast, by Battery Form 2019 & 2032
- Table 7: Global Electric Commercial Vehicle Battery Pack Market Revenue Million Forecast, by Method 2019 & 2032
- Table 8: Global Electric Commercial Vehicle Battery Pack Market Revenue Million Forecast, by Component 2019 & 2032
- Table 9: Global Electric Commercial Vehicle Battery Pack Market Revenue Million Forecast, by Material Type 2019 & 2032
- Table 10: Global Electric Commercial Vehicle Battery Pack Market Revenue Million Forecast, by Region 2019 & 2032
- Table 11: Global Electric Commercial Vehicle Battery Pack Market Revenue Million Forecast, by Body Type 2019 & 2032
- Table 12: Global Electric Commercial Vehicle Battery Pack Market Revenue Million Forecast, by Propulsion Type 2019 & 2032
- Table 13: Global Electric Commercial Vehicle Battery Pack Market Revenue Million Forecast, by Battery Chemistry 2019 & 2032
- Table 14: Global Electric Commercial Vehicle Battery Pack Market Revenue Million Forecast, by Capacity 2019 & 2032
- Table 15: Global Electric Commercial Vehicle Battery Pack Market Revenue Million Forecast, by Battery Form 2019 & 2032
- Table 16: Global Electric Commercial Vehicle Battery Pack Market Revenue Million Forecast, by Method 2019 & 2032
- Table 17: Global Electric Commercial Vehicle Battery Pack Market Revenue Million Forecast, by Component 2019 & 2032
- Table 18: Global Electric Commercial Vehicle Battery Pack Market Revenue Million Forecast, by Material Type 2019 & 2032
- Table 19: Global Electric Commercial Vehicle Battery Pack Market Revenue Million Forecast, by Country 2019 & 2032
- Table 20: United States Electric Commercial Vehicle Battery Pack Market Revenue (Million) Forecast, by Application 2019 & 2032
- Table 21: Canada Electric Commercial Vehicle Battery Pack Market Revenue (Million) Forecast, by Application 2019 & 2032
- Table 22: Mexico Electric Commercial Vehicle Battery Pack Market Revenue (Million) Forecast, by Application 2019 & 2032
- Table 23: Global Electric Commercial Vehicle Battery Pack Market Revenue Million Forecast, by Body Type 2019 & 2032
- Table 24: Global Electric Commercial Vehicle Battery Pack Market Revenue Million Forecast, by Propulsion Type 2019 & 2032
- Table 25: Global Electric Commercial Vehicle Battery Pack Market Revenue Million Forecast, by Battery Chemistry 2019 & 2032
- Table 26: Global Electric Commercial Vehicle Battery Pack Market Revenue Million Forecast, by Capacity 2019 & 2032
- Table 27: Global Electric Commercial Vehicle Battery Pack Market Revenue Million Forecast, by Battery Form 2019 & 2032
- Table 28: Global Electric Commercial Vehicle Battery Pack Market Revenue Million Forecast, by Method 2019 & 2032
- Table 29: Global Electric Commercial Vehicle Battery Pack Market Revenue Million Forecast, by Component 2019 & 2032
- Table 30: Global Electric Commercial Vehicle Battery Pack Market Revenue Million Forecast, by Material Type 2019 & 2032
- Table 31: Global Electric Commercial Vehicle Battery Pack Market Revenue Million Forecast, by Country 2019 & 2032
- Table 32: Brazil Electric Commercial Vehicle Battery Pack Market Revenue (Million) Forecast, by Application 2019 & 2032
- Table 33: Argentina Electric Commercial Vehicle Battery Pack Market Revenue (Million) Forecast, by Application 2019 & 2032
- Table 34: Rest of South America Electric Commercial Vehicle Battery Pack Market Revenue (Million) Forecast, by Application 2019 & 2032
- Table 35: Global Electric Commercial Vehicle Battery Pack Market Revenue Million Forecast, by Body Type 2019 & 2032
- Table 36: Global Electric Commercial Vehicle Battery Pack Market Revenue Million Forecast, by Propulsion Type 2019 & 2032
- Table 37: Global Electric Commercial Vehicle Battery Pack Market Revenue Million Forecast, by Battery Chemistry 2019 & 2032
- Table 38: Global Electric Commercial Vehicle Battery Pack Market Revenue Million Forecast, by Capacity 2019 & 2032
- Table 39: Global Electric Commercial Vehicle Battery Pack Market Revenue Million Forecast, by Battery Form 2019 & 2032
- Table 40: Global Electric Commercial Vehicle Battery Pack Market Revenue Million Forecast, by Method 2019 & 2032
- Table 41: Global Electric Commercial Vehicle Battery Pack Market Revenue Million Forecast, by Component 2019 & 2032
- Table 42: Global Electric Commercial Vehicle Battery Pack Market Revenue Million Forecast, by Material Type 2019 & 2032
- Table 43: Global Electric Commercial Vehicle Battery Pack Market Revenue Million Forecast, by Country 2019 & 2032
- Table 44: United Kingdom Electric Commercial Vehicle Battery Pack Market Revenue (Million) Forecast, by Application 2019 & 2032
- Table 45: Germany Electric Commercial Vehicle Battery Pack Market Revenue (Million) Forecast, by Application 2019 & 2032
- Table 46: France Electric Commercial Vehicle Battery Pack Market Revenue (Million) Forecast, by Application 2019 & 2032
- Table 47: Italy Electric Commercial Vehicle Battery Pack Market Revenue (Million) Forecast, by Application 2019 & 2032
- Table 48: Spain Electric Commercial Vehicle Battery Pack Market Revenue (Million) Forecast, by Application 2019 & 2032
- Table 49: Russia Electric Commercial Vehicle Battery Pack Market Revenue (Million) Forecast, by Application 2019 & 2032
- Table 50: Benelux Electric Commercial Vehicle Battery Pack Market Revenue (Million) Forecast, by Application 2019 & 2032
- Table 51: Nordics Electric Commercial Vehicle Battery Pack Market Revenue (Million) Forecast, by Application 2019 & 2032
- Table 52: Rest of Europe Electric Commercial Vehicle Battery Pack Market Revenue (Million) Forecast, by Application 2019 & 2032
- Table 53: Global Electric Commercial Vehicle Battery Pack Market Revenue Million Forecast, by Body Type 2019 & 2032
- Table 54: Global Electric Commercial Vehicle Battery Pack Market Revenue Million Forecast, by Propulsion Type 2019 & 2032
- Table 55: Global Electric Commercial Vehicle Battery Pack Market Revenue Million Forecast, by Battery Chemistry 2019 & 2032
- Table 56: Global Electric Commercial Vehicle Battery Pack Market Revenue Million Forecast, by Capacity 2019 & 2032
- Table 57: Global Electric Commercial Vehicle Battery Pack Market Revenue Million Forecast, by Battery Form 2019 & 2032
- Table 58: Global Electric Commercial Vehicle Battery Pack Market Revenue Million Forecast, by Method 2019 & 2032
- Table 59: Global Electric Commercial Vehicle Battery Pack Market Revenue Million Forecast, by Component 2019 & 2032
- Table 60: Global Electric Commercial Vehicle Battery Pack Market Revenue Million Forecast, by Material Type 2019 & 2032
- Table 61: Global Electric Commercial Vehicle Battery Pack Market Revenue Million Forecast, by Country 2019 & 2032
- Table 62: Turkey Electric Commercial Vehicle Battery Pack Market Revenue (Million) Forecast, by Application 2019 & 2032
- Table 63: Israel Electric Commercial Vehicle Battery Pack Market Revenue (Million) Forecast, by Application 2019 & 2032
- Table 64: GCC Electric Commercial Vehicle Battery Pack Market Revenue (Million) Forecast, by Application 2019 & 2032
- Table 65: North Africa Electric Commercial Vehicle Battery Pack Market Revenue (Million) Forecast, by Application 2019 & 2032
- Table 66: South Africa Electric Commercial Vehicle Battery Pack Market Revenue (Million) Forecast, by Application 2019 & 2032
- Table 67: Rest of Middle East & Africa Electric Commercial Vehicle Battery Pack Market Revenue (Million) Forecast, by Application 2019 & 2032
- Table 68: Global Electric Commercial Vehicle Battery Pack Market Revenue Million Forecast, by Body Type 2019 & 2032
- Table 69: Global Electric Commercial Vehicle Battery Pack Market Revenue Million Forecast, by Propulsion Type 2019 & 2032
- Table 70: Global Electric Commercial Vehicle Battery Pack Market Revenue Million Forecast, by Battery Chemistry 2019 & 2032
- Table 71: Global Electric Commercial Vehicle Battery Pack Market Revenue Million Forecast, by Capacity 2019 & 2032
- Table 72: Global Electric Commercial Vehicle Battery Pack Market Revenue Million Forecast, by Battery Form 2019 & 2032
- Table 73: Global Electric Commercial Vehicle Battery Pack Market Revenue Million Forecast, by Method 2019 & 2032
- Table 74: Global Electric Commercial Vehicle Battery Pack Market Revenue Million Forecast, by Component 2019 & 2032
- Table 75: Global Electric Commercial Vehicle Battery Pack Market Revenue Million Forecast, by Material Type 2019 & 2032
- Table 76: Global Electric Commercial Vehicle Battery Pack Market Revenue Million Forecast, by Country 2019 & 2032
- Table 77: China Electric Commercial Vehicle Battery Pack Market Revenue (Million) Forecast, by Application 2019 & 2032
- Table 78: India Electric Commercial Vehicle Battery Pack Market Revenue (Million) Forecast, by Application 2019 & 2032
- Table 79: Japan Electric Commercial Vehicle Battery Pack Market Revenue (Million) Forecast, by Application 2019 & 2032
- Table 80: South Korea Electric Commercial Vehicle Battery Pack Market Revenue (Million) Forecast, by Application 2019 & 2032
- Table 81: ASEAN Electric Commercial Vehicle Battery Pack Market Revenue (Million) Forecast, by Application 2019 & 2032
- Table 82: Oceania Electric Commercial Vehicle Battery Pack Market Revenue (Million) Forecast, by Application 2019 & 2032
- Table 83: Rest of Asia Pacific Electric Commercial Vehicle Battery Pack Market Revenue (Million) Forecast, by Application 2019 & 2032
Frequently Asked Questions
1. What is the projected Compound Annual Growth Rate (CAGR) of the Electric Commercial Vehicle Battery Pack Market?
The projected CAGR is approximately 4.90%.
2. Which companies are prominent players in the Electric Commercial Vehicle Battery Pack Market?
Key companies in the market include Tianjin Lishen Battery Joint-Stock Co Ltd (Lishen Battery, Tata Autocomp Systems Ltd, China Aviation Battery Co Ltd (CALB), Samsung SDI Co Ltd, LG Energy Solution Ltd, A123 Systems LLC, Guoxuan High-tech Co Ltd, Farasis Energy (Ganzhou) Co Ltd, Contemporary Amperex Technology Co Ltd (CATL), BYD Company Ltd, Sunwoda Electric Vehicle Battery Co Ltd (Sunwoda), SK Innovation Co Ltd, EVE Energy Co Ltd, Panasonic Holdings Corporation.
3. What are the main segments of the Electric Commercial Vehicle Battery Pack Market?
The market segments include Body Type, Propulsion Type, Battery Chemistry, Capacity, Battery Form, Method, Component, Material Type.
4. Can you provide details about the market size?
The market size is estimated to be USD XX Million as of 2022.
5. What are some drivers contributing to market growth?
The Rise of Trade Agreements Between Nations; Increasing Volume of International Trade.
6. What are the notable trends driving market growth?
OTHER KEY INDUSTRY TRENDS COVERED IN THE REPORT.
7. Are there any restraints impacting market growth?
Surge in Fuel Costs Affecting the Market.
8. Can you provide examples of recent developments in the market?
February 2023: LG Energy Solution will invest 10 trillion won this year, up 50 percent from 6.3 trillion won a year ago, and expand its global production capacity by 50 percent to 300 gigawatt hours (GWh).February 2023: LG Energy Solution is unlocking more sustainable battery value chain with the world's first battery passport.February 2023: LG Energy Solution and Freudenberg e-Power Systems have signed a multi-year contract for the supply of lithium-ion battery cell modules with a total capacity of 19 GWh.
9. What pricing options are available for accessing the report?
Pricing options include single-user, multi-user, and enterprise licenses priced at USD 3800, USD 4500, and USD 5800 respectively.
10. Is the market size provided in terms of value or volume?
The market size is provided in terms of value, measured in Million.
11. Are there any specific market keywords associated with the report?
Yes, the market keyword associated with the report is "Electric Commercial Vehicle Battery Pack Market," which aids in identifying and referencing the specific market segment covered.
12. How do I determine which pricing option suits my needs best?
The pricing options vary based on user requirements and access needs. Individual users may opt for single-user licenses, while businesses requiring broader access may choose multi-user or enterprise licenses for cost-effective access to the report.
13. Are there any additional resources or data provided in the Electric Commercial Vehicle Battery Pack Market report?
While the report offers comprehensive insights, it's advisable to review the specific contents or supplementary materials provided to ascertain if additional resources or data are available.
14. How can I stay updated on further developments or reports in the Electric Commercial Vehicle Battery Pack Market?
To stay informed about further developments, trends, and reports in the Electric Commercial Vehicle Battery Pack Market, consider subscribing to industry newsletters, following relevant companies and organizations, or regularly checking reputable industry news sources and publications.
Methodology
Step 1 - Identification of Relevant Samples Size from Population Database


Step 2 - Approaches for Defining Global Market Size (Value, Volume* & Price*)

Note*: In applicable scenarios
Step 3 - Data Sources
Primary Research
- Web Analytics
- Survey Reports
- Research Institute
- Latest Research Reports
- Opinion Leaders
Secondary Research
- Annual Reports
- White Paper
- Latest Press Release
- Industry Association
- Paid Database
- Investor Presentations

Step 4 - Data Triangulation
Involves using different sources of information in order to increase the validity of a study
These sources are likely to be stakeholders in a program - participants, other researchers, program staff, other community members, and so on.
Then we put all data in single framework & apply various statistical tools to find out the dynamic on the market.
During the analysis stage, feedback from the stakeholder groups would be compared to determine areas of agreement as well as areas of divergence
