

Key Insights
The global electric three-wheeler market is experiencing robust growth, projected to reach a market size of $1.17 billion in 2025 and exhibiting a Compound Annual Growth Rate (CAGR) of 9.31% from 2025 to 2033. This expansion is fueled by several key factors. Increasing environmental concerns and stringent emission regulations are driving the adoption of eco-friendly transportation solutions, making electric three-wheelers an attractive alternative to traditional combustion engine vehicles, particularly in urban areas plagued by congestion and pollution. Furthermore, the declining cost of lithium-ion batteries, a crucial component of these vehicles, is significantly enhancing their affordability and competitiveness. Government incentives, subsidies, and supportive policies in several regions, notably in Asia-Pacific countries like India and China, are further propelling market growth. The market is segmented by end-use (passenger carriers and goods carriers) and battery type (Li-ion and lead-acid), with Li-ion batteries gaining significant traction due to their superior performance and longer lifespan. The diverse range of applications, from last-mile delivery to passenger transport, contributes to the market's versatility and growth potential. Key players like Mahindra Electric, Piaggio, and others are actively innovating and expanding their product portfolios to cater to evolving customer demands and technological advancements.
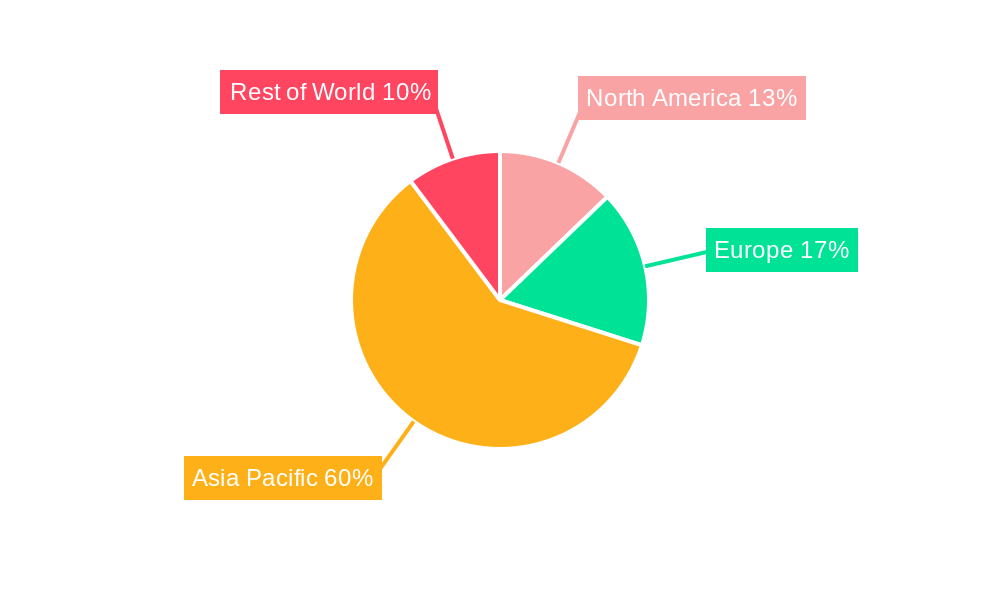
The geographical distribution of the market reveals a strong concentration in the Asia-Pacific region, driven by high population density, rapid urbanization, and increasing demand for affordable and efficient transportation. However, North America and Europe are also witnessing significant growth, albeit at a slower pace, fueled by increasing environmental awareness and the adoption of sustainable mobility solutions. The competitive landscape is dynamic, with both established automotive manufacturers and specialized electric vehicle companies vying for market share. Future growth will likely be shaped by advancements in battery technology, improvements in charging infrastructure, and the continued development of innovative business models, such as vehicle sharing and subscription services, further expanding accessibility and affordability for a broader consumer base. The long-term outlook for the electric three-wheeler market remains exceptionally positive, suggesting considerable investment opportunities and a significant contribution to a more sustainable transportation future.

Electric Three-Wheeler Industry Market Report: 2019-2033
This comprehensive report provides an in-depth analysis of the electric three-wheeler industry, encompassing market dynamics, growth trends, regional dominance, product landscape, and key players. The study period covers 2019-2033, with a base year of 2025 and a forecast period of 2025-2033. The report offers invaluable insights for industry professionals, investors, and stakeholders seeking to understand and capitalize on the burgeoning electric three-wheeler market. Parent market: Electric Vehicle Market; Child Market: Commercial Electric Vehicles. Expected total market size in 2025: xx Million Units.
Electric Three-Wheeler Industry Market Dynamics & Structure
This section analyzes the competitive landscape, technological advancements, regulatory influences, and market trends within the electric three-wheeler sector. We examine market concentration, exploring the market share held by key players like Bodo Vehicle Group Co Ltd, ATUL Auto Limite, and Mahindra Electric. The report also delves into technological innovation drivers, such as advancements in battery technology (Li-ion and Lead Acid) and motor efficiency. Regulatory frameworks impacting adoption, including government incentives and emission standards, are thoroughly investigated. The analysis also considers the impact of competitive substitutes (e.g., gasoline-powered three-wheelers) and evolving end-user demographics. Finally, the report assesses M&A activity within the industry, providing quantitative data on deal volumes and qualitative insights into the drivers and barriers to mergers and acquisitions.
- Market Concentration: xx% market share held by top 5 players in 2025.
- Technological Innovation: Focus on improving battery range and charging infrastructure.
- Regulatory Framework: Analysis of government subsidies and emission regulations across key regions.
- Competitive Substitutes: Comparative analysis of cost and performance against gasoline-powered alternatives.
- M&A Activity: xx number of M&A deals recorded between 2019 and 2024.
Electric Three-Wheeler Industry Growth Trends & Insights
This section presents a detailed analysis of the electric three-wheeler market's growth trajectory from 2019 to 2033. We examine historical data and project future growth based on various market drivers, technological disruptions, and evolving consumer behavior. The analysis includes a comprehensive evaluation of market size evolution, expressed in million units, and identifies key growth drivers and challenges, including CAGR projections and market penetration rates for both passenger and goods carrier segments. We explore the impact of technological advancements, such as improved battery technology and charging infrastructure, and analyze consumer preferences and adoption rates across different regions. We provide quantitative insights into market size, CAGR, and market penetration for both the historical (2019-2024) and forecast (2025-2033) periods.
- Market Size Evolution: From xx Million Units in 2019 to a projected xx Million Units in 2033.
- CAGR: Projected CAGR of xx% during the forecast period (2025-2033).
- Market Penetration: Expected penetration rate of xx% by 2033 in key markets.

Dominant Regions, Countries, or Segments in Electric Three-Wheeler Industry
This section identifies the leading regions, countries, and segments within the electric three-wheeler market. We analyze the factors driving market growth in these dominant areas, such as favorable government policies, robust infrastructure development, and strong consumer demand. Specific focus will be given to End-Use (Passenger Carrier vs. Goods Carrier) and Battery Type (Li-ion vs. Lead Acid). We will provide detailed market share data and growth projections for each segment and region, highlighting the key factors contributing to their dominance.
- Dominant Region: [Region Name] due to [Reasons: e.g., strong government support, large market size].
- Dominant Segment (End-Use): [Passenger Carrier/Goods Carrier] due to [Reasons: e.g., increasing urbanization, e-commerce growth].
- Dominant Segment (Battery Type): [Li-ion/Lead Acid] due to [Reasons: e.g., cost-effectiveness, longer lifespan].
Electric Three-Wheeler Industry Product Landscape
This section provides a concise overview of the electric three-wheeler product landscape, highlighting key product innovations, applications, and performance metrics. We will discuss the unique selling propositions of different models and analyze technological advancements impacting product features and functionality. The analysis will encompass a range of features, including battery technology, motor power, range, and charging time.
- Key features: [list key features and innovations]
Key Drivers, Barriers & Challenges in Electric Three-Wheeler Industry
This section outlines the key factors driving and hindering the growth of the electric three-wheeler market. Driving factors include government incentives, rising fuel prices, and environmental concerns. Challenges encompass high initial costs, limited charging infrastructure, and competition from traditional three-wheelers. We will provide specific examples and quantify the impact of these factors where possible.
- Key Drivers: Government subsidies, rising fuel costs, environmental regulations.
- Key Barriers: High initial purchase price, range anxiety, limited charging infrastructure, xx% higher cost than gasoline equivalent.
Emerging Opportunities in Electric Three-Wheeler Industry
This section highlights emerging trends and opportunities within the electric three-wheeler industry. We will explore untapped markets, innovative applications, and evolving consumer preferences. Potential opportunities include expansion into new geographies, development of specialized models for specific applications, and integration of advanced technologies, such as smart connectivity.
- Untapped Markets: [List potential markets and reasons].
- Innovative Applications: [List innovative applications]
Growth Accelerators in the Electric Three-Wheeler Industry Industry
This section discusses the catalysts that will drive long-term growth in the electric three-wheeler market. These include technological breakthroughs, strategic partnerships, and expansion into new markets. We will analyze how these factors will contribute to market expansion and increased adoption.
Key Players Shaping the Electric Three-Wheeler Industry Market
- Bodo Vehicle Group Co Ltd
- ATUL Auto Limite
- Goenka Electric Motor Vehicles Pvt Ltd
- Kinetic Green Energy & Power Solutions Ltd
- Lohia Auto Industries
- Piaggio & C Spa
- E-Tuk Factory BV
- Omega Seiki Private Limited
- Terra Motors Corporation
- Mahindra Electric
Notable Milestones in Electric Three-Wheeler Industry Sector
- [Year/Month]: [Milestone description and impact]
- [Year/Month]: [Milestone description and impact]
- [Year/Month]: [Milestone description and impact]
In-Depth Electric Three-Wheeler Industry Market Outlook
This section summarizes the key growth accelerators and provides a forward-looking perspective on the electric three-wheeler market. We will discuss the future market potential, strategic opportunities for key players, and potential challenges that could affect future growth. The analysis will highlight the long-term prospects for the industry, emphasizing the potential for significant market expansion and the role of technological innovation in shaping future market dynamics.
Electric Three-Wheeler Industry Segmentation
-
1. End-Use
- 1.1. Passenger Carrier
- 1.2. Goods Carrier
-
2. Battery Type
- 2.1. Li-ion
- 2.2. Lead Acid
Electric Three-Wheeler Industry Segmentation By Geography
-
1. North America
- 1.1. United States
- 1.2. Canada
- 1.3. Rest of North America
-
2. Europe
- 2.1. Germany
- 2.2. United Kingdom
- 2.3. France
- 2.4. Rest of Europe
-
3. Asia Pacific
- 3.1. India
- 3.2. China
- 3.3. Japan
- 3.4. South Korea
- 3.5. Rest of Asia Pacific
-
4. Rest of the World
- 4.1. Brazil
- 4.2. South Africa
- 4.3. Other Countries
Electric Three-Wheeler Industry REPORT HIGHLIGHTS
| Aspects | Details |
|---|---|
| Study Period | 2019-2033 |
| Base Year | 2024 |
| Estimated Year | 2025 |
| Forecast Period | 2025-2033 |
| Historical Period | 2019-2024 |
| Growth Rate | CAGR of 9.31% from 2019-2033 |
| Segmentation |
|
Table of Contents
- 1. Introduction
- 1.1. Research Scope
- 1.2. Market Segmentation
- 1.3. Research Methodology
- 1.4. Definitions and Assumptions
- 2. Executive Summary
- 2.1. Introduction
- 3. Market Dynamics
- 3.1. Introduction
- 3.2. Market Drivers
- 3.2.1. Rising Automotive Vehicle Sales Anticipated to Drive the Market
- 3.3. Market Restrains
- 3.3.1. High Initial Cost Acting as Barrier for the Market
- 3.4. Market Trends
- 3.4.1. Increasing Focus on Emission Control Driving the Market
- 4. Market Factor Analysis
- 4.1. Porters Five Forces
- 4.2. Supply/Value Chain
- 4.3. PESTEL analysis
- 4.4. Market Entropy
- 4.5. Patent/Trademark Analysis
- 5. Global Electric Three-Wheeler Industry Analysis, Insights and Forecast, 2019-2031
- 5.1. Market Analysis, Insights and Forecast - by End-Use
- 5.1.1. Passenger Carrier
- 5.1.2. Goods Carrier
- 5.2. Market Analysis, Insights and Forecast - by Battery Type
- 5.2.1. Li-ion
- 5.2.2. Lead Acid
- 5.3. Market Analysis, Insights and Forecast - by Region
- 5.3.1. North America
- 5.3.2. Europe
- 5.3.3. Asia Pacific
- 5.3.4. Rest of the World
- 5.1. Market Analysis, Insights and Forecast - by End-Use
- 6. North America Electric Three-Wheeler Industry Analysis, Insights and Forecast, 2019-2031
- 6.1. Market Analysis, Insights and Forecast - by End-Use
- 6.1.1. Passenger Carrier
- 6.1.2. Goods Carrier
- 6.2. Market Analysis, Insights and Forecast - by Battery Type
- 6.2.1. Li-ion
- 6.2.2. Lead Acid
- 6.1. Market Analysis, Insights and Forecast - by End-Use
- 7. Europe Electric Three-Wheeler Industry Analysis, Insights and Forecast, 2019-2031
- 7.1. Market Analysis, Insights and Forecast - by End-Use
- 7.1.1. Passenger Carrier
- 7.1.2. Goods Carrier
- 7.2. Market Analysis, Insights and Forecast - by Battery Type
- 7.2.1. Li-ion
- 7.2.2. Lead Acid
- 7.1. Market Analysis, Insights and Forecast - by End-Use
- 8. Asia Pacific Electric Three-Wheeler Industry Analysis, Insights and Forecast, 2019-2031
- 8.1. Market Analysis, Insights and Forecast - by End-Use
- 8.1.1. Passenger Carrier
- 8.1.2. Goods Carrier
- 8.2. Market Analysis, Insights and Forecast - by Battery Type
- 8.2.1. Li-ion
- 8.2.2. Lead Acid
- 8.1. Market Analysis, Insights and Forecast - by End-Use
- 9. Rest of the World Electric Three-Wheeler Industry Analysis, Insights and Forecast, 2019-2031
- 9.1. Market Analysis, Insights and Forecast - by End-Use
- 9.1.1. Passenger Carrier
- 9.1.2. Goods Carrier
- 9.2. Market Analysis, Insights and Forecast - by Battery Type
- 9.2.1. Li-ion
- 9.2.2. Lead Acid
- 9.1. Market Analysis, Insights and Forecast - by End-Use
- 10. North America Electric Three-Wheeler Industry Analysis, Insights and Forecast, 2019-2031
- 10.1. Market Analysis, Insights and Forecast - By Country/Sub-region
- 10.1.1 United States
- 10.1.2 Canada
- 10.1.3 Rest of North America
- 11. Europe Electric Three-Wheeler Industry Analysis, Insights and Forecast, 2019-2031
- 11.1. Market Analysis, Insights and Forecast - By Country/Sub-region
- 11.1.1 Germany
- 11.1.2 United Kingdom
- 11.1.3 France
- 11.1.4 Rest of Europe
- 12. Asia Pacific Electric Three-Wheeler Industry Analysis, Insights and Forecast, 2019-2031
- 12.1. Market Analysis, Insights and Forecast - By Country/Sub-region
- 12.1.1 India
- 12.1.2 China
- 12.1.3 Japan
- 12.1.4 South Korea
- 12.1.5 Rest of Asia Pacific
- 13. Rest of the World Electric Three-Wheeler Industry Analysis, Insights and Forecast, 2019-2031
- 13.1. Market Analysis, Insights and Forecast - By Country/Sub-region
- 13.1.1 Brazil
- 13.1.2 South Africa
- 13.1.3 Other Countries
- 14. Competitive Analysis
- 14.1. Global Market Share Analysis 2024
- 14.2. Company Profiles
- 14.2.1 Bodo Vehicle Group Co Ltd
- 14.2.1.1. Overview
- 14.2.1.2. Products
- 14.2.1.3. SWOT Analysis
- 14.2.1.4. Recent Developments
- 14.2.1.5. Financials (Based on Availability)
- 14.2.2 ATUL Auto Limite
- 14.2.2.1. Overview
- 14.2.2.2. Products
- 14.2.2.3. SWOT Analysis
- 14.2.2.4. Recent Developments
- 14.2.2.5. Financials (Based on Availability)
- 14.2.3 Goenka Electric Motor Vehicles Pvt Ltd
- 14.2.3.1. Overview
- 14.2.3.2. Products
- 14.2.3.3. SWOT Analysis
- 14.2.3.4. Recent Developments
- 14.2.3.5. Financials (Based on Availability)
- 14.2.4 Kinetic Green Energy & Power Solutions Ltd
- 14.2.4.1. Overview
- 14.2.4.2. Products
- 14.2.4.3. SWOT Analysis
- 14.2.4.4. Recent Developments
- 14.2.4.5. Financials (Based on Availability)
- 14.2.5 Lohia Auto Industries
- 14.2.5.1. Overview
- 14.2.5.2. Products
- 14.2.5.3. SWOT Analysis
- 14.2.5.4. Recent Developments
- 14.2.5.5. Financials (Based on Availability)
- 14.2.6 Piaggion & C Spa
- 14.2.6.1. Overview
- 14.2.6.2. Products
- 14.2.6.3. SWOT Analysis
- 14.2.6.4. Recent Developments
- 14.2.6.5. Financials (Based on Availability)
- 14.2.7 E-Tuk Factory BV
- 14.2.7.1. Overview
- 14.2.7.2. Products
- 14.2.7.3. SWOT Analysis
- 14.2.7.4. Recent Developments
- 14.2.7.5. Financials (Based on Availability)
- 14.2.8 Omega Seiki Private Limited
- 14.2.8.1. Overview
- 14.2.8.2. Products
- 14.2.8.3. SWOT Analysis
- 14.2.8.4. Recent Developments
- 14.2.8.5. Financials (Based on Availability)
- 14.2.9 Terra Motors Corporation
- 14.2.9.1. Overview
- 14.2.9.2. Products
- 14.2.9.3. SWOT Analysis
- 14.2.9.4. Recent Developments
- 14.2.9.5. Financials (Based on Availability)
- 14.2.10 Mahindra Electric
- 14.2.10.1. Overview
- 14.2.10.2. Products
- 14.2.10.3. SWOT Analysis
- 14.2.10.4. Recent Developments
- 14.2.10.5. Financials (Based on Availability)
- 14.2.1 Bodo Vehicle Group Co Ltd
List of Figures
- Figure 1: Global Electric Three-Wheeler Industry Revenue Breakdown (Million, %) by Region 2024 & 2032
- Figure 2: North America Electric Three-Wheeler Industry Revenue (Million), by Country 2024 & 2032
- Figure 3: North America Electric Three-Wheeler Industry Revenue Share (%), by Country 2024 & 2032
- Figure 4: Europe Electric Three-Wheeler Industry Revenue (Million), by Country 2024 & 2032
- Figure 5: Europe Electric Three-Wheeler Industry Revenue Share (%), by Country 2024 & 2032
- Figure 6: Asia Pacific Electric Three-Wheeler Industry Revenue (Million), by Country 2024 & 2032
- Figure 7: Asia Pacific Electric Three-Wheeler Industry Revenue Share (%), by Country 2024 & 2032
- Figure 8: Rest of the World Electric Three-Wheeler Industry Revenue (Million), by Country 2024 & 2032
- Figure 9: Rest of the World Electric Three-Wheeler Industry Revenue Share (%), by Country 2024 & 2032
- Figure 10: North America Electric Three-Wheeler Industry Revenue (Million), by End-Use 2024 & 2032
- Figure 11: North America Electric Three-Wheeler Industry Revenue Share (%), by End-Use 2024 & 2032
- Figure 12: North America Electric Three-Wheeler Industry Revenue (Million), by Battery Type 2024 & 2032
- Figure 13: North America Electric Three-Wheeler Industry Revenue Share (%), by Battery Type 2024 & 2032
- Figure 14: North America Electric Three-Wheeler Industry Revenue (Million), by Country 2024 & 2032
- Figure 15: North America Electric Three-Wheeler Industry Revenue Share (%), by Country 2024 & 2032
- Figure 16: Europe Electric Three-Wheeler Industry Revenue (Million), by End-Use 2024 & 2032
- Figure 17: Europe Electric Three-Wheeler Industry Revenue Share (%), by End-Use 2024 & 2032
- Figure 18: Europe Electric Three-Wheeler Industry Revenue (Million), by Battery Type 2024 & 2032
- Figure 19: Europe Electric Three-Wheeler Industry Revenue Share (%), by Battery Type 2024 & 2032
- Figure 20: Europe Electric Three-Wheeler Industry Revenue (Million), by Country 2024 & 2032
- Figure 21: Europe Electric Three-Wheeler Industry Revenue Share (%), by Country 2024 & 2032
- Figure 22: Asia Pacific Electric Three-Wheeler Industry Revenue (Million), by End-Use 2024 & 2032
- Figure 23: Asia Pacific Electric Three-Wheeler Industry Revenue Share (%), by End-Use 2024 & 2032
- Figure 24: Asia Pacific Electric Three-Wheeler Industry Revenue (Million), by Battery Type 2024 & 2032
- Figure 25: Asia Pacific Electric Three-Wheeler Industry Revenue Share (%), by Battery Type 2024 & 2032
- Figure 26: Asia Pacific Electric Three-Wheeler Industry Revenue (Million), by Country 2024 & 2032
- Figure 27: Asia Pacific Electric Three-Wheeler Industry Revenue Share (%), by Country 2024 & 2032
- Figure 28: Rest of the World Electric Three-Wheeler Industry Revenue (Million), by End-Use 2024 & 2032
- Figure 29: Rest of the World Electric Three-Wheeler Industry Revenue Share (%), by End-Use 2024 & 2032
- Figure 30: Rest of the World Electric Three-Wheeler Industry Revenue (Million), by Battery Type 2024 & 2032
- Figure 31: Rest of the World Electric Three-Wheeler Industry Revenue Share (%), by Battery Type 2024 & 2032
- Figure 32: Rest of the World Electric Three-Wheeler Industry Revenue (Million), by Country 2024 & 2032
- Figure 33: Rest of the World Electric Three-Wheeler Industry Revenue Share (%), by Country 2024 & 2032
List of Tables
- Table 1: Global Electric Three-Wheeler Industry Revenue Million Forecast, by Region 2019 & 2032
- Table 2: Global Electric Three-Wheeler Industry Revenue Million Forecast, by End-Use 2019 & 2032
- Table 3: Global Electric Three-Wheeler Industry Revenue Million Forecast, by Battery Type 2019 & 2032
- Table 4: Global Electric Three-Wheeler Industry Revenue Million Forecast, by Region 2019 & 2032
- Table 5: Global Electric Three-Wheeler Industry Revenue Million Forecast, by Country 2019 & 2032
- Table 6: United States Electric Three-Wheeler Industry Revenue (Million) Forecast, by Application 2019 & 2032
- Table 7: Canada Electric Three-Wheeler Industry Revenue (Million) Forecast, by Application 2019 & 2032
- Table 8: Rest of North America Electric Three-Wheeler Industry Revenue (Million) Forecast, by Application 2019 & 2032
- Table 9: Global Electric Three-Wheeler Industry Revenue Million Forecast, by Country 2019 & 2032
- Table 10: Germany Electric Three-Wheeler Industry Revenue (Million) Forecast, by Application 2019 & 2032
- Table 11: United Kingdom Electric Three-Wheeler Industry Revenue (Million) Forecast, by Application 2019 & 2032
- Table 12: France Electric Three-Wheeler Industry Revenue (Million) Forecast, by Application 2019 & 2032
- Table 13: Rest of Europe Electric Three-Wheeler Industry Revenue (Million) Forecast, by Application 2019 & 2032
- Table 14: Global Electric Three-Wheeler Industry Revenue Million Forecast, by Country 2019 & 2032
- Table 15: India Electric Three-Wheeler Industry Revenue (Million) Forecast, by Application 2019 & 2032
- Table 16: China Electric Three-Wheeler Industry Revenue (Million) Forecast, by Application 2019 & 2032
- Table 17: Japan Electric Three-Wheeler Industry Revenue (Million) Forecast, by Application 2019 & 2032
- Table 18: South Korea Electric Three-Wheeler Industry Revenue (Million) Forecast, by Application 2019 & 2032
- Table 19: Rest of Asia Pacific Electric Three-Wheeler Industry Revenue (Million) Forecast, by Application 2019 & 2032
- Table 20: Global Electric Three-Wheeler Industry Revenue Million Forecast, by Country 2019 & 2032
- Table 21: Brazil Electric Three-Wheeler Industry Revenue (Million) Forecast, by Application 2019 & 2032
- Table 22: South Africa Electric Three-Wheeler Industry Revenue (Million) Forecast, by Application 2019 & 2032
- Table 23: Other Countries Electric Three-Wheeler Industry Revenue (Million) Forecast, by Application 2019 & 2032
- Table 24: Global Electric Three-Wheeler Industry Revenue Million Forecast, by End-Use 2019 & 2032
- Table 25: Global Electric Three-Wheeler Industry Revenue Million Forecast, by Battery Type 2019 & 2032
- Table 26: Global Electric Three-Wheeler Industry Revenue Million Forecast, by Country 2019 & 2032
- Table 27: United States Electric Three-Wheeler Industry Revenue (Million) Forecast, by Application 2019 & 2032
- Table 28: Canada Electric Three-Wheeler Industry Revenue (Million) Forecast, by Application 2019 & 2032
- Table 29: Rest of North America Electric Three-Wheeler Industry Revenue (Million) Forecast, by Application 2019 & 2032
- Table 30: Global Electric Three-Wheeler Industry Revenue Million Forecast, by End-Use 2019 & 2032
- Table 31: Global Electric Three-Wheeler Industry Revenue Million Forecast, by Battery Type 2019 & 2032
- Table 32: Global Electric Three-Wheeler Industry Revenue Million Forecast, by Country 2019 & 2032
- Table 33: Germany Electric Three-Wheeler Industry Revenue (Million) Forecast, by Application 2019 & 2032
- Table 34: United Kingdom Electric Three-Wheeler Industry Revenue (Million) Forecast, by Application 2019 & 2032
- Table 35: France Electric Three-Wheeler Industry Revenue (Million) Forecast, by Application 2019 & 2032
- Table 36: Rest of Europe Electric Three-Wheeler Industry Revenue (Million) Forecast, by Application 2019 & 2032
- Table 37: Global Electric Three-Wheeler Industry Revenue Million Forecast, by End-Use 2019 & 2032
- Table 38: Global Electric Three-Wheeler Industry Revenue Million Forecast, by Battery Type 2019 & 2032
- Table 39: Global Electric Three-Wheeler Industry Revenue Million Forecast, by Country 2019 & 2032
- Table 40: India Electric Three-Wheeler Industry Revenue (Million) Forecast, by Application 2019 & 2032
- Table 41: China Electric Three-Wheeler Industry Revenue (Million) Forecast, by Application 2019 & 2032
- Table 42: Japan Electric Three-Wheeler Industry Revenue (Million) Forecast, by Application 2019 & 2032
- Table 43: South Korea Electric Three-Wheeler Industry Revenue (Million) Forecast, by Application 2019 & 2032
- Table 44: Rest of Asia Pacific Electric Three-Wheeler Industry Revenue (Million) Forecast, by Application 2019 & 2032
- Table 45: Global Electric Three-Wheeler Industry Revenue Million Forecast, by End-Use 2019 & 2032
- Table 46: Global Electric Three-Wheeler Industry Revenue Million Forecast, by Battery Type 2019 & 2032
- Table 47: Global Electric Three-Wheeler Industry Revenue Million Forecast, by Country 2019 & 2032
- Table 48: Brazil Electric Three-Wheeler Industry Revenue (Million) Forecast, by Application 2019 & 2032
- Table 49: South Africa Electric Three-Wheeler Industry Revenue (Million) Forecast, by Application 2019 & 2032
- Table 50: Other Countries Electric Three-Wheeler Industry Revenue (Million) Forecast, by Application 2019 & 2032
Frequently Asked Questions
1. What is the projected Compound Annual Growth Rate (CAGR) of the Electric Three-Wheeler Industry?
The projected CAGR is approximately 9.31%.
2. Which companies are prominent players in the Electric Three-Wheeler Industry?
Key companies in the market include Bodo Vehicle Group Co Ltd, ATUL Auto Limite, Goenka Electric Motor Vehicles Pvt Ltd, Kinetic Green Energy & Power Solutions Ltd, Lohia Auto Industries, Piaggion & C Spa, E-Tuk Factory BV, Omega Seiki Private Limited, Terra Motors Corporation, Mahindra Electric.
3. What are the main segments of the Electric Three-Wheeler Industry?
The market segments include End-Use, Battery Type.
4. Can you provide details about the market size?
The market size is estimated to be USD 1.17 Million as of 2022.
5. What are some drivers contributing to market growth?
Rising Automotive Vehicle Sales Anticipated to Drive the Market.
6. What are the notable trends driving market growth?
Increasing Focus on Emission Control Driving the Market.
7. Are there any restraints impacting market growth?
High Initial Cost Acting as Barrier for the Market.
8. Can you provide examples of recent developments in the market?
N/A
9. What pricing options are available for accessing the report?
Pricing options include single-user, multi-user, and enterprise licenses priced at USD 4750, USD 5250, and USD 8750 respectively.
10. Is the market size provided in terms of value or volume?
The market size is provided in terms of value, measured in Million.
11. Are there any specific market keywords associated with the report?
Yes, the market keyword associated with the report is "Electric Three-Wheeler Industry," which aids in identifying and referencing the specific market segment covered.
12. How do I determine which pricing option suits my needs best?
The pricing options vary based on user requirements and access needs. Individual users may opt for single-user licenses, while businesses requiring broader access may choose multi-user or enterprise licenses for cost-effective access to the report.
13. Are there any additional resources or data provided in the Electric Three-Wheeler Industry report?
While the report offers comprehensive insights, it's advisable to review the specific contents or supplementary materials provided to ascertain if additional resources or data are available.
14. How can I stay updated on further developments or reports in the Electric Three-Wheeler Industry?
To stay informed about further developments, trends, and reports in the Electric Three-Wheeler Industry, consider subscribing to industry newsletters, following relevant companies and organizations, or regularly checking reputable industry news sources and publications.
Methodology
Step 1 - Identification of Relevant Samples Size from Population Database


Step 2 - Approaches for Defining Global Market Size (Value, Volume* & Price*)

Note*: In applicable scenarios
Step 3 - Data Sources
Primary Research
- Web Analytics
- Survey Reports
- Research Institute
- Latest Research Reports
- Opinion Leaders
Secondary Research
- Annual Reports
- White Paper
- Latest Press Release
- Industry Association
- Paid Database
- Investor Presentations

Step 4 - Data Triangulation
Involves using different sources of information in order to increase the validity of a study
These sources are likely to be stakeholders in a program - participants, other researchers, program staff, other community members, and so on.
Then we put all data in single framework & apply various statistical tools to find out the dynamic on the market.
During the analysis stage, feedback from the stakeholder groups would be compared to determine areas of agreement as well as areas of divergence
