

Key Insights
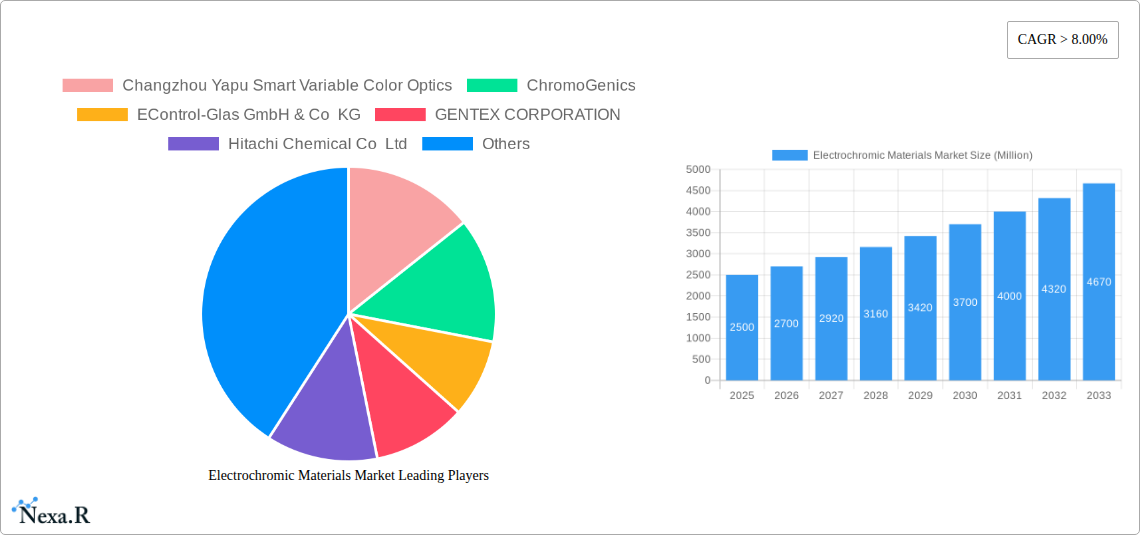
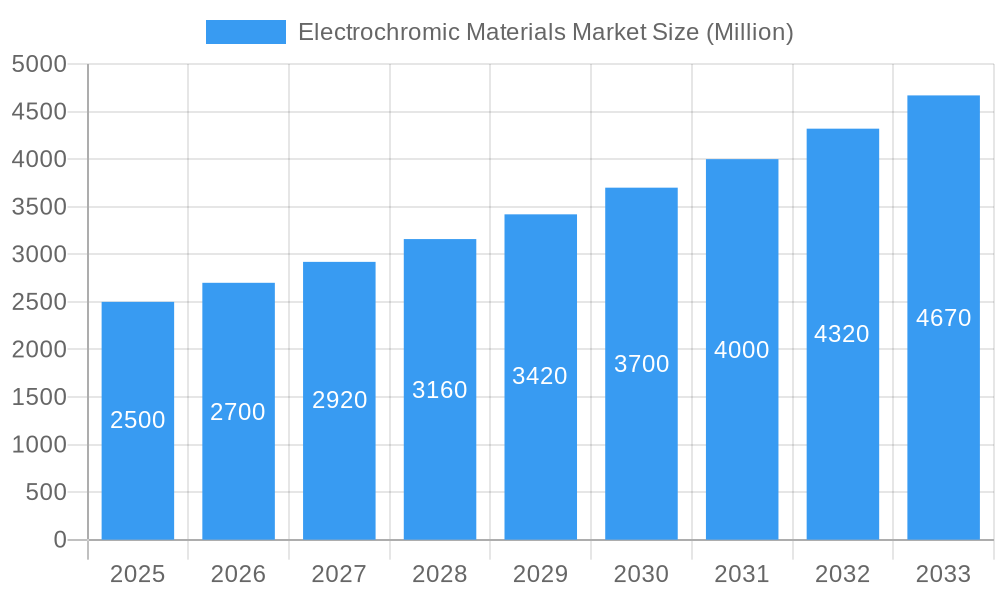
The electrochromic materials market is experiencing robust growth, projected to maintain a CAGR exceeding 8% from 2025 to 2033. This expansion is driven by increasing demand for energy-efficient smart windows and displays across various sectors, including automotive, construction, and consumer electronics. The rising adoption of sustainable building practices and the growing need for dynamic light control are key factors contributing to market growth. Technological advancements, such as the development of improved electrochromic materials with enhanced performance and durability, are further fueling this expansion. Major players like Saint-Gobain, Gentex Corporation, and others are investing heavily in research and development, resulting in innovative products with wider applications. The market is segmented based on material type, application, and geography, with significant growth potential across all segments. The automotive sector, particularly in electric vehicles, is a key driver due to the need for improved energy efficiency and enhanced passenger comfort features like automatic dimming. The construction industry's focus on energy-saving solutions is also a major growth catalyst, driving demand for smart windows in commercial and residential buildings. While challenges remain, such as the relatively high initial cost of electrochromic materials, ongoing technological advancements and increasing consumer awareness are paving the way for wider market adoption.
Electrochromic Materials Market Market Size (In Billion)
Despite the positive outlook, the market faces some challenges. The high initial investment costs associated with electrochromic technology can hinder adoption, especially in price-sensitive sectors. Furthermore, the long-term durability and reliability of some electrochromic materials require continuous improvement. However, ongoing research and development efforts are addressing these limitations, focusing on developing more cost-effective and durable solutions. The competitive landscape is characterized by the presence of both established players and emerging companies, leading to innovation and competition in terms of product quality, performance, and pricing. The market is expected to witness increased consolidation as companies strategically acquire or partner with smaller players to expand their market reach and product portfolio. Geographic expansion, particularly into emerging economies with growing infrastructure development, presents a significant opportunity for market growth in the coming years.
Electrochromic Materials Market Company Market Share
Electrochromic Materials Market: A Comprehensive Report (2019-2033)
This in-depth report provides a comprehensive analysis of the Electrochromic Materials market, encompassing market dynamics, growth trends, regional segmentation, product landscape, key players, and future outlook. The study period covers 2019-2033, with 2025 as the base year and estimated year, and a forecast period of 2025-2033. The report utilizes a combination of quantitative data and qualitative insights to offer a holistic understanding of this dynamic market. Parent market analysis includes smart windows and coatings, while child markets delve into specific applications like automotive and architectural. The market size is expected to reach xx Million by 2033.
Electrochromic Materials Market Dynamics & Structure
This section analyzes the market's competitive landscape, technological advancements, regulatory influences, and market trends. The report details market concentration, revealing the market share held by major players. It explores the impact of technological innovation, including advancements in materials science and manufacturing processes, on market growth. The influence of regulatory frameworks on market expansion is also examined, considering factors like building codes and energy efficiency standards. Furthermore, the report investigates the presence of competitive product substitutes and their impact on market dynamics. It also looks into the end-user demographics shaping market demand and M&A activities within the industry, analyzing their volume and impact on market consolidation. Quantitative data such as market share percentages and M&A deal volumes are presented alongside qualitative factors like innovation barriers to offer a complete understanding of market structure.
- Market Concentration: High (xx%), with key players controlling a significant share.
- Technological Innovation: Driving growth through improved efficiency and performance.
- Regulatory Frameworks: Impacting adoption rates in key regions through building codes and energy policies.
- Competitive Substitutes: Limited, with electrochromic materials offering unique advantages.
- M&A Activity: Moderate (xx deals in the last 5 years), leading to market consolidation.
- Innovation Barriers: High R&D costs and complex manufacturing processes.
Electrochromic Materials Market Growth Trends & Insights
Leveraging both primary and secondary research, this section provides a detailed analysis of market size evolution, adoption rates, technological disruptions, and consumer behavior shifts impacting the electrochromic materials market. The report presents historical data (2019-2024), estimated current data (2025), and forecasts (2025-2033). Key performance indicators like the Compound Annual Growth Rate (CAGR) and market penetration are utilized to provide quantifiable insights into the market’s trajectory. The influence of disruptive technologies and changing consumer preferences on market growth is thoroughly discussed.
- CAGR (2025-2033): xx%
- Market Penetration (2025): xx% in target segments.
- Technological Disruptions: Advancements in nanomaterials and smart coatings are driving innovation.
- Consumer Behavior Shifts: Increasing demand for energy-efficient and smart building technologies.
Dominant Regions, Countries, or Segments in Electrochromic Materials Market
This section identifies the leading regions, countries, and segments driving the electrochromic materials market growth. The report delves into the factors contributing to their dominance, including market share, growth potential, economic policies, and infrastructure development. The analysis considers both quantitative data (market share) and qualitative factors (e.g., government incentives).
- Leading Region: North America/Europe (depending on data)
- Key Drivers (North America): Strong demand from the automotive and construction sectors, favorable government policies.
- Key Drivers (Europe): Focus on sustainable building technologies and energy efficiency.
- Key Drivers (Asia-Pacific): Rapid urbanization and growing infrastructure development.
Electrochromic Materials Market Product Landscape
This section details the product innovations, applications, and performance metrics of electrochromic materials. It highlights unique selling propositions, technological advancements, and the diverse applications across various sectors.
Electrochromic materials offer advancements in smart windows, dimming capabilities, and energy efficiency. Their applications extend to automotive, architectural, and consumer electronics sectors, providing functionalities like light control and glare reduction. The ongoing development of these materials focuses on improved durability, color rendering, and cost-effectiveness.
Key Drivers, Barriers & Challenges in Electrochromic Materials Market
This section identifies the key drivers and challenges influencing the market's growth trajectory. Drivers include technological advancements, economic factors, and supportive government policies. Challenges comprise supply chain constraints, regulatory hurdles, and competitive pressures. Quantifiable impacts of these factors are presented where possible.
Key Drivers:
- Increasing demand for energy-efficient buildings.
- Technological advancements leading to improved performance and cost reductions.
- Government initiatives promoting the adoption of smart building technologies.
Key Challenges:
- High initial investment costs for manufacturing and installation.
- Limited availability of specialized raw materials, potentially affecting supply chains.
- Stringent regulatory requirements and certifications, creating barriers to entry for some players.
Emerging Opportunities in Electrochromic Materials Market
This section identifies emerging opportunities, focusing on untapped markets, innovative applications, and evolving consumer preferences.
- Integration into wearable technology.
- Expansion into emerging markets with strong infrastructure growth.
- Development of cost-effective manufacturing processes to broaden accessibility.
Growth Accelerators in the Electrochromic Materials Market Industry
Technological breakthroughs, strategic partnerships, and market expansion strategies are highlighted as key catalysts driving long-term growth.
The market's expansion is fueled by continuous innovation in materials science and manufacturing processes, leading to improved performance and reduced costs. Strategic collaborations among industry players are further boosting market growth, fostering technology transfer and expanding market reach.
Key Players Shaping the Electrochromic Materials Market Market
- Changzhou Yapu Smart Variable Color Optics
- ChromoGenics
- EControl-Glas GmbH & Co KG
- GENTEX CORPORATION
- Hitachi Chemical Co Ltd
- Nikon Corporation
- Ningbo Miro Electronic Technology
- Ricoh
- Saint-Gobain
- View Inc
- Zhuhai Kaivo Optoelectronic Technology
- Zhuzhou Kibing Group
Notable Milestones in Electrochromic Materials Market Sector
- 2020: Launch of a new generation of electrochromic glass with enhanced performance.
- 2022: Strategic partnership between two major players to expand market reach.
- 2023: Significant investment in R&D to improve production efficiency.
- (Add more milestones as needed based on available data)
In-Depth Electrochromic Materials Market Market Outlook
The electrochromic materials market is poised for significant growth in the coming years. Continued technological advancements, increasing demand for energy-efficient solutions, and supportive government policies are expected to drive market expansion. Strategic investments in R&D and collaborations among industry players will further contribute to market growth. The future outlook is highly positive, with considerable potential for expansion across various applications and regions.
Electrochromic Materials Market Segmentation
-
1. Product Type
- 1.1. Viologens
- 1.2. Conducting Polymers
- 1.3. Metal Oxides
- 1.4. Prussian Blue
- 1.5. Other Product Types
-
2. End-user Industry
- 2.1. Automotive
- 2.2. Electrical and Electronics
- 2.3. Building and Construction
- 2.4. Aerospace and Defense
- 2.5. Other End-user Industries
Electrochromic Materials Market Segmentation By Geography
-
1. Asia Pacific
- 1.1. China
- 1.2. India
- 1.3. Japan
- 1.4. South Korea
- 1.5. Rest of Asia Pacific
-
2. North America
- 2.1. United States
- 2.2. Canada
- 2.3. Mexico
-
3. Europe
- 3.1. Germany
- 3.2. United Kingdom
- 3.3. Italy
- 3.4. France
- 3.5. Rest of Europe
-
4. South America
- 4.1. Brazil
- 4.2. Argentina
- 4.3. Rest of South America
-
5. Middle East and Africa
- 5.1. Saudi Arabia
- 5.2. South Africa
- 5.3. Rest of Middle East and Africa

Electrochromic Materials Market Regional Market Share
Geographic Coverage of Electrochromic Materials Market
Electrochromic Materials Market REPORT HIGHLIGHTS
| Aspects | Details |
|---|---|
| Study Period | 2020-2034 |
| Base Year | 2025 |
| Estimated Year | 2026 |
| Forecast Period | 2026-2034 |
| Historical Period | 2020-2025 |
| Growth Rate | CAGR of 10.5% from 2020-2034 |
| Segmentation |
|
Table of Contents
- 1. Introduction
- 1.1. Research Scope
- 1.2. Market Segmentation
- 1.3. Research Objective
- 1.4. Definitions and Assumptions
- 2. Executive Summary
- 2.1. Market Snapshot
- 3. Market Dynamics
- 3.1. Market Drivers
- 3.2. Market Restrains
- 3.3. Market Trends
- 3.4. Market Opportunities
- 4. Market Factor Analysis
- 4.1. Porters Five Forces
- 4.1.1. Bargaining Power of Suppliers
- 4.1.2. Bargaining Power of Buyers
- 4.1.3. Threat of New Entrants
- 4.1.4. Threat of Substitutes
- 4.1.5. Competitive Rivalry
- 4.2. PESTEL analysis
- 4.3. BCG Analysis
- 4.3.1. Stars (High Growth, High Market Share)
- 4.3.2. Cash Cows (Low Growth, High Market Share)
- 4.3.3. Question Mark (High Growth, Low Market Share)
- 4.3.4. Dogs (Low Growth, Low Market Share)
- 4.4. Ansoff Matrix Analysis
- 4.5. Supply Chain Analysis
- 4.6. Regulatory Landscape
- 4.7. Current Market Potential and Opportunity Assessment (TAM–SAM–SOM Framework)
- 4.8. NRP Analyst Note
- 4.1. Porters Five Forces
- 5. Market Analysis, Insights and Forecast 2021-2033
- 5.1. Market Analysis, Insights and Forecast - by Product Type
- 5.1.1. Viologens
- 5.1.2. Conducting Polymers
- 5.1.3. Metal Oxides
- 5.1.4. Prussian Blue
- 5.1.5. Other Product Types
- 5.2. Market Analysis, Insights and Forecast - by End-user Industry
- 5.2.1. Automotive
- 5.2.2. Electrical and Electronics
- 5.2.3. Building and Construction
- 5.2.4. Aerospace and Defense
- 5.2.5. Other End-user Industries
- 5.3. Market Analysis, Insights and Forecast - by Region
- 5.3.1. Asia Pacific
- 5.3.2. North America
- 5.3.3. Europe
- 5.3.4. South America
- 5.3.5. Middle East and Africa
- 5.1. Market Analysis, Insights and Forecast - by Product Type
- 6. Global Electrochromic Materials Market Analysis, Insights and Forecast, 2021-2033
- 6.1. Market Analysis, Insights and Forecast - by Product Type
- 6.1.1. Viologens
- 6.1.2. Conducting Polymers
- 6.1.3. Metal Oxides
- 6.1.4. Prussian Blue
- 6.1.5. Other Product Types
- 6.2. Market Analysis, Insights and Forecast - by End-user Industry
- 6.2.1. Automotive
- 6.2.2. Electrical and Electronics
- 6.2.3. Building and Construction
- 6.2.4. Aerospace and Defense
- 6.2.5. Other End-user Industries
- 6.1. Market Analysis, Insights and Forecast - by Product Type
- 7. Asia Pacific Electrochromic Materials Market Analysis, Insights and Forecast, 2020-2032
- 7.1. Market Analysis, Insights and Forecast - by Product Type
- 7.1.1. Viologens
- 7.1.2. Conducting Polymers
- 7.1.3. Metal Oxides
- 7.1.4. Prussian Blue
- 7.1.5. Other Product Types
- 7.2. Market Analysis, Insights and Forecast - by End-user Industry
- 7.2.1. Automotive
- 7.2.2. Electrical and Electronics
- 7.2.3. Building and Construction
- 7.2.4. Aerospace and Defense
- 7.2.5. Other End-user Industries
- 7.1. Market Analysis, Insights and Forecast - by Product Type
- 8. North America Electrochromic Materials Market Analysis, Insights and Forecast, 2020-2032
- 8.1. Market Analysis, Insights and Forecast - by Product Type
- 8.1.1. Viologens
- 8.1.2. Conducting Polymers
- 8.1.3. Metal Oxides
- 8.1.4. Prussian Blue
- 8.1.5. Other Product Types
- 8.2. Market Analysis, Insights and Forecast - by End-user Industry
- 8.2.1. Automotive
- 8.2.2. Electrical and Electronics
- 8.2.3. Building and Construction
- 8.2.4. Aerospace and Defense
- 8.2.5. Other End-user Industries
- 8.1. Market Analysis, Insights and Forecast - by Product Type
- 9. Europe Electrochromic Materials Market Analysis, Insights and Forecast, 2020-2032
- 9.1. Market Analysis, Insights and Forecast - by Product Type
- 9.1.1. Viologens
- 9.1.2. Conducting Polymers
- 9.1.3. Metal Oxides
- 9.1.4. Prussian Blue
- 9.1.5. Other Product Types
- 9.2. Market Analysis, Insights and Forecast - by End-user Industry
- 9.2.1. Automotive
- 9.2.2. Electrical and Electronics
- 9.2.3. Building and Construction
- 9.2.4. Aerospace and Defense
- 9.2.5. Other End-user Industries
- 9.1. Market Analysis, Insights and Forecast - by Product Type
- 10. South America Electrochromic Materials Market Analysis, Insights and Forecast, 2020-2032
- 10.1. Market Analysis, Insights and Forecast - by Product Type
- 10.1.1. Viologens
- 10.1.2. Conducting Polymers
- 10.1.3. Metal Oxides
- 10.1.4. Prussian Blue
- 10.1.5. Other Product Types
- 10.2. Market Analysis, Insights and Forecast - by End-user Industry
- 10.2.1. Automotive
- 10.2.2. Electrical and Electronics
- 10.2.3. Building and Construction
- 10.2.4. Aerospace and Defense
- 10.2.5. Other End-user Industries
- 10.1. Market Analysis, Insights and Forecast - by Product Type
- 11. Middle East and Africa Electrochromic Materials Market Analysis, Insights and Forecast, 2020-2032
- 11.1. Market Analysis, Insights and Forecast - by Product Type
- 11.1.1. Viologens
- 11.1.2. Conducting Polymers
- 11.1.3. Metal Oxides
- 11.1.4. Prussian Blue
- 11.1.5. Other Product Types
- 11.2. Market Analysis, Insights and Forecast - by End-user Industry
- 11.2.1. Automotive
- 11.2.2. Electrical and Electronics
- 11.2.3. Building and Construction
- 11.2.4. Aerospace and Defense
- 11.2.5. Other End-user Industries
- 11.1. Market Analysis, Insights and Forecast - by Product Type
- 12. Competitive Analysis
- 12.1. Company Profiles
- 12.1.1 Changzhou Yapu Smart Variable Color Optics
- 12.1.1.1. Company Overview
- 12.1.1.2. Products
- 12.1.1.3. Company Financials
- 12.1.1.4. SWOT Analysis
- 12.1.2 ChromoGenics
- 12.1.2.1. Company Overview
- 12.1.2.2. Products
- 12.1.2.3. Company Financials
- 12.1.2.4. SWOT Analysis
- 12.1.3 EControl-Glas GmbH & Co KG
- 12.1.3.1. Company Overview
- 12.1.3.2. Products
- 12.1.3.3. Company Financials
- 12.1.3.4. SWOT Analysis
- 12.1.4 GENTEX CORPORATION
- 12.1.4.1. Company Overview
- 12.1.4.2. Products
- 12.1.4.3. Company Financials
- 12.1.4.4. SWOT Analysis
- 12.1.5 Hitachi Chemical Co Ltd
- 12.1.5.1. Company Overview
- 12.1.5.2. Products
- 12.1.5.3. Company Financials
- 12.1.5.4. SWOT Analysis
- 12.1.6 Nikon Corporation
- 12.1.6.1. Company Overview
- 12.1.6.2. Products
- 12.1.6.3. Company Financials
- 12.1.6.4. SWOT Analysis
- 12.1.7 Ningbo Miro Electronic Technology
- 12.1.7.1. Company Overview
- 12.1.7.2. Products
- 12.1.7.3. Company Financials
- 12.1.7.4. SWOT Analysis
- 12.1.8 Ricoh
- 12.1.8.1. Company Overview
- 12.1.8.2. Products
- 12.1.8.3. Company Financials
- 12.1.8.4. SWOT Analysis
- 12.1.9 Saint-Gobain
- 12.1.9.1. Company Overview
- 12.1.9.2. Products
- 12.1.9.3. Company Financials
- 12.1.9.4. SWOT Analysis
- 12.1.10 View Inc
- 12.1.10.1. Company Overview
- 12.1.10.2. Products
- 12.1.10.3. Company Financials
- 12.1.10.4. SWOT Analysis
- 12.1.11 Zhuhai Kaivo Optoelectronic Technology
- 12.1.11.1. Company Overview
- 12.1.11.2. Products
- 12.1.11.3. Company Financials
- 12.1.11.4. SWOT Analysis
- 12.1.12 Zhuzhou Kibing Group*List Not Exhaustive
- 12.1.12.1. Company Overview
- 12.1.12.2. Products
- 12.1.12.3. Company Financials
- 12.1.12.4. SWOT Analysis
- 12.1.1 Changzhou Yapu Smart Variable Color Optics
- 12.2. Market Entropy
- 12.2.1 Company's Key Areas Served
- 12.2.2 Recent Developments
- 12.3. Company Market Share Analysis 2025
- 12.3.1 Top 5 Companies Market Share Analysis
- 12.3.2 Top 3 Companies Market Share Analysis
- 12.4. List of Potential Customers
- 13. Research Methodology
List of Figures
- Figure 1: Global Electrochromic Materials Market Revenue Breakdown (billion, %) by Region 2025 & 2033
- Figure 2: Asia Pacific Electrochromic Materials Market Revenue (billion), by Product Type 2025 & 2033
- Figure 3: Asia Pacific Electrochromic Materials Market Revenue Share (%), by Product Type 2025 & 2033
- Figure 4: Asia Pacific Electrochromic Materials Market Revenue (billion), by End-user Industry 2025 & 2033
- Figure 5: Asia Pacific Electrochromic Materials Market Revenue Share (%), by End-user Industry 2025 & 2033
- Figure 6: Asia Pacific Electrochromic Materials Market Revenue (billion), by Country 2025 & 2033
- Figure 7: Asia Pacific Electrochromic Materials Market Revenue Share (%), by Country 2025 & 2033
- Figure 8: North America Electrochromic Materials Market Revenue (billion), by Product Type 2025 & 2033
- Figure 9: North America Electrochromic Materials Market Revenue Share (%), by Product Type 2025 & 2033
- Figure 10: North America Electrochromic Materials Market Revenue (billion), by End-user Industry 2025 & 2033
- Figure 11: North America Electrochromic Materials Market Revenue Share (%), by End-user Industry 2025 & 2033
- Figure 12: North America Electrochromic Materials Market Revenue (billion), by Country 2025 & 2033
- Figure 13: North America Electrochromic Materials Market Revenue Share (%), by Country 2025 & 2033
- Figure 14: Europe Electrochromic Materials Market Revenue (billion), by Product Type 2025 & 2033
- Figure 15: Europe Electrochromic Materials Market Revenue Share (%), by Product Type 2025 & 2033
- Figure 16: Europe Electrochromic Materials Market Revenue (billion), by End-user Industry 2025 & 2033
- Figure 17: Europe Electrochromic Materials Market Revenue Share (%), by End-user Industry 2025 & 2033
- Figure 18: Europe Electrochromic Materials Market Revenue (billion), by Country 2025 & 2033
- Figure 19: Europe Electrochromic Materials Market Revenue Share (%), by Country 2025 & 2033
- Figure 20: South America Electrochromic Materials Market Revenue (billion), by Product Type 2025 & 2033
- Figure 21: South America Electrochromic Materials Market Revenue Share (%), by Product Type 2025 & 2033
- Figure 22: South America Electrochromic Materials Market Revenue (billion), by End-user Industry 2025 & 2033
- Figure 23: South America Electrochromic Materials Market Revenue Share (%), by End-user Industry 2025 & 2033
- Figure 24: South America Electrochromic Materials Market Revenue (billion), by Country 2025 & 2033
- Figure 25: South America Electrochromic Materials Market Revenue Share (%), by Country 2025 & 2033
- Figure 26: Middle East and Africa Electrochromic Materials Market Revenue (billion), by Product Type 2025 & 2033
- Figure 27: Middle East and Africa Electrochromic Materials Market Revenue Share (%), by Product Type 2025 & 2033
- Figure 28: Middle East and Africa Electrochromic Materials Market Revenue (billion), by End-user Industry 2025 & 2033
- Figure 29: Middle East and Africa Electrochromic Materials Market Revenue Share (%), by End-user Industry 2025 & 2033
- Figure 30: Middle East and Africa Electrochromic Materials Market Revenue (billion), by Country 2025 & 2033
- Figure 31: Middle East and Africa Electrochromic Materials Market Revenue Share (%), by Country 2025 & 2033
List of Tables
- Table 1: Global Electrochromic Materials Market Revenue billion Forecast, by Product Type 2020 & 2033
- Table 2: Global Electrochromic Materials Market Revenue billion Forecast, by End-user Industry 2020 & 2033
- Table 3: Global Electrochromic Materials Market Revenue billion Forecast, by Region 2020 & 2033
- Table 4: Global Electrochromic Materials Market Revenue billion Forecast, by Product Type 2020 & 2033
- Table 5: Global Electrochromic Materials Market Revenue billion Forecast, by End-user Industry 2020 & 2033
- Table 6: Global Electrochromic Materials Market Revenue billion Forecast, by Country 2020 & 2033
- Table 7: China Electrochromic Materials Market Revenue (billion) Forecast, by Application 2020 & 2033
- Table 8: India Electrochromic Materials Market Revenue (billion) Forecast, by Application 2020 & 2033
- Table 9: Japan Electrochromic Materials Market Revenue (billion) Forecast, by Application 2020 & 2033
- Table 10: South Korea Electrochromic Materials Market Revenue (billion) Forecast, by Application 2020 & 2033
- Table 11: Rest of Asia Pacific Electrochromic Materials Market Revenue (billion) Forecast, by Application 2020 & 2033
- Table 12: Global Electrochromic Materials Market Revenue billion Forecast, by Product Type 2020 & 2033
- Table 13: Global Electrochromic Materials Market Revenue billion Forecast, by End-user Industry 2020 & 2033
- Table 14: Global Electrochromic Materials Market Revenue billion Forecast, by Country 2020 & 2033
- Table 15: United States Electrochromic Materials Market Revenue (billion) Forecast, by Application 2020 & 2033
- Table 16: Canada Electrochromic Materials Market Revenue (billion) Forecast, by Application 2020 & 2033
- Table 17: Mexico Electrochromic Materials Market Revenue (billion) Forecast, by Application 2020 & 2033
- Table 18: Global Electrochromic Materials Market Revenue billion Forecast, by Product Type 2020 & 2033
- Table 19: Global Electrochromic Materials Market Revenue billion Forecast, by End-user Industry 2020 & 2033
- Table 20: Global Electrochromic Materials Market Revenue billion Forecast, by Country 2020 & 2033
- Table 21: Germany Electrochromic Materials Market Revenue (billion) Forecast, by Application 2020 & 2033
- Table 22: United Kingdom Electrochromic Materials Market Revenue (billion) Forecast, by Application 2020 & 2033
- Table 23: Italy Electrochromic Materials Market Revenue (billion) Forecast, by Application 2020 & 2033
- Table 24: France Electrochromic Materials Market Revenue (billion) Forecast, by Application 2020 & 2033
- Table 25: Rest of Europe Electrochromic Materials Market Revenue (billion) Forecast, by Application 2020 & 2033
- Table 26: Global Electrochromic Materials Market Revenue billion Forecast, by Product Type 2020 & 2033
- Table 27: Global Electrochromic Materials Market Revenue billion Forecast, by End-user Industry 2020 & 2033
- Table 28: Global Electrochromic Materials Market Revenue billion Forecast, by Country 2020 & 2033
- Table 29: Brazil Electrochromic Materials Market Revenue (billion) Forecast, by Application 2020 & 2033
- Table 30: Argentina Electrochromic Materials Market Revenue (billion) Forecast, by Application 2020 & 2033
- Table 31: Rest of South America Electrochromic Materials Market Revenue (billion) Forecast, by Application 2020 & 2033
- Table 32: Global Electrochromic Materials Market Revenue billion Forecast, by Product Type 2020 & 2033
- Table 33: Global Electrochromic Materials Market Revenue billion Forecast, by End-user Industry 2020 & 2033
- Table 34: Global Electrochromic Materials Market Revenue billion Forecast, by Country 2020 & 2033
- Table 35: Saudi Arabia Electrochromic Materials Market Revenue (billion) Forecast, by Application 2020 & 2033
- Table 36: South Africa Electrochromic Materials Market Revenue (billion) Forecast, by Application 2020 & 2033
- Table 37: Rest of Middle East and Africa Electrochromic Materials Market Revenue (billion) Forecast, by Application 2020 & 2033
Frequently Asked Questions
1. What is the projected Compound Annual Growth Rate (CAGR) of the Electrochromic Materials Market?
The projected CAGR is approximately 10.5%.
2. Which companies are prominent players in the Electrochromic Materials Market?
Key companies in the market include Changzhou Yapu Smart Variable Color Optics, ChromoGenics, EControl-Glas GmbH & Co KG, GENTEX CORPORATION, Hitachi Chemical Co Ltd, Nikon Corporation, Ningbo Miro Electronic Technology, Ricoh, Saint-Gobain, View Inc, Zhuhai Kaivo Optoelectronic Technology, Zhuzhou Kibing Group*List Not Exhaustive.
3. What are the main segments of the Electrochromic Materials Market?
The market segments include Product Type, End-user Industry.
4. Can you provide details about the market size?
The market size is estimated to be USD 2.3 billion as of 2022.
5. What are some drivers contributing to market growth?
; Growing demand from Aerospace & Consumer Electronics; Increased Defense Spending by the Government of United States.
6. What are the notable trends driving market growth?
Increasing Usage in the Automotive Industry.
7. Are there any restraints impacting market growth?
; Growing demand from Aerospace & Consumer Electronics; Increased Defense Spending by the Government of United States.
8. Can you provide examples of recent developments in the market?
N/A
9. What pricing options are available for accessing the report?
Pricing options include single-user, multi-user, and enterprise licenses priced at USD 4750, USD 5250, and USD 8750 respectively.
10. Is the market size provided in terms of value or volume?
The market size is provided in terms of value, measured in billion.
11. Are there any specific market keywords associated with the report?
Yes, the market keyword associated with the report is "Electrochromic Materials Market," which aids in identifying and referencing the specific market segment covered.
12. How do I determine which pricing option suits my needs best?
The pricing options vary based on user requirements and access needs. Individual users may opt for single-user licenses, while businesses requiring broader access may choose multi-user or enterprise licenses for cost-effective access to the report.
13. Are there any additional resources or data provided in the Electrochromic Materials Market report?
While the report offers comprehensive insights, it's advisable to review the specific contents or supplementary materials provided to ascertain if additional resources or data are available.
14. How can I stay updated on further developments or reports in the Electrochromic Materials Market?
To stay informed about further developments, trends, and reports in the Electrochromic Materials Market, consider subscribing to industry newsletters, following relevant companies and organizations, or regularly checking reputable industry news sources and publications.
Methodology
Step 1 - Identification of Relevant Samples Size from Population Database


Step 2 - Approaches for Defining Global Market Size (Value, Volume* & Price*)

Note*: In applicable scenarios
Step 3 - Data Sources
Primary Research
- Web Analytics
- Survey Reports
- Research Institute
- Latest Research Reports
- Opinion Leaders
Secondary Research
- Annual Reports
- White Paper
- Latest Press Release
- Industry Association
- Paid Database
- Investor Presentations

Step 4 - Data Triangulation
Involves using different sources of information in order to increase the validity of a study
These sources are likely to be stakeholders in a program - participants, other researchers, program staff, other community members, and so on.
Then we put all data in single framework & apply various statistical tools to find out the dynamic on the market.
During the analysis stage, feedback from the stakeholder groups would be compared to determine areas of agreement as well as areas of divergence