

Key Insights
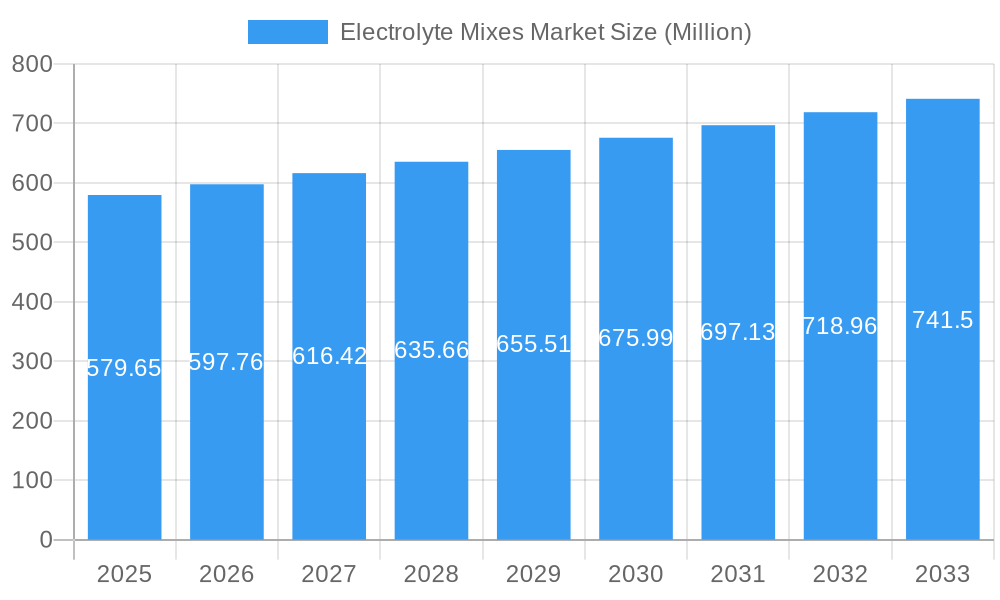
The global electrolyte mixes market, valued at $579.65 million in 2025, is projected to experience steady growth, driven by increasing health consciousness, rising participation in sports and fitness activities, and a growing preference for convenient hydration solutions. The market's Compound Annual Growth Rate (CAGR) of 2.81% from 2025 to 2033 indicates a consistent expansion, albeit moderate, suggesting a mature yet evolving market landscape. Key growth drivers include the rising prevalence of dehydration-related illnesses, particularly among athletes and individuals engaging in strenuous physical activities. The increasing awareness of electrolyte replenishment's importance for optimal physical performance and overall well-being fuels demand across various product types, including ready-to-drink (RTD) beverages, electrolyte powders, and tablets. Different distribution channels, including supermarkets, convenience stores, pharmacies, and online retailers, cater to diverse consumer preferences and purchasing habits. While the market enjoys a broad reach, factors like fluctuating raw material prices and intense competition among established players could pose challenges to sustained growth.
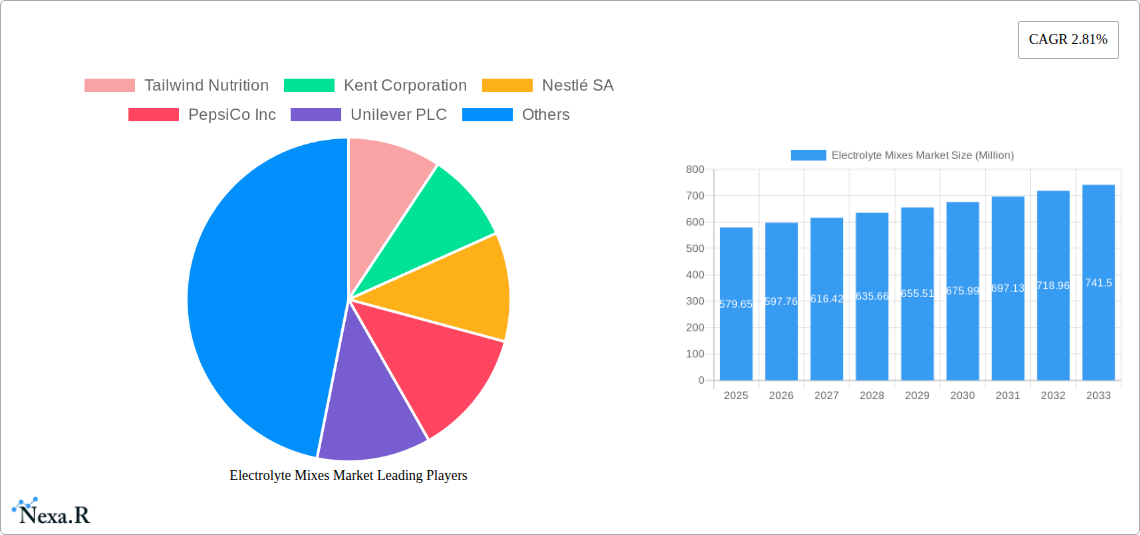
Electrolyte Mixes Market Market Size (In Million)
Market segmentation reveals significant opportunities. The flavored segment likely dominates due to enhanced palatability, appealing to a wider consumer base. Among distribution channels, supermarkets and hypermarkets hold a significant share, reflecting their accessibility and extensive reach. RTD beverages likely constitute the largest product type segment due to convenience and immediate consumption. Regional analysis suggests North America and Europe hold substantial market shares, driven by high health awareness and disposable incomes. However, emerging economies in Asia-Pacific and South America present significant growth potential as consumer awareness and purchasing power increase. Leading players like Tailwind Nutrition, Nestlé, and PepsiCo leverage their established brands and distribution networks to maintain market leadership, while smaller companies focus on niche segments and innovation to gain a foothold. Future growth will likely be shaped by product innovation, including functional formulations with added vitamins and minerals, and strategic expansion into new markets.
Electrolyte Mixes Market Company Market Share
Electrolyte Mixes Market: A Comprehensive Report (2019-2033)
This comprehensive report provides a detailed analysis of the Electrolyte Mixes Market, encompassing market dynamics, growth trends, regional insights, product landscape, key players, and future outlook. The study period covers 2019-2033, with 2025 as the base year and a forecast period of 2025-2033. The report delves into the parent market of Beverage and the child market of Sports Nutrition, providing a granular understanding of this dynamic sector. The market size is projected to reach xx Million units by 2033.
Electrolyte Mixes Market Market Dynamics & Structure
The electrolyte mixes market is characterized by moderate concentration, with key players holding significant market share, but also significant presence of smaller niche players. Technological innovation, particularly in formulation and delivery systems (e.g., sustained-release electrolytes), is a major driver. Regulatory frameworks regarding labeling and health claims vary across regions, impacting market access and growth. Competitive substitutes include plain water, fruit juices, and energy drinks. The end-user demographic is broad, encompassing athletes, individuals with active lifestyles, and those seeking improved hydration. The market has witnessed several mergers and acquisitions (M&A) in recent years, reflecting consolidation and expansion strategies.
- Market Concentration: Moderately concentrated, with top 5 players holding approximately xx% market share in 2024.
- Technological Innovation: Focus on enhanced absorption rates, novel flavor profiles, and convenient packaging formats.
- Regulatory Landscape: Varying regulations across geographies influence product labeling and marketing claims.
- Competitive Substitutes: Water, fruit juices, and energy drinks pose competition.
- End-User Demographics: Athletes, fitness enthusiasts, and health-conscious consumers.
- M&A Activity: xx major M&A deals observed between 2019 and 2024.
Electrolyte Mixes Market Growth Trends & Insights
The global electrolyte mixes market experienced robust growth during the historical period (2019-2024), driven by rising health consciousness, increasing participation in sports and fitness activities, and the growing popularity of convenient hydration solutions. The market is expected to maintain a healthy CAGR of xx% during the forecast period (2025-2033). Technological advancements, including the introduction of innovative formulations and delivery systems, are further accelerating market growth. Shifts in consumer preferences toward natural and functional ingredients are also influencing product development. Market penetration in emerging economies is expected to increase significantly.
Dominant Regions, Countries, or Segments in Electrolyte Mixes Market
North America currently dominates the electrolyte mixes market, driven by high consumer awareness, strong demand from sports and fitness enthusiasts, and the presence of major market players. However, Asia-Pacific is poised for significant growth due to rising disposable incomes and increased health consciousness. Within product types, RTD beverages hold the largest market share, followed by electrolyte powders. Supermarkets/hypermarkets represent the leading distribution channel, with online retail experiencing rapid expansion. Flavored electrolyte mixes maintain a larger share compared to unflavored options due to heightened consumer appeal.
- Key Drivers for North America: High disposable income, strong fitness culture, extensive distribution networks.
- Asia-Pacific Growth Potential: Rising health consciousness, expanding middle class, increasing participation in sports.
- Product Type Dominance: RTD Beverages (xx Million units), followed by Electrolyte Powders (xx Million units).
- Distribution Channel Leadership: Supermarkets/Hypermarkets (xx% market share).
- Flavor Preference: Flavored Electrolyte Mixes (xx% market share).
Electrolyte Mixes Market Product Landscape
The electrolyte mixes market showcases a diverse product landscape, ranging from ready-to-drink (RTD) beverages to powders and tablets. Product innovation centers on enhanced flavor profiles, improved solubility, convenient packaging, and functional benefits beyond hydration (e.g., added vitamins or minerals). Unique selling propositions focus on rapid hydration, improved performance, and natural ingredients. Technological advancements in formulation and packaging are key to maintaining a competitive edge.
Key Drivers, Barriers & Challenges in Electrolyte Mixes Market
Key Drivers:
- Rising health and wellness awareness.
- Increasing participation in sports and fitness activities.
- Growing demand for convenient and functional beverages.
Challenges:
- Intense competition from established beverage brands.
- Price sensitivity among consumers.
- Fluctuations in raw material costs.
- Potential regulatory changes impacting product labeling and marketing claims.
Emerging Opportunities in Electrolyte Mixes Market
Untapped markets in developing economies, the growing demand for personalized hydration solutions, and the emergence of electrolyte mixes with added functional benefits (e.g., probiotics, antioxidants) represent significant growth opportunities. The development of sustainable and eco-friendly packaging solutions also presents a key avenue for differentiation. Expansion into niche segments, such as electrolyte mixes tailored for specific age groups or health conditions, also presents promising potential.
Growth Accelerators in the Electrolyte Mixes Market Industry
Technological breakthroughs in formulation and delivery systems, strategic partnerships between beverage companies and sports nutrition brands, and effective marketing campaigns targeting health-conscious consumers are key growth accelerators. Expansion into emerging markets and diversification of product offerings to cater to evolving consumer preferences are also expected to significantly drive market expansion.
Key Players Shaping the Electrolyte Mixes Market Market
- Tailwind Nutrition
- Kent Corporation
- Nestlé SA
- PepsiCo Inc
- Unilever PLC
- Abbott Laboratories
- LyteLine LLC
- Otsuka Holdings Co Ltd
- Vitalyte Sports Nutrition Inc
- Ultima Health Products Inc
Notable Milestones in Electrolyte Mixes Market Sector
- JUL 2021: Nestlé Health Science acquired Nuun, expanding its functional hydration portfolio.
- MAR 2022: Gatorade Canada partnered with Canada Soccer, strengthening its market position.
- MAY 2022: Liquid IV launched Hydration Multiplier+ Powdered Probiotic Kombucha, introducing a new product category.
In-Depth Electrolyte Mixes Market Market Outlook
The electrolyte mixes market is poised for continued growth, driven by favorable demographic trends, rising health consciousness, and ongoing product innovation. Strategic partnerships, expansion into emerging markets, and the development of innovative products with enhanced functional benefits will be crucial for sustained success. The market presents significant opportunities for established players and new entrants alike, making it a dynamic and attractive sector for investment.
Electrolyte Mixes Market Segmentation
-
1. Product Type
- 1.1. RTD Beverages
- 1.2. Electrolyte Powders
- 1.3. Tablets
-
2. Flavor
- 2.1. Flavored
- 2.2. Unflavored
-
3. Distribution Channel
- 3.1. Supermarkets/Hypermarkets
- 3.2. Convenience Stores
- 3.3. Pharmacies/Drug Stores
- 3.4. Online Retail Stores
- 3.5. Other Distribution Channels
Electrolyte Mixes Market Segmentation By Geography
-
1. North America
- 1.1. United States
- 1.2. Canada
- 1.3. Mexico
- 1.4. Rest of North America
-
2. Europe
- 2.1. United Kingdom
- 2.2. Germany
- 2.3. France
- 2.4. Russia
- 2.5. Italy
- 2.6. Spain
- 2.7. Rest of Europe
-
3. Asia Pacific
- 3.1. China
- 3.2. India
- 3.3. Japan
- 3.4. Australia
- 3.5. Rest of Asia Pacific
-
4. South America
- 4.1. Brazil
- 4.2. Argentina
- 4.3. Rest of South America
-
5. Middle East and Africa
- 5.1. South Africa
- 5.2. United Arab Emirates
- 5.3. Rest of Middle East and Africa
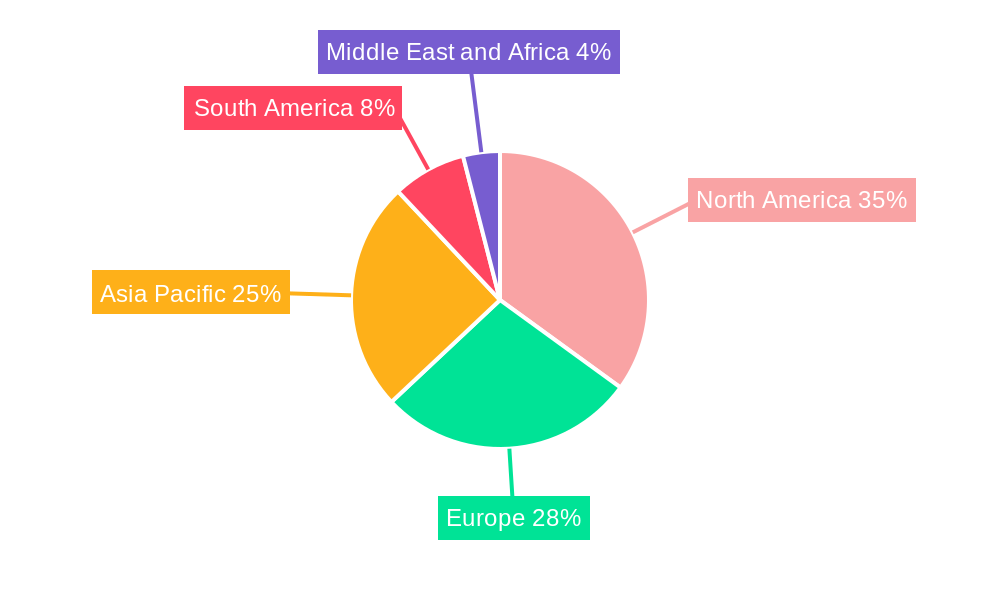
Electrolyte Mixes Market Regional Market Share
Geographic Coverage of Electrolyte Mixes Market
Electrolyte Mixes Market REPORT HIGHLIGHTS
| Aspects | Details |
|---|---|
| Study Period | 2020-2034 |
| Base Year | 2025 |
| Estimated Year | 2026 |
| Forecast Period | 2026-2034 |
| Historical Period | 2020-2025 |
| Growth Rate | CAGR of 2.81% from 2020-2034 |
| Segmentation |
|
Table of Contents
- 1. Introduction
- 1.1. Research Scope
- 1.2. Market Segmentation
- 1.3. Research Objective
- 1.4. Definitions and Assumptions
- 2. Executive Summary
- 2.1. Market Snapshot
- 3. Market Dynamics
- 3.1. Market Drivers
- 3.2. Market Restrains
- 3.3. Market Trends
- 3.4. Market Opportunities
- 4. Market Factor Analysis
- 4.1. Porters Five Forces
- 4.1.1. Bargaining Power of Suppliers
- 4.1.2. Bargaining Power of Buyers
- 4.1.3. Threat of New Entrants
- 4.1.4. Threat of Substitutes
- 4.1.5. Competitive Rivalry
- 4.2. PESTEL analysis
- 4.3. BCG Analysis
- 4.3.1. Stars (High Growth, High Market Share)
- 4.3.2. Cash Cows (Low Growth, High Market Share)
- 4.3.3. Question Mark (High Growth, Low Market Share)
- 4.3.4. Dogs (Low Growth, Low Market Share)
- 4.4. Ansoff Matrix Analysis
- 4.5. Supply Chain Analysis
- 4.6. Regulatory Landscape
- 4.7. Current Market Potential and Opportunity Assessment (TAM–SAM–SOM Framework)
- 4.8. NRP Analyst Note
- 4.1. Porters Five Forces
- 5. Market Analysis, Insights and Forecast 2021-2033
- 5.1. Market Analysis, Insights and Forecast - by Product Type
- 5.1.1. RTD Beverages
- 5.1.2. Electrolyte Powders
- 5.1.3. Tablets
- 5.2. Market Analysis, Insights and Forecast - by Flavor
- 5.2.1. Flavored
- 5.2.2. Unflavored
- 5.3. Market Analysis, Insights and Forecast - by Distribution Channel
- 5.3.1. Supermarkets/Hypermarkets
- 5.3.2. Convenience Stores
- 5.3.3. Pharmacies/Drug Stores
- 5.3.4. Online Retail Stores
- 5.3.5. Other Distribution Channels
- 5.4. Market Analysis, Insights and Forecast - by Region
- 5.4.1. North America
- 5.4.2. Europe
- 5.4.3. Asia Pacific
- 5.4.4. South America
- 5.4.5. Middle East and Africa
- 5.1. Market Analysis, Insights and Forecast - by Product Type
- 6. Global Electrolyte Mixes Market Analysis, Insights and Forecast, 2021-2033
- 6.1. Market Analysis, Insights and Forecast - by Product Type
- 6.1.1. RTD Beverages
- 6.1.2. Electrolyte Powders
- 6.1.3. Tablets
- 6.2. Market Analysis, Insights and Forecast - by Flavor
- 6.2.1. Flavored
- 6.2.2. Unflavored
- 6.3. Market Analysis, Insights and Forecast - by Distribution Channel
- 6.3.1. Supermarkets/Hypermarkets
- 6.3.2. Convenience Stores
- 6.3.3. Pharmacies/Drug Stores
- 6.3.4. Online Retail Stores
- 6.3.5. Other Distribution Channels
- 6.1. Market Analysis, Insights and Forecast - by Product Type
- 7. North America Electrolyte Mixes Market Analysis, Insights and Forecast, 2020-2032
- 7.1. Market Analysis, Insights and Forecast - by Product Type
- 7.1.1. RTD Beverages
- 7.1.2. Electrolyte Powders
- 7.1.3. Tablets
- 7.2. Market Analysis, Insights and Forecast - by Flavor
- 7.2.1. Flavored
- 7.2.2. Unflavored
- 7.3. Market Analysis, Insights and Forecast - by Distribution Channel
- 7.3.1. Supermarkets/Hypermarkets
- 7.3.2. Convenience Stores
- 7.3.3. Pharmacies/Drug Stores
- 7.3.4. Online Retail Stores
- 7.3.5. Other Distribution Channels
- 7.1. Market Analysis, Insights and Forecast - by Product Type
- 8. Europe Electrolyte Mixes Market Analysis, Insights and Forecast, 2020-2032
- 8.1. Market Analysis, Insights and Forecast - by Product Type
- 8.1.1. RTD Beverages
- 8.1.2. Electrolyte Powders
- 8.1.3. Tablets
- 8.2. Market Analysis, Insights and Forecast - by Flavor
- 8.2.1. Flavored
- 8.2.2. Unflavored
- 8.3. Market Analysis, Insights and Forecast - by Distribution Channel
- 8.3.1. Supermarkets/Hypermarkets
- 8.3.2. Convenience Stores
- 8.3.3. Pharmacies/Drug Stores
- 8.3.4. Online Retail Stores
- 8.3.5. Other Distribution Channels
- 8.1. Market Analysis, Insights and Forecast - by Product Type
- 9. Asia Pacific Electrolyte Mixes Market Analysis, Insights and Forecast, 2020-2032
- 9.1. Market Analysis, Insights and Forecast - by Product Type
- 9.1.1. RTD Beverages
- 9.1.2. Electrolyte Powders
- 9.1.3. Tablets
- 9.2. Market Analysis, Insights and Forecast - by Flavor
- 9.2.1. Flavored
- 9.2.2. Unflavored
- 9.3. Market Analysis, Insights and Forecast - by Distribution Channel
- 9.3.1. Supermarkets/Hypermarkets
- 9.3.2. Convenience Stores
- 9.3.3. Pharmacies/Drug Stores
- 9.3.4. Online Retail Stores
- 9.3.5. Other Distribution Channels
- 9.1. Market Analysis, Insights and Forecast - by Product Type
- 10. South America Electrolyte Mixes Market Analysis, Insights and Forecast, 2020-2032
- 10.1. Market Analysis, Insights and Forecast - by Product Type
- 10.1.1. RTD Beverages
- 10.1.2. Electrolyte Powders
- 10.1.3. Tablets
- 10.2. Market Analysis, Insights and Forecast - by Flavor
- 10.2.1. Flavored
- 10.2.2. Unflavored
- 10.3. Market Analysis, Insights and Forecast - by Distribution Channel
- 10.3.1. Supermarkets/Hypermarkets
- 10.3.2. Convenience Stores
- 10.3.3. Pharmacies/Drug Stores
- 10.3.4. Online Retail Stores
- 10.3.5. Other Distribution Channels
- 10.1. Market Analysis, Insights and Forecast - by Product Type
- 11. Middle East and Africa Electrolyte Mixes Market Analysis, Insights and Forecast, 2020-2032
- 11.1. Market Analysis, Insights and Forecast - by Product Type
- 11.1.1. RTD Beverages
- 11.1.2. Electrolyte Powders
- 11.1.3. Tablets
- 11.2. Market Analysis, Insights and Forecast - by Flavor
- 11.2.1. Flavored
- 11.2.2. Unflavored
- 11.3. Market Analysis, Insights and Forecast - by Distribution Channel
- 11.3.1. Supermarkets/Hypermarkets
- 11.3.2. Convenience Stores
- 11.3.3. Pharmacies/Drug Stores
- 11.3.4. Online Retail Stores
- 11.3.5. Other Distribution Channels
- 11.1. Market Analysis, Insights and Forecast - by Product Type
- 12. Competitive Analysis
- 12.1. Company Profiles
- 12.1.1 Tailwind Nutrition
- 12.1.1.1. Company Overview
- 12.1.1.2. Products
- 12.1.1.3. Company Financials
- 12.1.1.4. SWOT Analysis
- 12.1.2 Kent Corporation
- 12.1.2.1. Company Overview
- 12.1.2.2. Products
- 12.1.2.3. Company Financials
- 12.1.2.4. SWOT Analysis
- 12.1.3 Nestlé SA
- 12.1.3.1. Company Overview
- 12.1.3.2. Products
- 12.1.3.3. Company Financials
- 12.1.3.4. SWOT Analysis
- 12.1.4 PepsiCo Inc
- 12.1.4.1. Company Overview
- 12.1.4.2. Products
- 12.1.4.3. Company Financials
- 12.1.4.4. SWOT Analysis
- 12.1.5 Unilever PLC
- 12.1.5.1. Company Overview
- 12.1.5.2. Products
- 12.1.5.3. Company Financials
- 12.1.5.4. SWOT Analysis
- 12.1.6 Abbott Laboratories
- 12.1.6.1. Company Overview
- 12.1.6.2. Products
- 12.1.6.3. Company Financials
- 12.1.6.4. SWOT Analysis
- 12.1.7 LyteLine LLC
- 12.1.7.1. Company Overview
- 12.1.7.2. Products
- 12.1.7.3. Company Financials
- 12.1.7.4. SWOT Analysis
- 12.1.8 Otsuka Holdings Co Ltd
- 12.1.8.1. Company Overview
- 12.1.8.2. Products
- 12.1.8.3. Company Financials
- 12.1.8.4. SWOT Analysis
- 12.1.9 Vitalyte Sports Nutrition Inc *List Not Exhaustive
- 12.1.9.1. Company Overview
- 12.1.9.2. Products
- 12.1.9.3. Company Financials
- 12.1.9.4. SWOT Analysis
- 12.1.10 Ultima Health Products Inc
- 12.1.10.1. Company Overview
- 12.1.10.2. Products
- 12.1.10.3. Company Financials
- 12.1.10.4. SWOT Analysis
- 12.1.1 Tailwind Nutrition
- 12.2. Market Entropy
- 12.2.1 Company's Key Areas Served
- 12.2.2 Recent Developments
- 12.3. Company Market Share Analysis 2025
- 12.3.1 Top 5 Companies Market Share Analysis
- 12.3.2 Top 3 Companies Market Share Analysis
- 12.4. List of Potential Customers
- 13. Research Methodology
List of Figures
- Figure 1: Global Electrolyte Mixes Market Revenue Breakdown (Million, %) by Region 2025 & 2033
- Figure 2: North America Electrolyte Mixes Market Revenue (Million), by Product Type 2025 & 2033
- Figure 3: North America Electrolyte Mixes Market Revenue Share (%), by Product Type 2025 & 2033
- Figure 4: North America Electrolyte Mixes Market Revenue (Million), by Flavor 2025 & 2033
- Figure 5: North America Electrolyte Mixes Market Revenue Share (%), by Flavor 2025 & 2033
- Figure 6: North America Electrolyte Mixes Market Revenue (Million), by Distribution Channel 2025 & 2033
- Figure 7: North America Electrolyte Mixes Market Revenue Share (%), by Distribution Channel 2025 & 2033
- Figure 8: North America Electrolyte Mixes Market Revenue (Million), by Country 2025 & 2033
- Figure 9: North America Electrolyte Mixes Market Revenue Share (%), by Country 2025 & 2033
- Figure 10: Europe Electrolyte Mixes Market Revenue (Million), by Product Type 2025 & 2033
- Figure 11: Europe Electrolyte Mixes Market Revenue Share (%), by Product Type 2025 & 2033
- Figure 12: Europe Electrolyte Mixes Market Revenue (Million), by Flavor 2025 & 2033
- Figure 13: Europe Electrolyte Mixes Market Revenue Share (%), by Flavor 2025 & 2033
- Figure 14: Europe Electrolyte Mixes Market Revenue (Million), by Distribution Channel 2025 & 2033
- Figure 15: Europe Electrolyte Mixes Market Revenue Share (%), by Distribution Channel 2025 & 2033
- Figure 16: Europe Electrolyte Mixes Market Revenue (Million), by Country 2025 & 2033
- Figure 17: Europe Electrolyte Mixes Market Revenue Share (%), by Country 2025 & 2033
- Figure 18: Asia Pacific Electrolyte Mixes Market Revenue (Million), by Product Type 2025 & 2033
- Figure 19: Asia Pacific Electrolyte Mixes Market Revenue Share (%), by Product Type 2025 & 2033
- Figure 20: Asia Pacific Electrolyte Mixes Market Revenue (Million), by Flavor 2025 & 2033
- Figure 21: Asia Pacific Electrolyte Mixes Market Revenue Share (%), by Flavor 2025 & 2033
- Figure 22: Asia Pacific Electrolyte Mixes Market Revenue (Million), by Distribution Channel 2025 & 2033
- Figure 23: Asia Pacific Electrolyte Mixes Market Revenue Share (%), by Distribution Channel 2025 & 2033
- Figure 24: Asia Pacific Electrolyte Mixes Market Revenue (Million), by Country 2025 & 2033
- Figure 25: Asia Pacific Electrolyte Mixes Market Revenue Share (%), by Country 2025 & 2033
- Figure 26: South America Electrolyte Mixes Market Revenue (Million), by Product Type 2025 & 2033
- Figure 27: South America Electrolyte Mixes Market Revenue Share (%), by Product Type 2025 & 2033
- Figure 28: South America Electrolyte Mixes Market Revenue (Million), by Flavor 2025 & 2033
- Figure 29: South America Electrolyte Mixes Market Revenue Share (%), by Flavor 2025 & 2033
- Figure 30: South America Electrolyte Mixes Market Revenue (Million), by Distribution Channel 2025 & 2033
- Figure 31: South America Electrolyte Mixes Market Revenue Share (%), by Distribution Channel 2025 & 2033
- Figure 32: South America Electrolyte Mixes Market Revenue (Million), by Country 2025 & 2033
- Figure 33: South America Electrolyte Mixes Market Revenue Share (%), by Country 2025 & 2033
- Figure 34: Middle East and Africa Electrolyte Mixes Market Revenue (Million), by Product Type 2025 & 2033
- Figure 35: Middle East and Africa Electrolyte Mixes Market Revenue Share (%), by Product Type 2025 & 2033
- Figure 36: Middle East and Africa Electrolyte Mixes Market Revenue (Million), by Flavor 2025 & 2033
- Figure 37: Middle East and Africa Electrolyte Mixes Market Revenue Share (%), by Flavor 2025 & 2033
- Figure 38: Middle East and Africa Electrolyte Mixes Market Revenue (Million), by Distribution Channel 2025 & 2033
- Figure 39: Middle East and Africa Electrolyte Mixes Market Revenue Share (%), by Distribution Channel 2025 & 2033
- Figure 40: Middle East and Africa Electrolyte Mixes Market Revenue (Million), by Country 2025 & 2033
- Figure 41: Middle East and Africa Electrolyte Mixes Market Revenue Share (%), by Country 2025 & 2033
List of Tables
- Table 1: Global Electrolyte Mixes Market Revenue Million Forecast, by Product Type 2020 & 2033
- Table 2: Global Electrolyte Mixes Market Revenue Million Forecast, by Flavor 2020 & 2033
- Table 3: Global Electrolyte Mixes Market Revenue Million Forecast, by Distribution Channel 2020 & 2033
- Table 4: Global Electrolyte Mixes Market Revenue Million Forecast, by Region 2020 & 2033
- Table 5: Global Electrolyte Mixes Market Revenue Million Forecast, by Product Type 2020 & 2033
- Table 6: Global Electrolyte Mixes Market Revenue Million Forecast, by Flavor 2020 & 2033
- Table 7: Global Electrolyte Mixes Market Revenue Million Forecast, by Distribution Channel 2020 & 2033
- Table 8: Global Electrolyte Mixes Market Revenue Million Forecast, by Country 2020 & 2033
- Table 9: United States Electrolyte Mixes Market Revenue (Million) Forecast, by Application 2020 & 2033
- Table 10: Canada Electrolyte Mixes Market Revenue (Million) Forecast, by Application 2020 & 2033
- Table 11: Mexico Electrolyte Mixes Market Revenue (Million) Forecast, by Application 2020 & 2033
- Table 12: Rest of North America Electrolyte Mixes Market Revenue (Million) Forecast, by Application 2020 & 2033
- Table 13: Global Electrolyte Mixes Market Revenue Million Forecast, by Product Type 2020 & 2033
- Table 14: Global Electrolyte Mixes Market Revenue Million Forecast, by Flavor 2020 & 2033
- Table 15: Global Electrolyte Mixes Market Revenue Million Forecast, by Distribution Channel 2020 & 2033
- Table 16: Global Electrolyte Mixes Market Revenue Million Forecast, by Country 2020 & 2033
- Table 17: United Kingdom Electrolyte Mixes Market Revenue (Million) Forecast, by Application 2020 & 2033
- Table 18: Germany Electrolyte Mixes Market Revenue (Million) Forecast, by Application 2020 & 2033
- Table 19: France Electrolyte Mixes Market Revenue (Million) Forecast, by Application 2020 & 2033
- Table 20: Russia Electrolyte Mixes Market Revenue (Million) Forecast, by Application 2020 & 2033
- Table 21: Italy Electrolyte Mixes Market Revenue (Million) Forecast, by Application 2020 & 2033
- Table 22: Spain Electrolyte Mixes Market Revenue (Million) Forecast, by Application 2020 & 2033
- Table 23: Rest of Europe Electrolyte Mixes Market Revenue (Million) Forecast, by Application 2020 & 2033
- Table 24: Global Electrolyte Mixes Market Revenue Million Forecast, by Product Type 2020 & 2033
- Table 25: Global Electrolyte Mixes Market Revenue Million Forecast, by Flavor 2020 & 2033
- Table 26: Global Electrolyte Mixes Market Revenue Million Forecast, by Distribution Channel 2020 & 2033
- Table 27: Global Electrolyte Mixes Market Revenue Million Forecast, by Country 2020 & 2033
- Table 28: China Electrolyte Mixes Market Revenue (Million) Forecast, by Application 2020 & 2033
- Table 29: India Electrolyte Mixes Market Revenue (Million) Forecast, by Application 2020 & 2033
- Table 30: Japan Electrolyte Mixes Market Revenue (Million) Forecast, by Application 2020 & 2033
- Table 31: Australia Electrolyte Mixes Market Revenue (Million) Forecast, by Application 2020 & 2033
- Table 32: Rest of Asia Pacific Electrolyte Mixes Market Revenue (Million) Forecast, by Application 2020 & 2033
- Table 33: Global Electrolyte Mixes Market Revenue Million Forecast, by Product Type 2020 & 2033
- Table 34: Global Electrolyte Mixes Market Revenue Million Forecast, by Flavor 2020 & 2033
- Table 35: Global Electrolyte Mixes Market Revenue Million Forecast, by Distribution Channel 2020 & 2033
- Table 36: Global Electrolyte Mixes Market Revenue Million Forecast, by Country 2020 & 2033
- Table 37: Brazil Electrolyte Mixes Market Revenue (Million) Forecast, by Application 2020 & 2033
- Table 38: Argentina Electrolyte Mixes Market Revenue (Million) Forecast, by Application 2020 & 2033
- Table 39: Rest of South America Electrolyte Mixes Market Revenue (Million) Forecast, by Application 2020 & 2033
- Table 40: Global Electrolyte Mixes Market Revenue Million Forecast, by Product Type 2020 & 2033
- Table 41: Global Electrolyte Mixes Market Revenue Million Forecast, by Flavor 2020 & 2033
- Table 42: Global Electrolyte Mixes Market Revenue Million Forecast, by Distribution Channel 2020 & 2033
- Table 43: Global Electrolyte Mixes Market Revenue Million Forecast, by Country 2020 & 2033
- Table 44: South Africa Electrolyte Mixes Market Revenue (Million) Forecast, by Application 2020 & 2033
- Table 45: United Arab Emirates Electrolyte Mixes Market Revenue (Million) Forecast, by Application 2020 & 2033
- Table 46: Rest of Middle East and Africa Electrolyte Mixes Market Revenue (Million) Forecast, by Application 2020 & 2033
Frequently Asked Questions
1. What is the projected Compound Annual Growth Rate (CAGR) of the Electrolyte Mixes Market?
The projected CAGR is approximately 2.81%.
2. Which companies are prominent players in the Electrolyte Mixes Market?
Key companies in the market include Tailwind Nutrition, Kent Corporation, Nestlé SA, PepsiCo Inc, Unilever PLC, Abbott Laboratories, LyteLine LLC, Otsuka Holdings Co Ltd, Vitalyte Sports Nutrition Inc *List Not Exhaustive, Ultima Health Products Inc.
3. What are the main segments of the Electrolyte Mixes Market?
The market segments include Product Type, Flavor, Distribution Channel.
4. Can you provide details about the market size?
The market size is estimated to be USD 579.65 Million as of 2022.
5. What are some drivers contributing to market growth?
Rising Demand For Ready Meals Food Products to Influence Growth; Increasing Demand for Organic and Vegan Ready-to-Eat food products..
6. What are the notable trends driving market growth?
Surging Interest Among Consumers in Physical Activities. Including Gyms.
7. Are there any restraints impacting market growth?
Rising Concern Over Health Issues Associated with Processed Foods.
8. Can you provide examples of recent developments in the market?
MAY 2022: Liquid IV announced the launch of Hydration Multiplier+ Powdered Probiotic Kombucha, a blendable mixture that contains electrolytes, Liquid IV's BC30 Probiotic, which boasts an impressive 1 billion colony forming units (CFU), and a powdered kombucha. These components together help in boosting gut health.
9. What pricing options are available for accessing the report?
Pricing options include single-user, multi-user, and enterprise licenses priced at USD 4750, USD 5250, and USD 8750 respectively.
10. Is the market size provided in terms of value or volume?
The market size is provided in terms of value, measured in Million.
11. Are there any specific market keywords associated with the report?
Yes, the market keyword associated with the report is "Electrolyte Mixes Market," which aids in identifying and referencing the specific market segment covered.
12. How do I determine which pricing option suits my needs best?
The pricing options vary based on user requirements and access needs. Individual users may opt for single-user licenses, while businesses requiring broader access may choose multi-user or enterprise licenses for cost-effective access to the report.
13. Are there any additional resources or data provided in the Electrolyte Mixes Market report?
While the report offers comprehensive insights, it's advisable to review the specific contents or supplementary materials provided to ascertain if additional resources or data are available.
14. How can I stay updated on further developments or reports in the Electrolyte Mixes Market?
To stay informed about further developments, trends, and reports in the Electrolyte Mixes Market, consider subscribing to industry newsletters, following relevant companies and organizations, or regularly checking reputable industry news sources and publications.
Methodology
Step 1 - Identification of Relevant Samples Size from Population Database


Step 2 - Approaches for Defining Global Market Size (Value, Volume* & Price*)

Note*: In applicable scenarios
Step 3 - Data Sources
Primary Research
- Web Analytics
- Survey Reports
- Research Institute
- Latest Research Reports
- Opinion Leaders
Secondary Research
- Annual Reports
- White Paper
- Latest Press Release
- Industry Association
- Paid Database
- Investor Presentations

Step 4 - Data Triangulation
Involves using different sources of information in order to increase the validity of a study
These sources are likely to be stakeholders in a program - participants, other researchers, program staff, other community members, and so on.
Then we put all data in single framework & apply various statistical tools to find out the dynamic on the market.
During the analysis stage, feedback from the stakeholder groups would be compared to determine areas of agreement as well as areas of divergence