

Key Insights
The U.S. fish and seafood market is poised for steady expansion, projected to reach an estimated $56.93 billion in 2025, growing at a Compound Annual Growth Rate (CAGR) of 3.1% through 2033. This growth is underpinned by several dynamic factors, primarily driven by increasing consumer awareness regarding the health benefits associated with fish and seafood consumption, such as omega-3 fatty acids and lean protein. As health consciousness continues to rise in the U.S., demand for these nutrient-rich options is expected to surge across various demographics. Furthermore, a growing appreciation for diverse culinary experiences and the influence of global food trends are broadening the appeal of fish and seafood beyond traditional preferences. The convenience of ready-to-eat and processed seafood products is also catering to the fast-paced lifestyles of American consumers, driving demand through off-trade channels like online retailers and supermarkets.
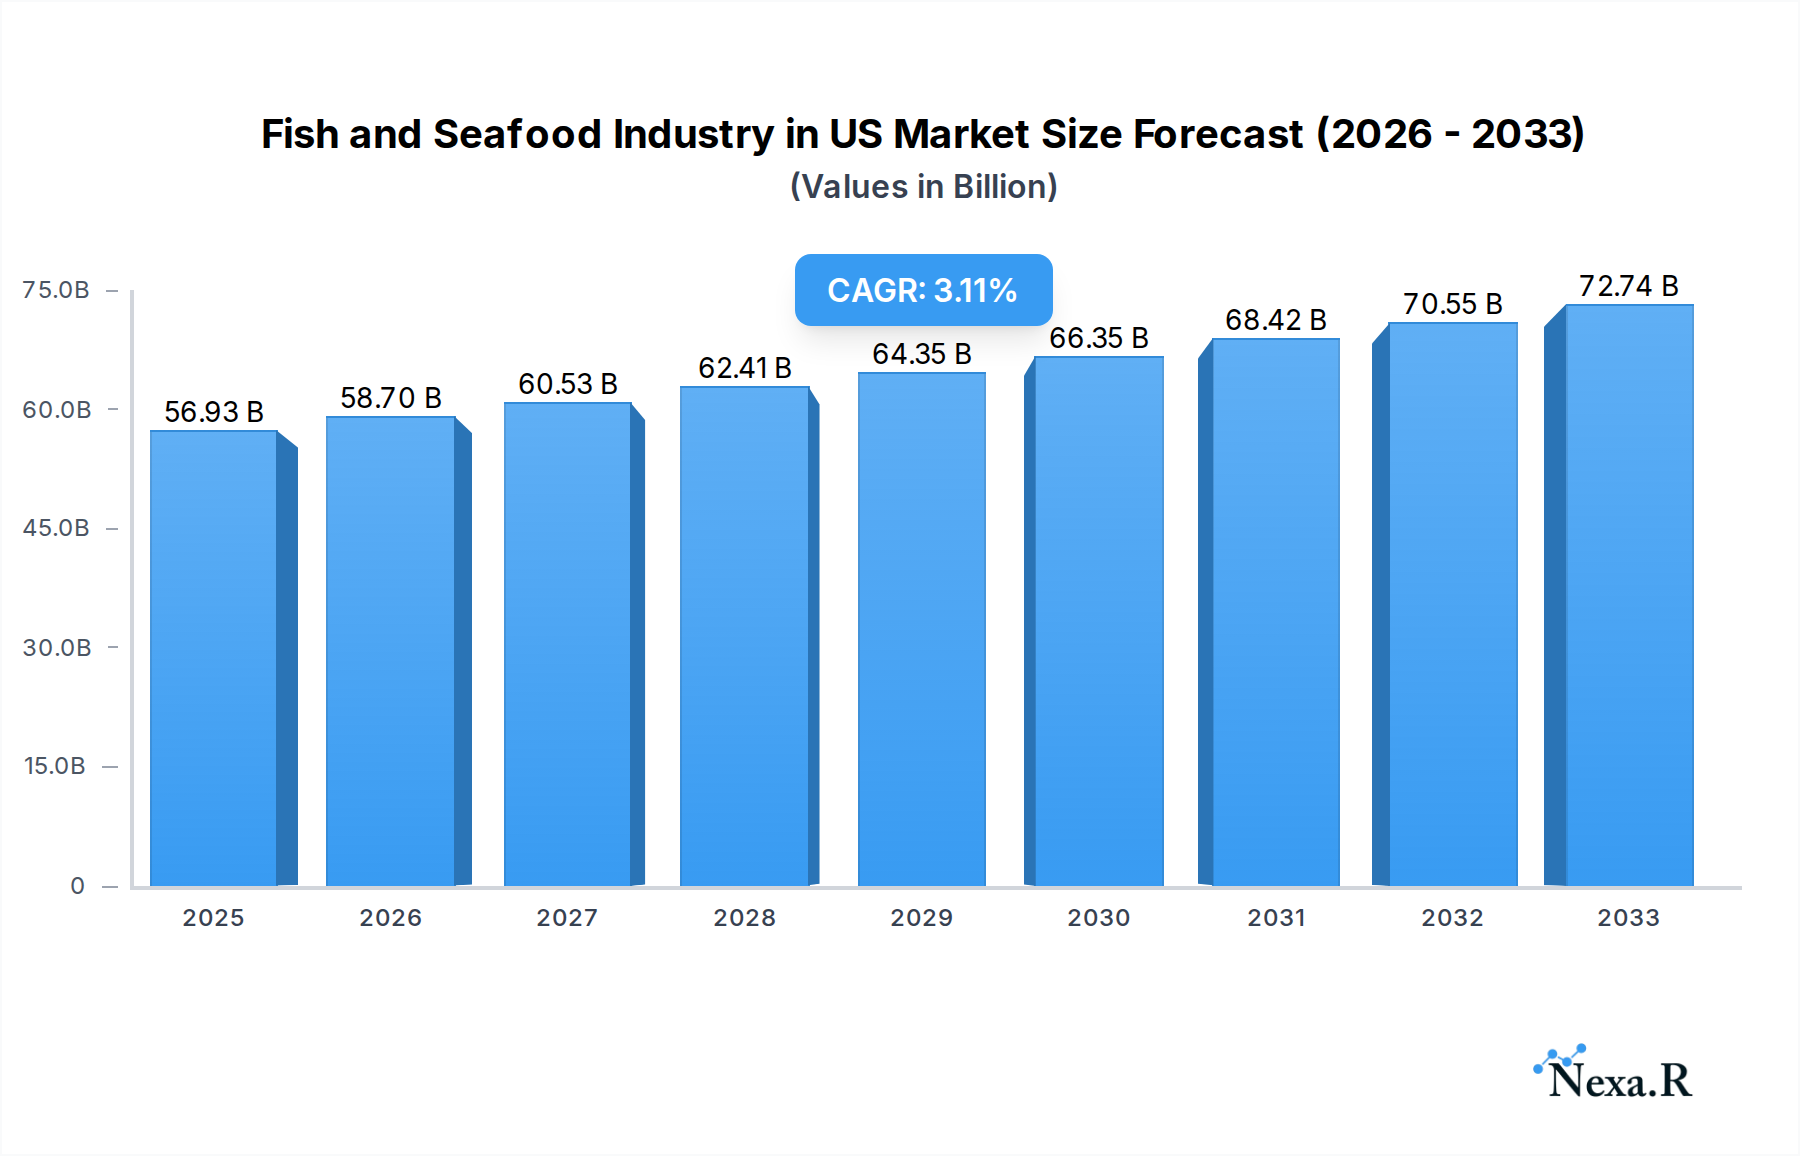
Fish and Seafood Industry in US Market Size (In Billion)
Despite the positive growth trajectory, certain challenges could temper the market's full potential. Concerns surrounding sustainability and responsible sourcing of fish and seafood are becoming increasingly prominent among consumers, requiring industry players to prioritize ethical practices and transparent supply chains. Fluctuations in fish stocks, potential overfishing, and the impact of climate change on marine ecosystems present ongoing environmental and economic hurdles. Additionally, stringent regulations regarding food safety and import/export policies can add complexity and cost to market operations. Nevertheless, the market's inherent resilience, coupled with innovation in product development and distribution, suggests a robust future for the U.S. fish and seafood industry.

Fish and Seafood Industry in US Company Market Share
US Fish and Seafood Market Report: Navigating a Dynamic Landscape (2019-2033)
This comprehensive report delves into the intricate dynamics and future trajectory of the US fish and seafood market. Covering the historical period of 2019-2024, base year 2025, and an estimated year 2025 alongside a robust forecast period from 2025-2033, this analysis provides unparalleled insights into this vital sector. We explore market size evolution, key growth drivers, dominant segments, product innovations, and emerging opportunities, making it an essential resource for industry professionals, investors, and stakeholders seeking to understand and capitalize on the burgeoning American seafood industry.
Fish and Seafood Industry in US Market Dynamics & Structure
The US fish and seafood market, valued at an estimated $XX billion in 2025, exhibits a moderate level of market concentration. Key players like Sysco Corporation, The Kraft Heinz Company, and Mowi ASA exert significant influence, particularly in the processed and frozen segments. Technological innovation is a crucial driver, with advancements in aquaculture, sustainable fishing practices, and advanced processing techniques shaping the industry's future. Regulatory frameworks, including those from the FDA and NOAA, are paramount in ensuring food safety and sustainability, impacting operational costs and market access. Competitive product substitutes, such as plant-based protein alternatives, pose a growing challenge, necessitating a focus on the inherent health benefits and unique culinary appeal of seafood. End-user demographics reveal a growing demand for convenient, healthy, and sustainably sourced options, particularly among millennials and Gen Z. Mergers and acquisitions (M&A) trends indicate consolidation, with companies seeking to expand their product portfolios and geographic reach.
- Market Concentration: Moderate, with top players holding significant shares in specific segments.
- Technological Innovation: Drives efficiency in aquaculture, processing, and supply chain management.
- Regulatory Frameworks: Strict adherence to FDA and NOAA regulations is essential for market entry and consumer trust.
- Competitive Substitutes: Growing threat from plant-based alternatives necessitates stronger marketing of seafood's nutritional value.
- End-User Demographics: Increasing demand for convenience, health, and sustainability.
- M&A Trends: Focus on vertical integration and portfolio expansion to capture market share.
Fish and Seafood Industry in US Growth Trends & Insights
The US fish and seafood market is poised for substantial growth, projected to expand at a Compound Annual Growth Rate (CAGR) of XX% from 2025 to 2033, reaching an estimated $XX billion by the end of the forecast period. This upward trajectory is fueled by a confluence of factors, including increasing consumer awareness regarding the health benefits of seafood, a growing preference for protein-rich diets, and the rising popularity of sustainable and ethically sourced products. The US seafood market size is directly correlated with these evolving consumer behaviors. Technological disruptions are playing a pivotal role, with innovations in aquaculture enabling more efficient and sustainable production of fish species, thereby increasing supply and potentially stabilizing prices. Advanced freezing and preservation techniques are also enhancing the availability and quality of fresh and chilled seafood across the country, mitigating seasonality and logistical challenges.
Consumer behavior shifts are markedly evident. There's a pronounced move towards transparency in sourcing, with consumers actively seeking out information about where their seafood comes from and how it was produced. This has led to a surge in demand for traceable and certified sustainable seafood products. Furthermore, the convenience factor is paramount; consumers are increasingly opting for value-added, ready-to-cook, and ready-to-eat seafood options, driving growth in the processed segment. The online channel for seafood purchases is also witnessing significant adoption, accelerated by the pandemic, offering consumers greater access and choice. Understanding these US seafood market trends is crucial for businesses aiming to thrive. The US seafood market growth is also influenced by the increasing popularity of diverse culinary experiences, with consumers exploring a wider variety of fish and shellfish species beyond traditional offerings. This diversification in palate contributes to the overall expansion of the market.
Dominant Regions, Countries, or Segments in Fish and Seafood Industry in US
The US fish and seafood industry is characterized by regional strengths and dominant segments that propel its overall market growth. Analyzing these areas provides critical insights into where the most significant economic activity and expansion are occurring.
Dominant Segments by Type:
- Fish: This segment consistently holds the largest market share within the US fish and seafood industry. Factors contributing to its dominance include widespread consumer familiarity, diverse culinary applications, and ongoing advancements in aquaculture and sustainable fishing practices that ensure a steady supply. The US fish market is driven by staples like salmon, tuna, and cod, alongside an increasing interest in less common but highly nutritious varieties.
- Shrimp: The US shrimp market represents another powerhouse, driven by its versatility in cooking and its popularity across various demographics. While a significant portion is imported, domestic aquaculture initiatives and improved supply chain management are bolstering its growth.
- Other Seafood: This broad category, encompassing shellfish like lobster, crab, oysters, and mussels, is experiencing robust growth. This surge is attributed to evolving consumer preferences for gourmet and exotic options, increased availability through improved cold chain logistics, and growing demand in the US seafood restaurant market.
Dominant Segments by Form:
- Frozen: The frozen segment continues to be a cornerstone of the US fish and seafood market. Its dominance stems from its ability to preserve freshness, extend shelf life, and ensure year-round availability, making it a cost-effective and convenient option for both consumers and businesses. Advancements in flash-freezing technology have significantly improved the quality of frozen products.
- Fresh / Chilled: While the frozen segment leads in volume, the fresh/chilled segment commands higher value and is critical for premium markets and food service. Driven by a demand for optimal quality and taste, this segment relies heavily on efficient cold chain logistics and regional sourcing to maintain its competitive edge. The US fresh seafood market is particularly strong in coastal regions and for specific high-demand species.
- Processed: This segment is experiencing rapid expansion due to consumer demand for convenience. Value-added products such as pre-marinated fish fillets, seafood mixes, and ready-to-eat meals are gaining traction, catering to busy lifestyles.
Dominant Segments by Distribution Channel:
- Off-Trade:
- Supermarkets and Hypermarkets: Remain the primary distribution channel for retail seafood sales, offering a wide variety of fresh, frozen, and processed products. Their extensive reach and ability to cater to diverse consumer needs make them indispensable.
- Online Channel: This channel has witnessed exponential growth, offering consumers unparalleled convenience, wider selection, and direct-to-doorstep delivery. The US online seafood sales are projected to continue their upward trajectory.
- Convenience Stores: While smaller in market share, convenience stores are increasingly offering a curated selection of seafood products, catering to impulse purchases and immediate consumption needs.
- On-Trade: The US seafood restaurant market is a significant driver of consumption, with demand for high-quality, restaurant-prepared seafood remaining strong. Fine dining establishments and casual seafood eateries contribute substantially to the overall market value.
Fish and Seafood Industry in US Product Landscape
The US fish and seafood product landscape is defined by continuous innovation, focusing on consumer convenience, health benefits, and sustainability. Product development is increasingly geared towards value-added offerings, such as pre-portioned fillets, marinated seafood kits, and ready-to-cook meals, catering to time-constrained consumers. Technological advancements in flash-freezing and IQF (Individual Quick Freezing) techniques are enhancing the quality and texture of frozen seafood, making it a more attractive alternative to fresh. Furthermore, there's a notable trend towards showcasing unique selling propositions like traceability, origin stories, and certifications for sustainable fishing or responsible aquaculture. Applications range from traditional family meals to gourmet restaurant dishes, with a growing emphasis on plant-based seafood alternatives as a complementary category.
Key Drivers, Barriers & Challenges in Fish and Seafood Industry in US
Key Drivers:
- Growing Health Consciousness: Consumers are increasingly prioritizing seafood for its nutritional benefits, including omega-3 fatty acids and lean protein, driving demand for healthy protein sources.
- Demand for Sustainable and Traceable Products: Ethical sourcing and environmental responsibility are becoming critical purchasing factors, pushing companies to adopt sustainable practices and enhance supply chain transparency.
- Convenience and Value-Added Products: The rising demand for ready-to-cook and ready-to-eat seafood options, driven by busy lifestyles, fuels innovation in processed seafood.
- Technological Advancements: Innovations in aquaculture, fishing technologies, and cold chain logistics are improving supply, quality, and accessibility of seafood.
Barriers & Challenges:
- Supply Chain Disruptions: Volatility in global supply chains, influenced by geopolitical events, climate change, and labor shortages, poses a significant challenge to consistent availability and pricing.
- Regulatory Hurdles and Compliance Costs: Navigating complex and evolving regulations related to fishing quotas, import standards, and food safety can be costly and time-consuming for businesses.
- Price Volatility and Affordability: Fluctuations in raw material costs, fuel prices, and import tariffs can lead to price instability, impacting consumer affordability and market demand.
- Consumer Perceptions and Education: Overcoming negative perceptions related to sustainability, mercury levels, or unfamiliar species requires ongoing consumer education and marketing efforts.
Emerging Opportunities in Fish and Seafood Industry in US
Emerging opportunities in the US fish and seafood industry lie in leveraging the growing demand for sustainable and traceable products, particularly those from domestic aquaculture. The expansion of the online channel presents a significant avenue for direct-to-consumer sales and niche market penetration. Furthermore, there's an untapped potential in developing and marketing a wider array of underutilized but nutritious and sustainably sourced seafood species. Innovations in ready-to-eat and value-added seafood products that cater to diverse dietary needs (e.g., gluten-free, low-sodium) also represent a fertile ground for growth. The integration of advanced technologies, such as AI in supply chain management and blockchain for enhanced traceability, will further unlock new avenues for efficiency and consumer trust.
Growth Accelerators in the Fish and Seafood Industry in US Industry
Long-term growth in the US fish and seafood industry will be significantly accelerated by advancements in sustainable aquaculture technologies, enabling more efficient and environmentally friendly production of key species. Strategic partnerships between seafood producers, technology providers, and retail chains will streamline supply chains and enhance market reach. Furthermore, targeted marketing campaigns focused on the health benefits and culinary versatility of seafood, particularly for underrepresented species, will broaden consumer appeal. The development of innovative packaging solutions that extend shelf life and reduce waste, coupled with robust traceability systems, will build consumer confidence and drive repeat purchases. The continued expansion of e-commerce platforms for seafood will also be a crucial catalyst for market growth.
Key Players Shaping the Fish and Seafood Industry in US Market
- Trident Seafood Corporation
- Admiralty Island Fisheries Inc
- Beaver Street Fisheries
- Inland Seafood Inc
- NH Foods Ltd
- High Liner Foods Inc
- Sysco Corporation
- The Kraft Heinz Company
- Thai Union Group PCL
- Mowi ASA
Notable Milestones in Fish and Seafood Industry in US Sector
- May 2023: Trident Seafood Corporation collaborated with Copper River Prince William Sound Marketing Association to introduce new Prized Fish product range in the United States Market.
- April 2023: Inland Seafood opened a new facility of its own in Jefferson Parish, investing approximately USD 4 million to purchase and renovate a 14,000-square-foot facility, bringing 55 jobs.
- January 2023: Inland Seafood acquired Texas-based Lonestar Seafood to expand its operations in the western United States, leveraging Lonestar's expertise in lobster supply.
In-Depth Fish and Seafood Industry in US Market Outlook
The US fish and seafood market outlook is exceptionally promising, driven by sustained growth accelerators. The increasing consumer demand for sustainable, healthy, and convenient seafood options, coupled with ongoing technological innovations in aquaculture and processing, will continue to fuel market expansion. Strategic alliances and investments in efficient supply chain infrastructure, including advanced cold chain logistics and the growth of online retail channels, will further enhance accessibility and market penetration. The industry is well-positioned to capitalize on evolving consumer preferences for diverse culinary experiences and a greater emphasis on traceability and ethical sourcing, ensuring a robust and dynamic future for the US seafood sector.
Fish and Seafood Industry in US Segmentation
-
1. Type
- 1.1. Fish
- 1.2. Shrimp
- 1.3. Other Seafood
-
2. Form
- 2.1. Canned
- 2.2. Fresh / Chilled
- 2.3. Frozen
- 2.4. Processed
-
3. Distribution Channel
-
3.1. Off-Trade
- 3.1.1. Convenience Stores
- 3.1.2. Online Channel
- 3.1.3. Supermarkets and Hypermarkets
- 3.1.4. Others
- 3.2. On-Trade
-
3.1. Off-Trade
Fish and Seafood Industry in US Segmentation By Geography
-
1. North America
- 1.1. United States
- 1.2. Canada
- 1.3. Mexico
-
2. South America
- 2.1. Brazil
- 2.2. Argentina
- 2.3. Rest of South America
-
3. Europe
- 3.1. United Kingdom
- 3.2. Germany
- 3.3. France
- 3.4. Italy
- 3.5. Spain
- 3.6. Russia
- 3.7. Benelux
- 3.8. Nordics
- 3.9. Rest of Europe
-
4. Middle East & Africa
- 4.1. Turkey
- 4.2. Israel
- 4.3. GCC
- 4.4. North Africa
- 4.5. South Africa
- 4.6. Rest of Middle East & Africa
-
5. Asia Pacific
- 5.1. China
- 5.2. India
- 5.3. Japan
- 5.4. South Korea
- 5.5. ASEAN
- 5.6. Oceania
- 5.7. Rest of Asia Pacific
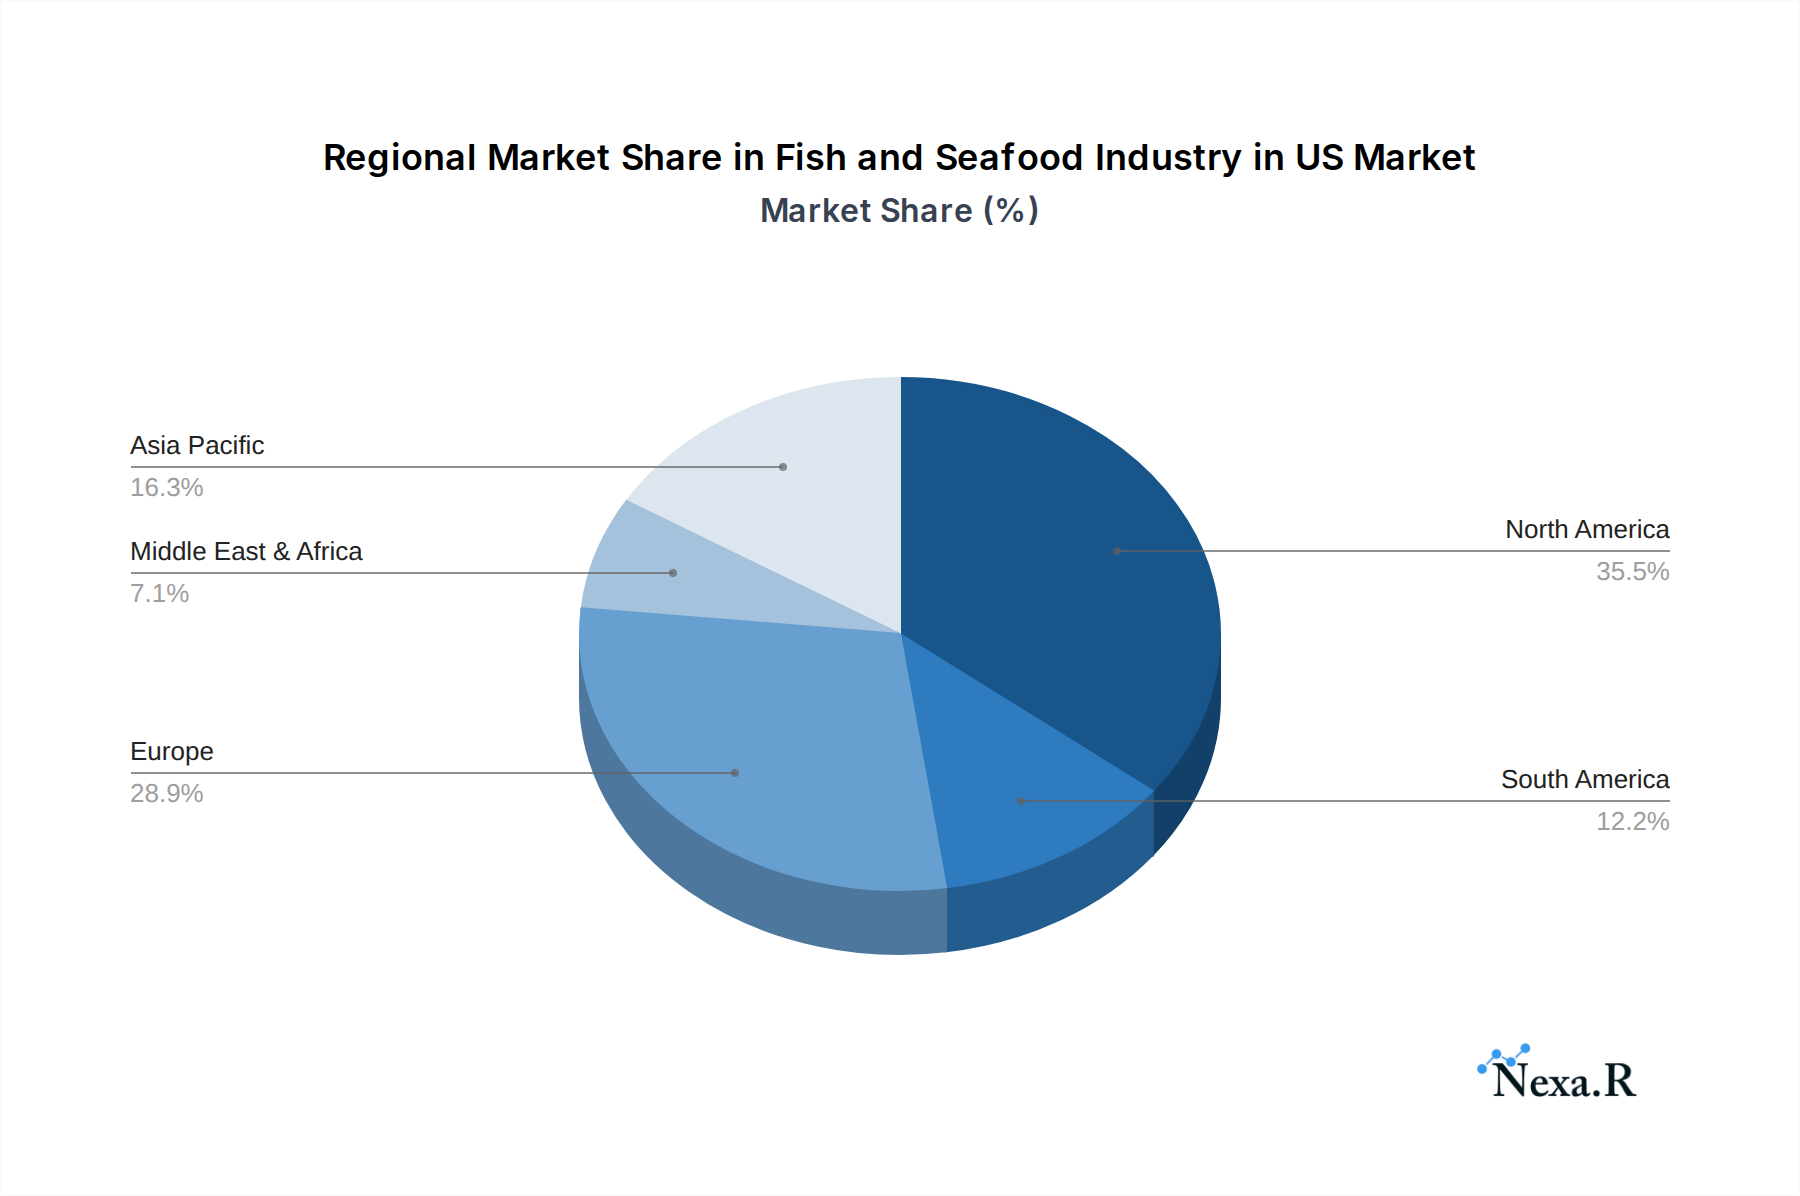
Fish and Seafood Industry in US Regional Market Share
Geographic Coverage of Fish and Seafood Industry in US
Fish and Seafood Industry in US REPORT HIGHLIGHTS
| Aspects | Details |
|---|---|
| Study Period | 2020-2034 |
| Base Year | 2025 |
| Estimated Year | 2026 |
| Forecast Period | 2026-2034 |
| Historical Period | 2020-2025 |
| Growth Rate | CAGR of 3.1% from 2020-2034 |
| Segmentation |
|
Table of Contents
- 1. Introduction
- 1.1. Research Scope
- 1.2. Market Segmentation
- 1.3. Research Objective
- 1.4. Definitions and Assumptions
- 2. Executive Summary
- 2.1. Market Snapshot
- 3. Market Dynamics
- 3.1. Market Drivers
- 3.2. Market Restrains
- 3.3. Market Trends
- 3.4. Market Opportunities
- 4. Market Factor Analysis
- 4.1. Porters Five Forces
- 4.1.1. Bargaining Power of Suppliers
- 4.1.2. Bargaining Power of Buyers
- 4.1.3. Threat of New Entrants
- 4.1.4. Threat of Substitutes
- 4.1.5. Competitive Rivalry
- 4.2. PESTEL analysis
- 4.3. BCG Analysis
- 4.3.1. Stars (High Growth, High Market Share)
- 4.3.2. Cash Cows (Low Growth, High Market Share)
- 4.3.3. Question Mark (High Growth, Low Market Share)
- 4.3.4. Dogs (Low Growth, Low Market Share)
- 4.4. Ansoff Matrix Analysis
- 4.5. Supply Chain Analysis
- 4.6. Regulatory Landscape
- 4.7. Current Market Potential and Opportunity Assessment (TAM–SAM–SOM Framework)
- 4.8. NRP Analyst Note
- 4.1. Porters Five Forces
- 5. Market Analysis, Insights and Forecast 2021-2033
- 5.1. Market Analysis, Insights and Forecast - by Type
- 5.1.1. Fish
- 5.1.2. Shrimp
- 5.1.3. Other Seafood
- 5.2. Market Analysis, Insights and Forecast - by Form
- 5.2.1. Canned
- 5.2.2. Fresh / Chilled
- 5.2.3. Frozen
- 5.2.4. Processed
- 5.3. Market Analysis, Insights and Forecast - by Distribution Channel
- 5.3.1. Off-Trade
- 5.3.1.1. Convenience Stores
- 5.3.1.2. Online Channel
- 5.3.1.3. Supermarkets and Hypermarkets
- 5.3.1.4. Others
- 5.3.2. On-Trade
- 5.3.1. Off-Trade
- 5.4. Market Analysis, Insights and Forecast - by Region
- 5.4.1. North America
- 5.4.2. South America
- 5.4.3. Europe
- 5.4.4. Middle East & Africa
- 5.4.5. Asia Pacific
- 5.1. Market Analysis, Insights and Forecast - by Type
- 6. Global Fish and Seafood Industry in US Analysis, Insights and Forecast, 2021-2033
- 6.1. Market Analysis, Insights and Forecast - by Type
- 6.1.1. Fish
- 6.1.2. Shrimp
- 6.1.3. Other Seafood
- 6.2. Market Analysis, Insights and Forecast - by Form
- 6.2.1. Canned
- 6.2.2. Fresh / Chilled
- 6.2.3. Frozen
- 6.2.4. Processed
- 6.3. Market Analysis, Insights and Forecast - by Distribution Channel
- 6.3.1. Off-Trade
- 6.3.1.1. Convenience Stores
- 6.3.1.2. Online Channel
- 6.3.1.3. Supermarkets and Hypermarkets
- 6.3.1.4. Others
- 6.3.2. On-Trade
- 6.3.1. Off-Trade
- 6.1. Market Analysis, Insights and Forecast - by Type
- 7. North America Fish and Seafood Industry in US Analysis, Insights and Forecast, 2020-2032
- 7.1. Market Analysis, Insights and Forecast - by Type
- 7.1.1. Fish
- 7.1.2. Shrimp
- 7.1.3. Other Seafood
- 7.2. Market Analysis, Insights and Forecast - by Form
- 7.2.1. Canned
- 7.2.2. Fresh / Chilled
- 7.2.3. Frozen
- 7.2.4. Processed
- 7.3. Market Analysis, Insights and Forecast - by Distribution Channel
- 7.3.1. Off-Trade
- 7.3.1.1. Convenience Stores
- 7.3.1.2. Online Channel
- 7.3.1.3. Supermarkets and Hypermarkets
- 7.3.1.4. Others
- 7.3.2. On-Trade
- 7.3.1. Off-Trade
- 7.1. Market Analysis, Insights and Forecast - by Type
- 8. South America Fish and Seafood Industry in US Analysis, Insights and Forecast, 2020-2032
- 8.1. Market Analysis, Insights and Forecast - by Type
- 8.1.1. Fish
- 8.1.2. Shrimp
- 8.1.3. Other Seafood
- 8.2. Market Analysis, Insights and Forecast - by Form
- 8.2.1. Canned
- 8.2.2. Fresh / Chilled
- 8.2.3. Frozen
- 8.2.4. Processed
- 8.3. Market Analysis, Insights and Forecast - by Distribution Channel
- 8.3.1. Off-Trade
- 8.3.1.1. Convenience Stores
- 8.3.1.2. Online Channel
- 8.3.1.3. Supermarkets and Hypermarkets
- 8.3.1.4. Others
- 8.3.2. On-Trade
- 8.3.1. Off-Trade
- 8.1. Market Analysis, Insights and Forecast - by Type
- 9. Europe Fish and Seafood Industry in US Analysis, Insights and Forecast, 2020-2032
- 9.1. Market Analysis, Insights and Forecast - by Type
- 9.1.1. Fish
- 9.1.2. Shrimp
- 9.1.3. Other Seafood
- 9.2. Market Analysis, Insights and Forecast - by Form
- 9.2.1. Canned
- 9.2.2. Fresh / Chilled
- 9.2.3. Frozen
- 9.2.4. Processed
- 9.3. Market Analysis, Insights and Forecast - by Distribution Channel
- 9.3.1. Off-Trade
- 9.3.1.1. Convenience Stores
- 9.3.1.2. Online Channel
- 9.3.1.3. Supermarkets and Hypermarkets
- 9.3.1.4. Others
- 9.3.2. On-Trade
- 9.3.1. Off-Trade
- 9.1. Market Analysis, Insights and Forecast - by Type
- 10. Middle East & Africa Fish and Seafood Industry in US Analysis, Insights and Forecast, 2020-2032
- 10.1. Market Analysis, Insights and Forecast - by Type
- 10.1.1. Fish
- 10.1.2. Shrimp
- 10.1.3. Other Seafood
- 10.2. Market Analysis, Insights and Forecast - by Form
- 10.2.1. Canned
- 10.2.2. Fresh / Chilled
- 10.2.3. Frozen
- 10.2.4. Processed
- 10.3. Market Analysis, Insights and Forecast - by Distribution Channel
- 10.3.1. Off-Trade
- 10.3.1.1. Convenience Stores
- 10.3.1.2. Online Channel
- 10.3.1.3. Supermarkets and Hypermarkets
- 10.3.1.4. Others
- 10.3.2. On-Trade
- 10.3.1. Off-Trade
- 10.1. Market Analysis, Insights and Forecast - by Type
- 11. Asia Pacific Fish and Seafood Industry in US Analysis, Insights and Forecast, 2020-2032
- 11.1. Market Analysis, Insights and Forecast - by Type
- 11.1.1. Fish
- 11.1.2. Shrimp
- 11.1.3. Other Seafood
- 11.2. Market Analysis, Insights and Forecast - by Form
- 11.2.1. Canned
- 11.2.2. Fresh / Chilled
- 11.2.3. Frozen
- 11.2.4. Processed
- 11.3. Market Analysis, Insights and Forecast - by Distribution Channel
- 11.3.1. Off-Trade
- 11.3.1.1. Convenience Stores
- 11.3.1.2. Online Channel
- 11.3.1.3. Supermarkets and Hypermarkets
- 11.3.1.4. Others
- 11.3.2. On-Trade
- 11.3.1. Off-Trade
- 11.1. Market Analysis, Insights and Forecast - by Type
- 12. Competitive Analysis
- 12.1. Company Profiles
- 12.1.1 Trident Seafood Corporatio
- 12.1.1.1. Company Overview
- 12.1.1.2. Products
- 12.1.1.3. Company Financials
- 12.1.1.4. SWOT Analysis
- 12.1.2 Admiralty Island Fisheries Inc
- 12.1.2.1. Company Overview
- 12.1.2.2. Products
- 12.1.2.3. Company Financials
- 12.1.2.4. SWOT Analysis
- 12.1.3 Beaver Street Fisheries
- 12.1.3.1. Company Overview
- 12.1.3.2. Products
- 12.1.3.3. Company Financials
- 12.1.3.4. SWOT Analysis
- 12.1.4 Inland Seafood Inc
- 12.1.4.1. Company Overview
- 12.1.4.2. Products
- 12.1.4.3. Company Financials
- 12.1.4.4. SWOT Analysis
- 12.1.5 NH Foods Ltd
- 12.1.5.1. Company Overview
- 12.1.5.2. Products
- 12.1.5.3. Company Financials
- 12.1.5.4. SWOT Analysis
- 12.1.6 High Liner Foods Inc
- 12.1.6.1. Company Overview
- 12.1.6.2. Products
- 12.1.6.3. Company Financials
- 12.1.6.4. SWOT Analysis
- 12.1.7 Sysco Corporation
- 12.1.7.1. Company Overview
- 12.1.7.2. Products
- 12.1.7.3. Company Financials
- 12.1.7.4. SWOT Analysis
- 12.1.8 The Kraft Heinz Company
- 12.1.8.1. Company Overview
- 12.1.8.2. Products
- 12.1.8.3. Company Financials
- 12.1.8.4. SWOT Analysis
- 12.1.9 Thai Union Group PCL
- 12.1.9.1. Company Overview
- 12.1.9.2. Products
- 12.1.9.3. Company Financials
- 12.1.9.4. SWOT Analysis
- 12.1.10 Mowi ASA
- 12.1.10.1. Company Overview
- 12.1.10.2. Products
- 12.1.10.3. Company Financials
- 12.1.10.4. SWOT Analysis
- 12.1.1 Trident Seafood Corporatio
- 12.2. Market Entropy
- 12.2.1 Company's Key Areas Served
- 12.2.2 Recent Developments
- 12.3. Company Market Share Analysis 2025
- 12.3.1 Top 5 Companies Market Share Analysis
- 12.3.2 Top 3 Companies Market Share Analysis
- 12.4. List of Potential Customers
- 13. Research Methodology
List of Figures
- Figure 1: Global Fish and Seafood Industry in US Revenue Breakdown (billion, %) by Region 2025 & 2033
- Figure 2: North America Fish and Seafood Industry in US Revenue (billion), by Type 2025 & 2033
- Figure 3: North America Fish and Seafood Industry in US Revenue Share (%), by Type 2025 & 2033
- Figure 4: North America Fish and Seafood Industry in US Revenue (billion), by Form 2025 & 2033
- Figure 5: North America Fish and Seafood Industry in US Revenue Share (%), by Form 2025 & 2033
- Figure 6: North America Fish and Seafood Industry in US Revenue (billion), by Distribution Channel 2025 & 2033
- Figure 7: North America Fish and Seafood Industry in US Revenue Share (%), by Distribution Channel 2025 & 2033
- Figure 8: North America Fish and Seafood Industry in US Revenue (billion), by Country 2025 & 2033
- Figure 9: North America Fish and Seafood Industry in US Revenue Share (%), by Country 2025 & 2033
- Figure 10: South America Fish and Seafood Industry in US Revenue (billion), by Type 2025 & 2033
- Figure 11: South America Fish and Seafood Industry in US Revenue Share (%), by Type 2025 & 2033
- Figure 12: South America Fish and Seafood Industry in US Revenue (billion), by Form 2025 & 2033
- Figure 13: South America Fish and Seafood Industry in US Revenue Share (%), by Form 2025 & 2033
- Figure 14: South America Fish and Seafood Industry in US Revenue (billion), by Distribution Channel 2025 & 2033
- Figure 15: South America Fish and Seafood Industry in US Revenue Share (%), by Distribution Channel 2025 & 2033
- Figure 16: South America Fish and Seafood Industry in US Revenue (billion), by Country 2025 & 2033
- Figure 17: South America Fish and Seafood Industry in US Revenue Share (%), by Country 2025 & 2033
- Figure 18: Europe Fish and Seafood Industry in US Revenue (billion), by Type 2025 & 2033
- Figure 19: Europe Fish and Seafood Industry in US Revenue Share (%), by Type 2025 & 2033
- Figure 20: Europe Fish and Seafood Industry in US Revenue (billion), by Form 2025 & 2033
- Figure 21: Europe Fish and Seafood Industry in US Revenue Share (%), by Form 2025 & 2033
- Figure 22: Europe Fish and Seafood Industry in US Revenue (billion), by Distribution Channel 2025 & 2033
- Figure 23: Europe Fish and Seafood Industry in US Revenue Share (%), by Distribution Channel 2025 & 2033
- Figure 24: Europe Fish and Seafood Industry in US Revenue (billion), by Country 2025 & 2033
- Figure 25: Europe Fish and Seafood Industry in US Revenue Share (%), by Country 2025 & 2033
- Figure 26: Middle East & Africa Fish and Seafood Industry in US Revenue (billion), by Type 2025 & 2033
- Figure 27: Middle East & Africa Fish and Seafood Industry in US Revenue Share (%), by Type 2025 & 2033
- Figure 28: Middle East & Africa Fish and Seafood Industry in US Revenue (billion), by Form 2025 & 2033
- Figure 29: Middle East & Africa Fish and Seafood Industry in US Revenue Share (%), by Form 2025 & 2033
- Figure 30: Middle East & Africa Fish and Seafood Industry in US Revenue (billion), by Distribution Channel 2025 & 2033
- Figure 31: Middle East & Africa Fish and Seafood Industry in US Revenue Share (%), by Distribution Channel 2025 & 2033
- Figure 32: Middle East & Africa Fish and Seafood Industry in US Revenue (billion), by Country 2025 & 2033
- Figure 33: Middle East & Africa Fish and Seafood Industry in US Revenue Share (%), by Country 2025 & 2033
- Figure 34: Asia Pacific Fish and Seafood Industry in US Revenue (billion), by Type 2025 & 2033
- Figure 35: Asia Pacific Fish and Seafood Industry in US Revenue Share (%), by Type 2025 & 2033
- Figure 36: Asia Pacific Fish and Seafood Industry in US Revenue (billion), by Form 2025 & 2033
- Figure 37: Asia Pacific Fish and Seafood Industry in US Revenue Share (%), by Form 2025 & 2033
- Figure 38: Asia Pacific Fish and Seafood Industry in US Revenue (billion), by Distribution Channel 2025 & 2033
- Figure 39: Asia Pacific Fish and Seafood Industry in US Revenue Share (%), by Distribution Channel 2025 & 2033
- Figure 40: Asia Pacific Fish and Seafood Industry in US Revenue (billion), by Country 2025 & 2033
- Figure 41: Asia Pacific Fish and Seafood Industry in US Revenue Share (%), by Country 2025 & 2033
List of Tables
- Table 1: Global Fish and Seafood Industry in US Revenue billion Forecast, by Type 2020 & 2033
- Table 2: Global Fish and Seafood Industry in US Revenue billion Forecast, by Form 2020 & 2033
- Table 3: Global Fish and Seafood Industry in US Revenue billion Forecast, by Distribution Channel 2020 & 2033
- Table 4: Global Fish and Seafood Industry in US Revenue billion Forecast, by Region 2020 & 2033
- Table 5: Global Fish and Seafood Industry in US Revenue billion Forecast, by Type 2020 & 2033
- Table 6: Global Fish and Seafood Industry in US Revenue billion Forecast, by Form 2020 & 2033
- Table 7: Global Fish and Seafood Industry in US Revenue billion Forecast, by Distribution Channel 2020 & 2033
- Table 8: Global Fish and Seafood Industry in US Revenue billion Forecast, by Country 2020 & 2033
- Table 9: United States Fish and Seafood Industry in US Revenue (billion) Forecast, by Application 2020 & 2033
- Table 10: Canada Fish and Seafood Industry in US Revenue (billion) Forecast, by Application 2020 & 2033
- Table 11: Mexico Fish and Seafood Industry in US Revenue (billion) Forecast, by Application 2020 & 2033
- Table 12: Global Fish and Seafood Industry in US Revenue billion Forecast, by Type 2020 & 2033
- Table 13: Global Fish and Seafood Industry in US Revenue billion Forecast, by Form 2020 & 2033
- Table 14: Global Fish and Seafood Industry in US Revenue billion Forecast, by Distribution Channel 2020 & 2033
- Table 15: Global Fish and Seafood Industry in US Revenue billion Forecast, by Country 2020 & 2033
- Table 16: Brazil Fish and Seafood Industry in US Revenue (billion) Forecast, by Application 2020 & 2033
- Table 17: Argentina Fish and Seafood Industry in US Revenue (billion) Forecast, by Application 2020 & 2033
- Table 18: Rest of South America Fish and Seafood Industry in US Revenue (billion) Forecast, by Application 2020 & 2033
- Table 19: Global Fish and Seafood Industry in US Revenue billion Forecast, by Type 2020 & 2033
- Table 20: Global Fish and Seafood Industry in US Revenue billion Forecast, by Form 2020 & 2033
- Table 21: Global Fish and Seafood Industry in US Revenue billion Forecast, by Distribution Channel 2020 & 2033
- Table 22: Global Fish and Seafood Industry in US Revenue billion Forecast, by Country 2020 & 2033
- Table 23: United Kingdom Fish and Seafood Industry in US Revenue (billion) Forecast, by Application 2020 & 2033
- Table 24: Germany Fish and Seafood Industry in US Revenue (billion) Forecast, by Application 2020 & 2033
- Table 25: France Fish and Seafood Industry in US Revenue (billion) Forecast, by Application 2020 & 2033
- Table 26: Italy Fish and Seafood Industry in US Revenue (billion) Forecast, by Application 2020 & 2033
- Table 27: Spain Fish and Seafood Industry in US Revenue (billion) Forecast, by Application 2020 & 2033
- Table 28: Russia Fish and Seafood Industry in US Revenue (billion) Forecast, by Application 2020 & 2033
- Table 29: Benelux Fish and Seafood Industry in US Revenue (billion) Forecast, by Application 2020 & 2033
- Table 30: Nordics Fish and Seafood Industry in US Revenue (billion) Forecast, by Application 2020 & 2033
- Table 31: Rest of Europe Fish and Seafood Industry in US Revenue (billion) Forecast, by Application 2020 & 2033
- Table 32: Global Fish and Seafood Industry in US Revenue billion Forecast, by Type 2020 & 2033
- Table 33: Global Fish and Seafood Industry in US Revenue billion Forecast, by Form 2020 & 2033
- Table 34: Global Fish and Seafood Industry in US Revenue billion Forecast, by Distribution Channel 2020 & 2033
- Table 35: Global Fish and Seafood Industry in US Revenue billion Forecast, by Country 2020 & 2033
- Table 36: Turkey Fish and Seafood Industry in US Revenue (billion) Forecast, by Application 2020 & 2033
- Table 37: Israel Fish and Seafood Industry in US Revenue (billion) Forecast, by Application 2020 & 2033
- Table 38: GCC Fish and Seafood Industry in US Revenue (billion) Forecast, by Application 2020 & 2033
- Table 39: North Africa Fish and Seafood Industry in US Revenue (billion) Forecast, by Application 2020 & 2033
- Table 40: South Africa Fish and Seafood Industry in US Revenue (billion) Forecast, by Application 2020 & 2033
- Table 41: Rest of Middle East & Africa Fish and Seafood Industry in US Revenue (billion) Forecast, by Application 2020 & 2033
- Table 42: Global Fish and Seafood Industry in US Revenue billion Forecast, by Type 2020 & 2033
- Table 43: Global Fish and Seafood Industry in US Revenue billion Forecast, by Form 2020 & 2033
- Table 44: Global Fish and Seafood Industry in US Revenue billion Forecast, by Distribution Channel 2020 & 2033
- Table 45: Global Fish and Seafood Industry in US Revenue billion Forecast, by Country 2020 & 2033
- Table 46: China Fish and Seafood Industry in US Revenue (billion) Forecast, by Application 2020 & 2033
- Table 47: India Fish and Seafood Industry in US Revenue (billion) Forecast, by Application 2020 & 2033
- Table 48: Japan Fish and Seafood Industry in US Revenue (billion) Forecast, by Application 2020 & 2033
- Table 49: South Korea Fish and Seafood Industry in US Revenue (billion) Forecast, by Application 2020 & 2033
- Table 50: ASEAN Fish and Seafood Industry in US Revenue (billion) Forecast, by Application 2020 & 2033
- Table 51: Oceania Fish and Seafood Industry in US Revenue (billion) Forecast, by Application 2020 & 2033
- Table 52: Rest of Asia Pacific Fish and Seafood Industry in US Revenue (billion) Forecast, by Application 2020 & 2033
Frequently Asked Questions
1. What is the projected Compound Annual Growth Rate (CAGR) of the Fish and Seafood Industry in US?
The projected CAGR is approximately 3.1%.
2. Which companies are prominent players in the Fish and Seafood Industry in US?
Key companies in the market include Trident Seafood Corporatio, Admiralty Island Fisheries Inc, Beaver Street Fisheries, Inland Seafood Inc, NH Foods Ltd, High Liner Foods Inc, Sysco Corporation, The Kraft Heinz Company, Thai Union Group PCL, Mowi ASA.
3. What are the main segments of the Fish and Seafood Industry in US?
The market segments include Type, Form, Distribution Channel.
4. Can you provide details about the market size?
The market size is estimated to be USD 56.93 billion as of 2022.
5. What are some drivers contributing to market growth?
Increasing Focus on Maintaining Health and Well-Being; Launching Supplements For Specific Purposes and Targeted Population.
6. What are the notable trends driving market growth?
OTHER KEY INDUSTRY TRENDS COVERED IN THE REPORT.
7. Are there any restraints impacting market growth?
Supplement Consumption and Their Side-effects; Inclination Towards Substitute Products.
8. Can you provide examples of recent developments in the market?
May 2023: Trident Seafood Corporation has collaborated with Copper River Prince William Sound Marketing Association to introduce new Prized Fish product range in the United Staes Market.April 2023: Inland Seafood opened a new facility of its own in Jefferson Parish. They invested approximately USD 4 million in order to purchase and renovate a 14,000-square-foot facility in Elmwood, bringing 55 jobs to Jefferson Parish.January 2023: In order to expand their operations in the western part of the United States Inland Seafood acquired Texas-based Lonestar Seafood. The Texas-based supplier is famous for the quality of lobsters they supply.
9. What pricing options are available for accessing the report?
Pricing options include single-user, multi-user, and enterprise licenses priced at USD 3800, USD 4500, and USD 5800 respectively.
10. Is the market size provided in terms of value or volume?
The market size is provided in terms of value, measured in billion.
11. Are there any specific market keywords associated with the report?
Yes, the market keyword associated with the report is "Fish and Seafood Industry in US," which aids in identifying and referencing the specific market segment covered.
12. How do I determine which pricing option suits my needs best?
The pricing options vary based on user requirements and access needs. Individual users may opt for single-user licenses, while businesses requiring broader access may choose multi-user or enterprise licenses for cost-effective access to the report.
13. Are there any additional resources or data provided in the Fish and Seafood Industry in US report?
While the report offers comprehensive insights, it's advisable to review the specific contents or supplementary materials provided to ascertain if additional resources or data are available.
14. How can I stay updated on further developments or reports in the Fish and Seafood Industry in US?
To stay informed about further developments, trends, and reports in the Fish and Seafood Industry in US, consider subscribing to industry newsletters, following relevant companies and organizations, or regularly checking reputable industry news sources and publications.
Methodology
Step 1 - Identification of Relevant Samples Size from Population Database


Step 2 - Approaches for Defining Global Market Size (Value, Volume* & Price*)

Note*: In applicable scenarios
Step 3 - Data Sources
Primary Research
- Web Analytics
- Survey Reports
- Research Institute
- Latest Research Reports
- Opinion Leaders
Secondary Research
- Annual Reports
- White Paper
- Latest Press Release
- Industry Association
- Paid Database
- Investor Presentations

Step 4 - Data Triangulation
Involves using different sources of information in order to increase the validity of a study
These sources are likely to be stakeholders in a program - participants, other researchers, program staff, other community members, and so on.
Then we put all data in single framework & apply various statistical tools to find out the dynamic on the market.
During the analysis stage, feedback from the stakeholder groups would be compared to determine areas of agreement as well as areas of divergence