

Key Insights
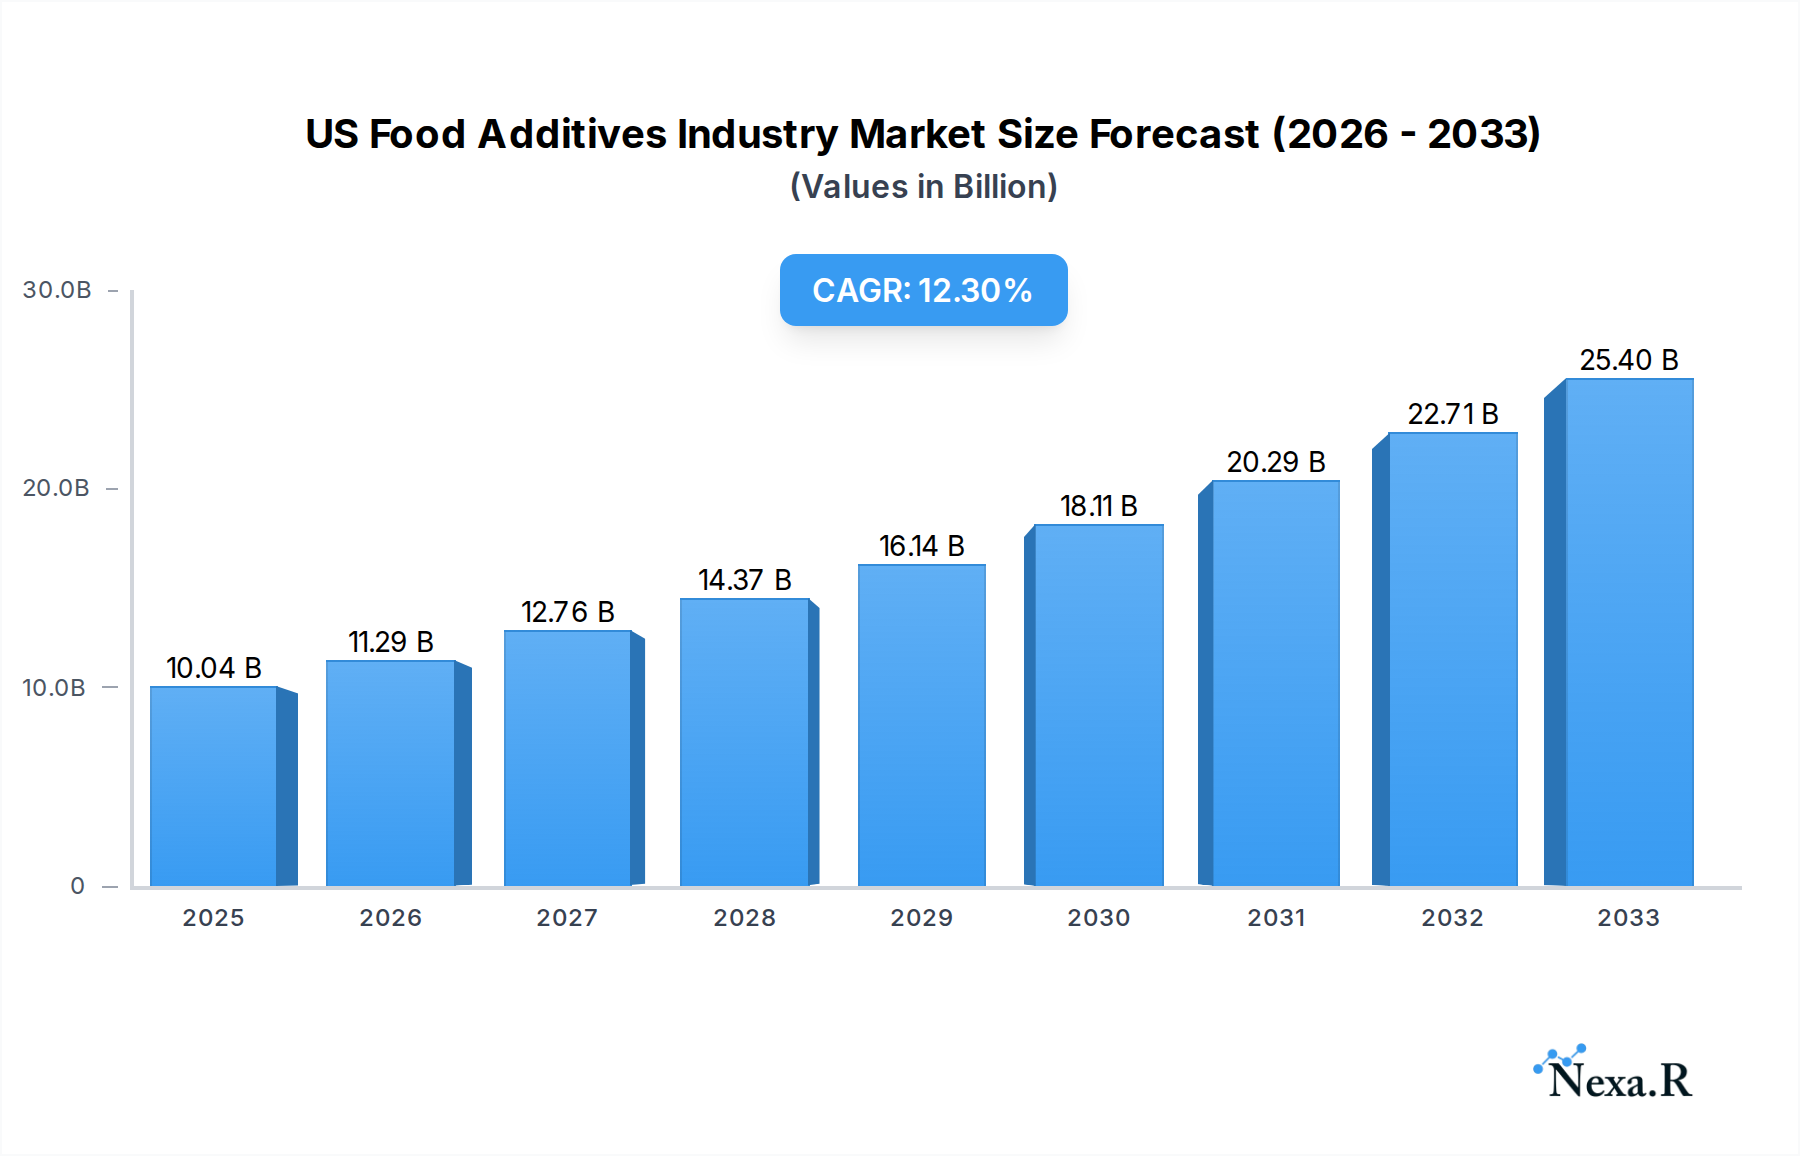
The US food additives market is projected to reach a substantial $10.04 billion in 2025, driven by an impressive compound annual growth rate (CAGR) of 12.57%. This robust expansion is fueled by evolving consumer preferences for processed and convenience foods, necessitating a wider array of additives for preservation, texture enhancement, and flavor development. Growing demand for natural and clean-label ingredients is also shaping product development, pushing innovation in functional additives. The confectionery and bakery sectors are significant contributors to market growth, alongside the expanding dairy and frozen food segments. Advancements in food technology and an increasing focus on food safety and shelf-life extension further underpin this upward trajectory.

US Food Additives Industry Market Size (In Billion)
The market's dynamism is also influenced by strategic initiatives from leading players like DuPont-Danisco, Cargill Incorporated, and Novozymes, who are actively investing in research and development to offer novel solutions. Key trends include the rising popularity of sugar substitutes and natural sweeteners, driven by health-conscious consumers and increasing awareness of the detrimental effects of excessive sugar consumption. The demand for emulsifiers and hydrocolloids is also on the rise, as they play a crucial role in improving the texture and stability of various food products. Despite the overall positive outlook, challenges such as stringent regulatory frameworks and fluctuating raw material prices present potential restraints, requiring manufacturers to adapt their strategies to maintain competitive advantage and ensure sustained growth in this vital industry segment.
US Food Additives Industry Company Market Share
Unleash the Power of the US Food Additives Market: A Comprehensive Report [2019–2033]
This in-depth report provides an indispensable analysis of the US Food Additives Industry, offering critical insights into market dynamics, growth trajectories, and future potential from 2019 to 2033. With the base year set at 2025 and an extensive forecast period from 2025 to 2033, this research equips industry professionals, investors, and stakeholders with the data-driven intelligence needed to navigate this rapidly evolving sector. Dive deep into the parent and child market structures, understanding how segments like Preservatives, Sweeteners, and Enzymes, alongside applications in Confectionery, Bakery Products, and Dairy & Frozen Food, are shaping the landscape. All values are presented in billions of US dollars for clarity and strategic decision-making.
US Food Additives Industry Market Dynamics & Structure
The US food additives market is characterized by a moderately concentrated structure, with leading players leveraging technological innovation and strategic acquisitions to maintain a competitive edge. Key drivers for technological advancement include the growing demand for clean label solutions, enhanced food preservation, and improved sensory attributes. Regulatory frameworks, spearheaded by the FDA, play a crucial role in shaping product development and market access, influencing ingredient safety and labeling practices. The presence of robust competitive product substitutes, particularly from natural sources, presents both a challenge and an opportunity for synthetic additive manufacturers. End-user demographics are increasingly influenced by health-conscious consumers seeking reduced sugar, artificial ingredient-free, and sustainable options. Mergers and acquisitions (M&A) trends are actively reshaping the industry landscape, facilitating market consolidation and the expansion of product portfolios. For instance, the acquisition of Tate & Lyle by Symrise in 2021 exemplifies this trend, signaling a strategic move to enhance market reach and technological capabilities.
- Market Concentration: Moderate, with a mix of large multinational corporations and specialized niche players.
- Technological Innovation Drivers: Clean label movement, natural ingredient trends, demand for enhanced shelf-life, and improved functionality.
- Regulatory Frameworks: Strict FDA guidelines for safety, efficacy, and labeling are paramount.
- Competitive Product Substitutes: Growing adoption of natural alternatives, functional ingredients, and food processing technologies.
- End-User Demographics: Increasing demand for healthier, transparent, and sustainably sourced food products.
- M&A Trends: Active consolidation to gain market share, access new technologies, and expand product offerings. For example, the acquisition of Tate & Lyle by Symrise in 2021.
US Food Additives Industry Growth Trends & Insights
The US food additives industry is poised for robust growth, driven by evolving consumer preferences, technological advancements, and an expanding food processing sector. The market size is projected to witness a significant expansion, fueled by the increasing demand for convenience, improved food safety, and enhanced sensory appeal in a wide array of food and beverage products. Adoption rates for innovative food additives, particularly those catering to clean label and plant-based trends, are accelerating. Technological disruptions, such as advancements in enzyme technology and fermentation processes, are enabling the development of novel, high-performance additives. Consumer behavior shifts are playing a pivotal role, with a growing emphasis on health and wellness influencing purchasing decisions. This translates into higher demand for sugar substitutes, natural preservatives, and functional ingredients that offer perceived health benefits. The market penetration of specialized additives, like hydrocolloids for texture modification and food colorants derived from natural sources, is also on the rise. This dynamic interplay of factors is expected to propel a healthy Compound Annual Growth Rate (CAGR) over the forecast period. The launch of new preservative-free, clean label additives by Cargill in 2022 underscores this industry-wide commitment to meeting consumer demands for healthier options.
Dominant Regions, Countries, or Segments in US Food Additives Industry
The US Food Additives Industry demonstrates significant growth, with the Preservatives segment emerging as a dominant force. This leadership is propelled by the constant need to extend shelf-life, reduce food waste, and ensure food safety across a vast and diverse food supply chain. The increasing consumption of processed and packaged foods, coupled with stringent food safety regulations, further bolsters the demand for effective preservatives. Within the broader Type segment, Sweeteners and Sugar Substitutes are also experiencing substantial growth, directly influenced by global health trends and the rising prevalence of obesity and diabetes. Consumers are actively seeking reduced-calorie or sugar-free alternatives, driving innovation and market expansion in this sub-segment.
In terms of application, the Bakery Products sector consistently leads in the consumption of a wide range of food additives. Additives like emulsifiers, anti-caking agents, and hydrocolloids are crucial for texture, stability, and processing efficiency in baked goods. The Dairy & Frozen Food segment also represents a significant market share due to the extensive use of stabilizers, emulsifiers, and flavor enhancers to maintain product quality and appeal. Furthermore, the Beverages sector, encompassing everything from soft drinks to functional beverages, relies heavily on acidulants, food colorants, and sweeteners to achieve desired taste profiles and visual appeal.
Key drivers underpinning the dominance of these segments include:
- Economic Policies: Favorable policies supporting food manufacturing and agricultural production indirectly boost additive consumption.
- Infrastructure: A robust supply chain and distribution network ensures the efficient delivery of additives to food manufacturers nationwide.
- Consumer Demand: The unwavering demand for processed foods, convenience, and healthier alternatives directly fuels additive usage.
- Technological Advancements: Innovations in additive production and application enhance their efficacy and appeal.
- Regulatory Compliance: Adherence to food safety standards necessitates the use of specific additives for preservation and quality control.
The market share within the Preservatives segment is substantial, estimated to be around $4.5 billion in 2025, with a projected growth rate of 4.8% CAGR. Similarly, Sweeteners and Sugar Substitutes are expected to reach $3.2 billion in 2025, driven by a CAGR of 5.5%. The Bakery Products application segment is projected to account for approximately $2.8 billion in 2025, with a CAGR of 4.2%.
US Food Additives Industry Product Landscape
The US food additives industry is characterized by continuous product innovation driven by consumer demand for healthier, more natural, and functional ingredients. Key developments include the widespread adoption of clean label additives, such as natural preservatives and plant-derived colorants, responding to consumer preferences for transparency and fewer artificial ingredients. Advanced enzyme technologies are revolutionizing texture modification and flavor enhancement in products like dairy and bakery items. The performance of these additives is measured by their efficacy in preservation, sensory improvement, and processing efficiency, with manufacturers increasingly focusing on sustainability and allergen-free formulations. Unique selling propositions often lie in the origin of the ingredient (e.g., fermentation-derived, plant-based), its functional benefits (e.g., extended shelf-life, improved mouthfeel), and its contribution to healthier food profiles. Technological advancements are enabling the creation of highly concentrated and synergistic additive blends, offering greater value and performance to food manufacturers.
Key Drivers, Barriers & Challenges in US Food Additives Industry
The US food additives industry is propelled by several key drivers, including the relentless pursuit of extended shelf-life and reduced food waste, the growing consumer demand for healthier food options like sugar substitutes and natural preservatives, and continuous technological advancements in ingredient functionality. The increasing globalization of food supply chains also necessitates reliable additives for quality maintenance.
However, the industry faces significant barriers and challenges. Stringent regulatory scrutiny and evolving labeling requirements pose hurdles for new product development and market entry. Supply chain disruptions, as witnessed in recent years, can impact the availability and cost of raw materials. Furthermore, the growing consumer perception of "chemical" ingredients, despite their safety and regulatory approval, creates a demand for "natural" alternatives, pressuring manufacturers to reformulate. Competitive pressures from both established players and emerging natural ingredient suppliers intensify the challenge of maintaining market share and profitability.
Emerging Opportunities in US Food Additives Industry
Emerging opportunities within the US food additives industry are primarily centered around the booming plant-based food sector, where innovative ingredients are needed to replicate textures, flavors, and functionalities of traditional animal-derived products. The increasing consumer focus on gut health presents a significant opportunity for functional additives that promote digestive wellness. Furthermore, the demand for personalized nutrition is opening avenues for specialized additive formulations tailored to specific dietary needs and health goals. The development of biodegradable and sustainably sourced additives also aligns with growing environmental consciousness and offers a competitive advantage.
Growth Accelerators in the US Food Additives Industry Industry
Long-term growth in the US food additives industry will be significantly accelerated by ongoing research and development into novel fermentation technologies, enabling the production of a wider range of bio-based ingredients. Strategic partnerships between ingredient suppliers and food manufacturers are crucial for co-creating innovative solutions that address specific market needs. Expansion into emerging markets within the US food sector, such as the growing demand for clean label ingredients in institutional food services and convenience foods, will also act as a catalyst. Furthermore, the investment in plant-based food additives by companies like DuPont-Danisco in 2023 signals a strong commitment to future growth trends.
Key Players Shaping the US Food Additives Industry Market
- Dupont- Danisco
- Cargill Incorporated
- Novozymes
- Kerry Inc
- Archer Daniels Midland Company
- Koninklijke DSM N V
- Corbion NV
- Tate & Lyle
Notable Milestones in US Food Additives Industry Sector
- 2021: Acquisition of Tate & Lyle by Symrise, a significant consolidation move that reshaped market dynamics and expanded product portfolios.
- 2022: Launch of new preservative-free, clean label additives by Cargill, reflecting a strong response to growing consumer demand for healthier and more transparent food options.
- 2023: Investment in plant-based food additives by DuPont-Danisco, highlighting a strategic focus on future growth areas and sustainable ingredient development.
In-Depth US Food Additives Industry Market Outlook
The outlook for the US food additives industry remains exceptionally bright, fueled by a potent combination of evolving consumer preferences and technological advancements. The persistent demand for clean label ingredients, natural preservatives, and sugar substitutes will continue to drive innovation and market expansion. The burgeoning plant-based food sector presents a substantial growth frontier, requiring novel additive solutions to enhance product appeal and functionality. Furthermore, the increasing emphasis on functional foods and personalized nutrition offers fertile ground for specialized ingredient development. Strategic investments in R&D, particularly in fermentation technologies and bio-based ingredients, alongside collaborative partnerships across the value chain, will be crucial for unlocking future market potential and achieving sustainable growth in this dynamic industry.
US Food Additives Industry Segmentation
-
1. Type
- 1.1. Preservatives
- 1.2. Sweetener
- 1.3. Sugar Substitutes
- 1.4. Emulsifier
- 1.5. Anti-Caking Agents
- 1.6. Enzymes
- 1.7. Hydrocolloids
- 1.8. Food Flavors and Enhancers
- 1.9. Food Colorants
- 1.10. Acidulants
-
2. Application
- 2.1. Confectionery
- 2.2. Bakery Products
- 2.3. Dairy & Frozen Food
- 2.4. Beverages
- 2.5. Meat, Poultry, and Sea Food
- 2.6. Others
US Food Additives Industry Segmentation By Geography
-
1. North America
- 1.1. United States
- 1.2. Canada
- 1.3. Mexico
-
2. South America
- 2.1. Brazil
- 2.2. Argentina
- 2.3. Rest of South America
-
3. Europe
- 3.1. United Kingdom
- 3.2. Germany
- 3.3. France
- 3.4. Italy
- 3.5. Spain
- 3.6. Russia
- 3.7. Benelux
- 3.8. Nordics
- 3.9. Rest of Europe
-
4. Middle East & Africa
- 4.1. Turkey
- 4.2. Israel
- 4.3. GCC
- 4.4. North Africa
- 4.5. South Africa
- 4.6. Rest of Middle East & Africa
-
5. Asia Pacific
- 5.1. China
- 5.2. India
- 5.3. Japan
- 5.4. South Korea
- 5.5. ASEAN
- 5.6. Oceania
- 5.7. Rest of Asia Pacific

US Food Additives Industry Regional Market Share
Geographic Coverage of US Food Additives Industry
US Food Additives Industry REPORT HIGHLIGHTS
| Aspects | Details |
|---|---|
| Study Period | 2020-2034 |
| Base Year | 2025 |
| Estimated Year | 2026 |
| Forecast Period | 2026-2034 |
| Historical Period | 2020-2025 |
| Growth Rate | CAGR of 5.9% from 2020-2034 |
| Segmentation |
|
Table of Contents
- 1. Introduction
- 1.1. Research Scope
- 1.2. Market Segmentation
- 1.3. Research Objective
- 1.4. Definitions and Assumptions
- 2. Executive Summary
- 2.1. Market Snapshot
- 3. Market Dynamics
- 3.1. Market Drivers
- 3.2. Market Restrains
- 3.3. Market Trends
- 3.4. Market Opportunities
- 4. Market Factor Analysis
- 4.1. Porters Five Forces
- 4.1.1. Bargaining Power of Suppliers
- 4.1.2. Bargaining Power of Buyers
- 4.1.3. Threat of New Entrants
- 4.1.4. Threat of Substitutes
- 4.1.5. Competitive Rivalry
- 4.2. PESTEL analysis
- 4.3. BCG Analysis
- 4.3.1. Stars (High Growth, High Market Share)
- 4.3.2. Cash Cows (Low Growth, High Market Share)
- 4.3.3. Question Mark (High Growth, Low Market Share)
- 4.3.4. Dogs (Low Growth, Low Market Share)
- 4.4. Ansoff Matrix Analysis
- 4.5. Supply Chain Analysis
- 4.6. Regulatory Landscape
- 4.7. Current Market Potential and Opportunity Assessment (TAM–SAM–SOM Framework)
- 4.8. NRP Analyst Note
- 4.1. Porters Five Forces
- 5. Market Analysis, Insights and Forecast 2021-2033
- 5.1. Market Analysis, Insights and Forecast - by Type
- 5.1.1. Preservatives
- 5.1.2. Sweetener
- 5.1.3. Sugar Substitutes
- 5.1.4. Emulsifier
- 5.1.5. Anti-Caking Agents
- 5.1.6. Enzymes
- 5.1.7. Hydrocolloids
- 5.1.8. Food Flavors and Enhancers
- 5.1.9. Food Colorants
- 5.1.10. Acidulants
- 5.2. Market Analysis, Insights and Forecast - by Application
- 5.2.1. Confectionery
- 5.2.2. Bakery Products
- 5.2.3. Dairy & Frozen Food
- 5.2.4. Beverages
- 5.2.5. Meat, Poultry, and Sea Food
- 5.2.6. Others
- 5.3. Market Analysis, Insights and Forecast - by Region
- 5.3.1. North America
- 5.3.2. South America
- 5.3.3. Europe
- 5.3.4. Middle East & Africa
- 5.3.5. Asia Pacific
- 5.1. Market Analysis, Insights and Forecast - by Type
- 6. Global US Food Additives Industry Analysis, Insights and Forecast, 2021-2033
- 6.1. Market Analysis, Insights and Forecast - by Type
- 6.1.1. Preservatives
- 6.1.2. Sweetener
- 6.1.3. Sugar Substitutes
- 6.1.4. Emulsifier
- 6.1.5. Anti-Caking Agents
- 6.1.6. Enzymes
- 6.1.7. Hydrocolloids
- 6.1.8. Food Flavors and Enhancers
- 6.1.9. Food Colorants
- 6.1.10. Acidulants
- 6.2. Market Analysis, Insights and Forecast - by Application
- 6.2.1. Confectionery
- 6.2.2. Bakery Products
- 6.2.3. Dairy & Frozen Food
- 6.2.4. Beverages
- 6.2.5. Meat, Poultry, and Sea Food
- 6.2.6. Others
- 6.1. Market Analysis, Insights and Forecast - by Type
- 7. North America US Food Additives Industry Analysis, Insights and Forecast, 2020-2032
- 7.1. Market Analysis, Insights and Forecast - by Type
- 7.1.1. Preservatives
- 7.1.2. Sweetener
- 7.1.3. Sugar Substitutes
- 7.1.4. Emulsifier
- 7.1.5. Anti-Caking Agents
- 7.1.6. Enzymes
- 7.1.7. Hydrocolloids
- 7.1.8. Food Flavors and Enhancers
- 7.1.9. Food Colorants
- 7.1.10. Acidulants
- 7.2. Market Analysis, Insights and Forecast - by Application
- 7.2.1. Confectionery
- 7.2.2. Bakery Products
- 7.2.3. Dairy & Frozen Food
- 7.2.4. Beverages
- 7.2.5. Meat, Poultry, and Sea Food
- 7.2.6. Others
- 7.1. Market Analysis, Insights and Forecast - by Type
- 8. South America US Food Additives Industry Analysis, Insights and Forecast, 2020-2032
- 8.1. Market Analysis, Insights and Forecast - by Type
- 8.1.1. Preservatives
- 8.1.2. Sweetener
- 8.1.3. Sugar Substitutes
- 8.1.4. Emulsifier
- 8.1.5. Anti-Caking Agents
- 8.1.6. Enzymes
- 8.1.7. Hydrocolloids
- 8.1.8. Food Flavors and Enhancers
- 8.1.9. Food Colorants
- 8.1.10. Acidulants
- 8.2. Market Analysis, Insights and Forecast - by Application
- 8.2.1. Confectionery
- 8.2.2. Bakery Products
- 8.2.3. Dairy & Frozen Food
- 8.2.4. Beverages
- 8.2.5. Meat, Poultry, and Sea Food
- 8.2.6. Others
- 8.1. Market Analysis, Insights and Forecast - by Type
- 9. Europe US Food Additives Industry Analysis, Insights and Forecast, 2020-2032
- 9.1. Market Analysis, Insights and Forecast - by Type
- 9.1.1. Preservatives
- 9.1.2. Sweetener
- 9.1.3. Sugar Substitutes
- 9.1.4. Emulsifier
- 9.1.5. Anti-Caking Agents
- 9.1.6. Enzymes
- 9.1.7. Hydrocolloids
- 9.1.8. Food Flavors and Enhancers
- 9.1.9. Food Colorants
- 9.1.10. Acidulants
- 9.2. Market Analysis, Insights and Forecast - by Application
- 9.2.1. Confectionery
- 9.2.2. Bakery Products
- 9.2.3. Dairy & Frozen Food
- 9.2.4. Beverages
- 9.2.5. Meat, Poultry, and Sea Food
- 9.2.6. Others
- 9.1. Market Analysis, Insights and Forecast - by Type
- 10. Middle East & Africa US Food Additives Industry Analysis, Insights and Forecast, 2020-2032
- 10.1. Market Analysis, Insights and Forecast - by Type
- 10.1.1. Preservatives
- 10.1.2. Sweetener
- 10.1.3. Sugar Substitutes
- 10.1.4. Emulsifier
- 10.1.5. Anti-Caking Agents
- 10.1.6. Enzymes
- 10.1.7. Hydrocolloids
- 10.1.8. Food Flavors and Enhancers
- 10.1.9. Food Colorants
- 10.1.10. Acidulants
- 10.2. Market Analysis, Insights and Forecast - by Application
- 10.2.1. Confectionery
- 10.2.2. Bakery Products
- 10.2.3. Dairy & Frozen Food
- 10.2.4. Beverages
- 10.2.5. Meat, Poultry, and Sea Food
- 10.2.6. Others
- 10.1. Market Analysis, Insights and Forecast - by Type
- 11. Asia Pacific US Food Additives Industry Analysis, Insights and Forecast, 2020-2032
- 11.1. Market Analysis, Insights and Forecast - by Type
- 11.1.1. Preservatives
- 11.1.2. Sweetener
- 11.1.3. Sugar Substitutes
- 11.1.4. Emulsifier
- 11.1.5. Anti-Caking Agents
- 11.1.6. Enzymes
- 11.1.7. Hydrocolloids
- 11.1.8. Food Flavors and Enhancers
- 11.1.9. Food Colorants
- 11.1.10. Acidulants
- 11.2. Market Analysis, Insights and Forecast - by Application
- 11.2.1. Confectionery
- 11.2.2. Bakery Products
- 11.2.3. Dairy & Frozen Food
- 11.2.4. Beverages
- 11.2.5. Meat, Poultry, and Sea Food
- 11.2.6. Others
- 11.1. Market Analysis, Insights and Forecast - by Type
- 12. Competitive Analysis
- 12.1. Company Profiles
- 12.1.1 Dupont- Danisco
- 12.1.1.1. Company Overview
- 12.1.1.2. Products
- 12.1.1.3. Company Financials
- 12.1.1.4. SWOT Analysis
- 12.1.2 Cargill Incorporated
- 12.1.2.1. Company Overview
- 12.1.2.2. Products
- 12.1.2.3. Company Financials
- 12.1.2.4. SWOT Analysis
- 12.1.3 Novozymes
- 12.1.3.1. Company Overview
- 12.1.3.2. Products
- 12.1.3.3. Company Financials
- 12.1.3.4. SWOT Analysis
- 12.1.4 Kerry Inc
- 12.1.4.1. Company Overview
- 12.1.4.2. Products
- 12.1.4.3. Company Financials
- 12.1.4.4. SWOT Analysis
- 12.1.5 Archer Daniels Midland Company
- 12.1.5.1. Company Overview
- 12.1.5.2. Products
- 12.1.5.3. Company Financials
- 12.1.5.4. SWOT Analysis
- 12.1.6 Koninklijke DSM N V
- 12.1.6.1. Company Overview
- 12.1.6.2. Products
- 12.1.6.3. Company Financials
- 12.1.6.4. SWOT Analysis
- 12.1.7 Corbion NV
- 12.1.7.1. Company Overview
- 12.1.7.2. Products
- 12.1.7.3. Company Financials
- 12.1.7.4. SWOT Analysis
- 12.1.8 Tate & Lyle
- 12.1.8.1. Company Overview
- 12.1.8.2. Products
- 12.1.8.3. Company Financials
- 12.1.8.4. SWOT Analysis
- 12.1.1 Dupont- Danisco
- 12.2. Market Entropy
- 12.2.1 Company's Key Areas Served
- 12.2.2 Recent Developments
- 12.3. Company Market Share Analysis 2025
- 12.3.1 Top 5 Companies Market Share Analysis
- 12.3.2 Top 3 Companies Market Share Analysis
- 12.4. List of Potential Customers
- 13. Research Methodology
List of Figures
- Figure 1: Global US Food Additives Industry Revenue Breakdown (billion, %) by Region 2025 & 2033
- Figure 2: North America US Food Additives Industry Revenue (billion), by Type 2025 & 2033
- Figure 3: North America US Food Additives Industry Revenue Share (%), by Type 2025 & 2033
- Figure 4: North America US Food Additives Industry Revenue (billion), by Application 2025 & 2033
- Figure 5: North America US Food Additives Industry Revenue Share (%), by Application 2025 & 2033
- Figure 6: North America US Food Additives Industry Revenue (billion), by Country 2025 & 2033
- Figure 7: North America US Food Additives Industry Revenue Share (%), by Country 2025 & 2033
- Figure 8: South America US Food Additives Industry Revenue (billion), by Type 2025 & 2033
- Figure 9: South America US Food Additives Industry Revenue Share (%), by Type 2025 & 2033
- Figure 10: South America US Food Additives Industry Revenue (billion), by Application 2025 & 2033
- Figure 11: South America US Food Additives Industry Revenue Share (%), by Application 2025 & 2033
- Figure 12: South America US Food Additives Industry Revenue (billion), by Country 2025 & 2033
- Figure 13: South America US Food Additives Industry Revenue Share (%), by Country 2025 & 2033
- Figure 14: Europe US Food Additives Industry Revenue (billion), by Type 2025 & 2033
- Figure 15: Europe US Food Additives Industry Revenue Share (%), by Type 2025 & 2033
- Figure 16: Europe US Food Additives Industry Revenue (billion), by Application 2025 & 2033
- Figure 17: Europe US Food Additives Industry Revenue Share (%), by Application 2025 & 2033
- Figure 18: Europe US Food Additives Industry Revenue (billion), by Country 2025 & 2033
- Figure 19: Europe US Food Additives Industry Revenue Share (%), by Country 2025 & 2033
- Figure 20: Middle East & Africa US Food Additives Industry Revenue (billion), by Type 2025 & 2033
- Figure 21: Middle East & Africa US Food Additives Industry Revenue Share (%), by Type 2025 & 2033
- Figure 22: Middle East & Africa US Food Additives Industry Revenue (billion), by Application 2025 & 2033
- Figure 23: Middle East & Africa US Food Additives Industry Revenue Share (%), by Application 2025 & 2033
- Figure 24: Middle East & Africa US Food Additives Industry Revenue (billion), by Country 2025 & 2033
- Figure 25: Middle East & Africa US Food Additives Industry Revenue Share (%), by Country 2025 & 2033
- Figure 26: Asia Pacific US Food Additives Industry Revenue (billion), by Type 2025 & 2033
- Figure 27: Asia Pacific US Food Additives Industry Revenue Share (%), by Type 2025 & 2033
- Figure 28: Asia Pacific US Food Additives Industry Revenue (billion), by Application 2025 & 2033
- Figure 29: Asia Pacific US Food Additives Industry Revenue Share (%), by Application 2025 & 2033
- Figure 30: Asia Pacific US Food Additives Industry Revenue (billion), by Country 2025 & 2033
- Figure 31: Asia Pacific US Food Additives Industry Revenue Share (%), by Country 2025 & 2033
List of Tables
- Table 1: Global US Food Additives Industry Revenue billion Forecast, by Type 2020 & 2033
- Table 2: Global US Food Additives Industry Revenue billion Forecast, by Application 2020 & 2033
- Table 3: Global US Food Additives Industry Revenue billion Forecast, by Region 2020 & 2033
- Table 4: Global US Food Additives Industry Revenue billion Forecast, by Type 2020 & 2033
- Table 5: Global US Food Additives Industry Revenue billion Forecast, by Application 2020 & 2033
- Table 6: Global US Food Additives Industry Revenue billion Forecast, by Country 2020 & 2033
- Table 7: United States US Food Additives Industry Revenue (billion) Forecast, by Application 2020 & 2033
- Table 8: Canada US Food Additives Industry Revenue (billion) Forecast, by Application 2020 & 2033
- Table 9: Mexico US Food Additives Industry Revenue (billion) Forecast, by Application 2020 & 2033
- Table 10: Global US Food Additives Industry Revenue billion Forecast, by Type 2020 & 2033
- Table 11: Global US Food Additives Industry Revenue billion Forecast, by Application 2020 & 2033
- Table 12: Global US Food Additives Industry Revenue billion Forecast, by Country 2020 & 2033
- Table 13: Brazil US Food Additives Industry Revenue (billion) Forecast, by Application 2020 & 2033
- Table 14: Argentina US Food Additives Industry Revenue (billion) Forecast, by Application 2020 & 2033
- Table 15: Rest of South America US Food Additives Industry Revenue (billion) Forecast, by Application 2020 & 2033
- Table 16: Global US Food Additives Industry Revenue billion Forecast, by Type 2020 & 2033
- Table 17: Global US Food Additives Industry Revenue billion Forecast, by Application 2020 & 2033
- Table 18: Global US Food Additives Industry Revenue billion Forecast, by Country 2020 & 2033
- Table 19: United Kingdom US Food Additives Industry Revenue (billion) Forecast, by Application 2020 & 2033
- Table 20: Germany US Food Additives Industry Revenue (billion) Forecast, by Application 2020 & 2033
- Table 21: France US Food Additives Industry Revenue (billion) Forecast, by Application 2020 & 2033
- Table 22: Italy US Food Additives Industry Revenue (billion) Forecast, by Application 2020 & 2033
- Table 23: Spain US Food Additives Industry Revenue (billion) Forecast, by Application 2020 & 2033
- Table 24: Russia US Food Additives Industry Revenue (billion) Forecast, by Application 2020 & 2033
- Table 25: Benelux US Food Additives Industry Revenue (billion) Forecast, by Application 2020 & 2033
- Table 26: Nordics US Food Additives Industry Revenue (billion) Forecast, by Application 2020 & 2033
- Table 27: Rest of Europe US Food Additives Industry Revenue (billion) Forecast, by Application 2020 & 2033
- Table 28: Global US Food Additives Industry Revenue billion Forecast, by Type 2020 & 2033
- Table 29: Global US Food Additives Industry Revenue billion Forecast, by Application 2020 & 2033
- Table 30: Global US Food Additives Industry Revenue billion Forecast, by Country 2020 & 2033
- Table 31: Turkey US Food Additives Industry Revenue (billion) Forecast, by Application 2020 & 2033
- Table 32: Israel US Food Additives Industry Revenue (billion) Forecast, by Application 2020 & 2033
- Table 33: GCC US Food Additives Industry Revenue (billion) Forecast, by Application 2020 & 2033
- Table 34: North Africa US Food Additives Industry Revenue (billion) Forecast, by Application 2020 & 2033
- Table 35: South Africa US Food Additives Industry Revenue (billion) Forecast, by Application 2020 & 2033
- Table 36: Rest of Middle East & Africa US Food Additives Industry Revenue (billion) Forecast, by Application 2020 & 2033
- Table 37: Global US Food Additives Industry Revenue billion Forecast, by Type 2020 & 2033
- Table 38: Global US Food Additives Industry Revenue billion Forecast, by Application 2020 & 2033
- Table 39: Global US Food Additives Industry Revenue billion Forecast, by Country 2020 & 2033
- Table 40: China US Food Additives Industry Revenue (billion) Forecast, by Application 2020 & 2033
- Table 41: India US Food Additives Industry Revenue (billion) Forecast, by Application 2020 & 2033
- Table 42: Japan US Food Additives Industry Revenue (billion) Forecast, by Application 2020 & 2033
- Table 43: South Korea US Food Additives Industry Revenue (billion) Forecast, by Application 2020 & 2033
- Table 44: ASEAN US Food Additives Industry Revenue (billion) Forecast, by Application 2020 & 2033
- Table 45: Oceania US Food Additives Industry Revenue (billion) Forecast, by Application 2020 & 2033
- Table 46: Rest of Asia Pacific US Food Additives Industry Revenue (billion) Forecast, by Application 2020 & 2033
Frequently Asked Questions
1. What is the projected Compound Annual Growth Rate (CAGR) of the US Food Additives Industry?
The projected CAGR is approximately 5.9%.
2. Which companies are prominent players in the US Food Additives Industry?
Key companies in the market include Dupont- Danisco, Cargill Incorporated, Novozymes, Kerry Inc, Archer Daniels Midland Company, Koninklijke DSM N V, Corbion NV, Tate & Lyle.
3. What are the main segments of the US Food Additives Industry?
The market segments include Type, Application.
4. Can you provide details about the market size?
The market size is estimated to be USD 17.8 billion as of 2022.
5. What are some drivers contributing to market growth?
Wide Applications and Functionality; Demand For Gluten-Free Products.
6. What are the notable trends driving market growth?
Growing Demand for Retail Food.
7. Are there any restraints impacting market growth?
Easy Availability of Economically Feasible Alternatives.
8. Can you provide examples of recent developments in the market?
1. Acquisition of Tate & Lyle by Symrise in 2021 2. Launch of new preservative-free, clean label additives by Cargill in 2022 3. Investment in plant-based food additives by DuPont-Danisco in 2023
9. What pricing options are available for accessing the report?
Pricing options include single-user, multi-user, and enterprise licenses priced at USD 3800, USD 4500, and USD 5800 respectively.
10. Is the market size provided in terms of value or volume?
The market size is provided in terms of value, measured in billion.
11. Are there any specific market keywords associated with the report?
Yes, the market keyword associated with the report is "US Food Additives Industry," which aids in identifying and referencing the specific market segment covered.
12. How do I determine which pricing option suits my needs best?
The pricing options vary based on user requirements and access needs. Individual users may opt for single-user licenses, while businesses requiring broader access may choose multi-user or enterprise licenses for cost-effective access to the report.
13. Are there any additional resources or data provided in the US Food Additives Industry report?
While the report offers comprehensive insights, it's advisable to review the specific contents or supplementary materials provided to ascertain if additional resources or data are available.
14. How can I stay updated on further developments or reports in the US Food Additives Industry?
To stay informed about further developments, trends, and reports in the US Food Additives Industry, consider subscribing to industry newsletters, following relevant companies and organizations, or regularly checking reputable industry news sources and publications.
Methodology
Step 1 - Identification of Relevant Samples Size from Population Database


Step 2 - Approaches for Defining Global Market Size (Value, Volume* & Price*)

Note*: In applicable scenarios
Step 3 - Data Sources
Primary Research
- Web Analytics
- Survey Reports
- Research Institute
- Latest Research Reports
- Opinion Leaders
Secondary Research
- Annual Reports
- White Paper
- Latest Press Release
- Industry Association
- Paid Database
- Investor Presentations

Step 4 - Data Triangulation
Involves using different sources of information in order to increase the validity of a study
These sources are likely to be stakeholders in a program - participants, other researchers, program staff, other community members, and so on.
Then we put all data in single framework & apply various statistical tools to find out the dynamic on the market.
During the analysis stage, feedback from the stakeholder groups would be compared to determine areas of agreement as well as areas of divergence