

Key Insights
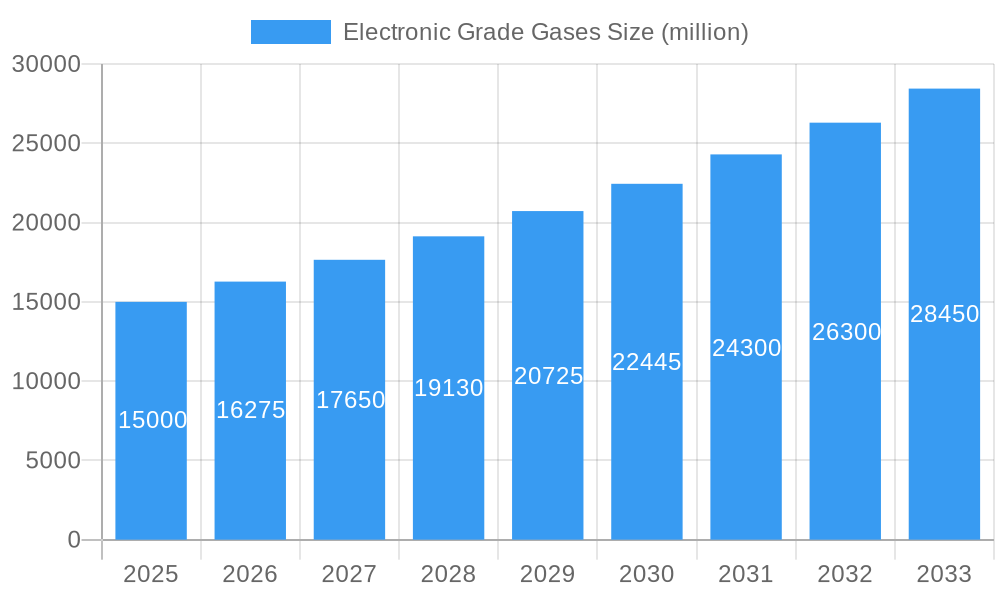
The global Electronic Grade Gases market is poised for significant expansion, projected to reach a substantial market size of approximately $15,000 million by 2025, with an estimated Compound Annual Growth Rate (CAGR) of around 8.5% over the forecast period of 2025-2033. This robust growth is underpinned by the escalating demand from critical industries such as semiconductors, displays, and photovoltaics, all of which rely heavily on these ultra-high purity gases for their manufacturing processes. The semiconductor industry, in particular, is a primary driver, fueled by the insatiable appetite for advanced microchips in consumer electronics, automotive, and telecommunications sectors. Similarly, the burgeoning display market, encompassing everything from smartphones to large-format televisions, and the rapidly growing solar energy sector also contribute significantly to market expansion. Key applications within this market include deposition, etching, doping, and lithography processes, all of which demand gases with exceptionally low impurity levels to ensure product quality and performance.
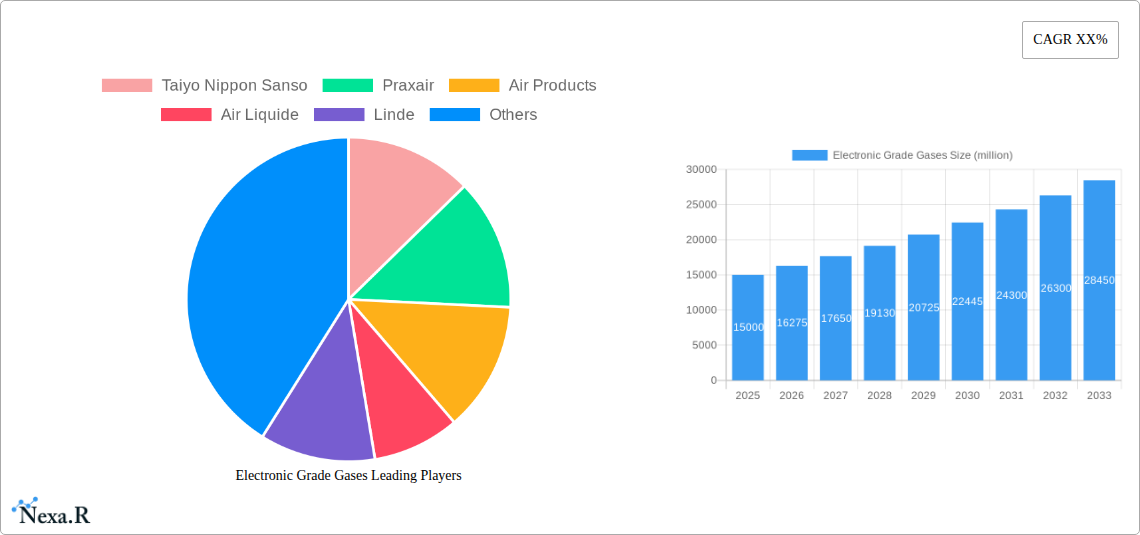
Electronic Grade Gases Market Size (In Billion)
Several key trends are shaping the electronic grade gases landscape. The increasing miniaturization and complexity of semiconductor devices necessitate the development and adoption of more specialized and advanced electronic gases. Furthermore, the growing emphasis on sustainable manufacturing practices is driving demand for greener and more environmentally friendly gas production and supply chain solutions. Geographically, the Asia Pacific region, led by China, Japan, and South Korea, is expected to dominate the market due to its extensive manufacturing base for semiconductors and electronic components. However, North America and Europe are also crucial markets, with established players and a strong focus on research and development. Restraints include the high capital investment required for advanced gas production facilities and stringent regulatory compliance associated with handling and transporting these specialized chemicals. Major players like Taiyo Nippon Sanso, Praxair, Air Products, Air Liquide, and Linde are actively investing in expanding their production capacities and R&D efforts to cater to the evolving needs of the industry.
Electronic Grade Gases Company Market Share
Electronic Grade Gases Market Dynamics & Structure
The global Electronic Grade Gases market is characterized by a moderately concentrated competitive landscape, dominated by a few major players. Companies such as Taiyo Nippon Sanso, Praxair, Air Products, Air Liquide, and Linde hold significant market share, driven by extensive R&D capabilities and established distribution networks. The industry's structure is further shaped by the increasing demand for ultra-high purity gases crucial for advanced semiconductor manufacturing processes. Technological innovation remains a primary driver, with continuous advancements in gas purification and delivery systems essential for meeting stringent application requirements. Regulatory frameworks, particularly concerning environmental standards and safety protocols for handling hazardous gases, play a vital role in market operations and product development. Competitive product substitutes are minimal due to the specialized nature of electronic grade gases, but advancements in alternative manufacturing processes could indirectly influence demand. End-user demographics are primarily concentrated within the Semiconductor Industries, Displays, and Photovoltaic sectors, with a growing influence from emerging technologies. Mergers and acquisitions (M&A) trends are observed as key players seek to expand their geographical reach, product portfolios, and technological expertise, further consolidating the market. For instance, the historical period saw M&A activity valued at approximately $1,500 million, aiming to secure market position and capitalize on synergistic benefits. Barriers to innovation include the immense capital investment required for advanced purification technologies and the long lead times for product qualification in the highly regulated electronics manufacturing sector.
- Market Concentration: Moderately concentrated with top 5 players holding over 60% market share.
- Technological Innovation Drivers: Ultra-high purity requirements, miniaturization in electronics, new material deposition techniques.
- Regulatory Frameworks: Stringent safety and environmental regulations (e.g., REACH, local environmental laws).
- Competitive Product Substitutes: Limited direct substitutes, but process innovations can impact gas demand.
- End-User Demographics: Dominated by Semiconductor Industries (XX% share), followed by Displays (XX% share) and Photovoltaic (XX% share).
- M&A Trends: Focus on acquiring advanced technology and expanding global presence.
Electronic Grade Gases Growth Trends & Insights
The Electronic Grade Gases market is poised for substantial growth, projected to evolve from an estimated $18,500 million in 2025 to an impressive $35,000 million by 2033, exhibiting a Compound Annual Growth Rate (CAGR) of approximately 7.5% during the forecast period of 2025-2033. This robust expansion is underpinned by several key trends and evolving industry dynamics. The relentless pace of innovation within the semiconductor industry, driven by the demand for more powerful and efficient electronic devices, is a primary growth engine. As chip manufacturers push the boundaries of miniaturization and complexity, the requirement for ultra-high purity gases for deposition, etching, doping, and lithography processes escalates significantly. For example, the increasing adoption of advanced node technologies in semiconductor manufacturing necessitates novel gas chemistries and improved purification techniques, directly fueling market growth.
Adoption rates for specialized electronic grade gases are climbing as new manufacturing processes are scaled up globally. The resurgence of the photovoltaic industry, coupled with the continued expansion of the display manufacturing sector, also contributes significantly to this growth trajectory. These sectors are increasingly reliant on precise gas compositions for thin-film deposition and other critical manufacturing steps. Technological disruptions, such as the development of novel precursor gases for atomic layer deposition (ALD) and new etchant gases for 3D architectures, are opening up new market avenues. Consumer behavior shifts, while indirectly impacting the market, are characterized by an insatiable demand for consumer electronics, 5G connectivity, and artificial intelligence-powered devices, all of which are direct beneficiaries of advancements in the electronics manufacturing ecosystem, thus creating a pull for electronic grade gases.
Furthermore, the increasing trend of wafer fabrication plants (fabs) being established in new geographical regions, particularly in Asia, is creating localized demand pockets and driving investment in gas supply infrastructure. The market penetration of advanced lithography techniques, such as Extreme Ultraviolet (EUV) lithography, requires highly specialized and pure gases, representing a significant opportunity for market expansion. The overall market size evolution is a clear indicator of the indispensable role electronic grade gases play in enabling the next generation of electronic technologies. Insights into adoption rates reveal that segments like Deposition and Etching are currently leading the charge, accounting for an estimated 40% and 35% of the total market share respectively in the base year of 2025, driven by their pervasive use across all major electronic applications. The market penetration of high-purity specialty gases, beyond basic inert gases, is projected to increase by over 15% during the forecast period.
Dominant Regions, Countries, or Segments in Electronic Grade Gases
The global Electronic Grade Gases market is experiencing significant growth, with the Asia Pacific region emerging as the dominant force, driven by a confluence of factors including robust manufacturing capabilities, substantial government investments, and a rapidly expanding electronics industry. Within this dynamic region, East Asia, particularly China, South Korea, and Taiwan, stands out as the primary growth engine. These countries are home to a significant concentration of world-leading semiconductor foundries and display panel manufacturers, creating an immense and ever-growing demand for electronic grade gases.
The Semiconductor Industries segment consistently leads the market, accounting for an estimated 55% of the total market share in 2025. This dominance is fueled by the continuous drive for advanced chip manufacturing, including leading-edge logic and memory devices. The intricate processes involved in semiconductor fabrication, such as deposition, etching, doping, and lithography, all rely heavily on a diverse range of ultra-high purity gases. For instance, the burgeoning demand for advanced logic chips for AI, high-performance computing, and next-generation mobile devices necessitates the use of specialized gases like silane, ammonia, nitrogen trifluoride (NF3), and various fluorocarbons.
In terms of types, Deposition and Etching gases represent the largest segments within the electronic grade gases market. Deposition gases, crucial for creating thin films of various materials on semiconductor wafers, hold an estimated 35% market share, while Etching gases, used to precisely remove unwanted material, account for approximately 30%. The ongoing development of new materials and advanced deposition techniques, such as Atomic Layer Deposition (ALD) and Chemical Vapor Deposition (CVD), are key drivers for this segment. Similarly, the increasing complexity of chip architectures, requiring finer feature sizes and intricate 3D structures, escalates the demand for highly selective and anisotropic etching gases.
Key Drivers in the Dominant Asia Pacific Region:
- Economic Policies and Incentives: Governments in countries like China and South Korea offer substantial subsidies and tax incentives to bolster domestic semiconductor manufacturing, attracting significant foreign investment and driving local production.
- Infrastructure Development: Extensive investments in industrial parks and specialized manufacturing facilities provide the necessary ecosystem for large-scale electronic component production.
- Presence of Major Manufacturers: The concentration of global semiconductor giants like Samsung, TSMC, and SK Hynix in this region creates a consistent and high-volume demand for electronic grade gases.
- Growing Domestic Consumption: A burgeoning middle class and a strong domestic market for consumer electronics further fuels the demand for semiconductors and, consequently, electronic grade gases.
- Technological Advancements: Continuous research and development in semiconductor manufacturing processes, particularly in China, are leading to the increased adoption of advanced and specialized gases.
Market Share and Growth Potential: The Asia Pacific region is projected to maintain its dominant position, expected to capture over 70% of the global electronic grade gases market share by 2033. Its growth potential is further amplified by the ongoing global supply chain diversification efforts, which are leading to increased investments in manufacturing capacity within the region. The Photovoltaic segment, while currently smaller than Semiconductor Industries and Displays, is also experiencing accelerated growth in Asia, especially in China, driven by government support for renewable energy initiatives.
Electronic Grade Gases Product Landscape
The product landscape of Electronic Grade Gases is defined by an unwavering commitment to ultra-high purity and stringent quality control. Innovations are primarily focused on enhancing gas purity levels, often reaching parts per billion (ppb) or even parts per trillion (ppt) levels, to meet the exacting demands of advanced semiconductor manufacturing. This includes the development of novel purification techniques and advanced analytical instrumentation to verify purity. Key product innovations are seen in the development of specialty gases for specific applications, such as advanced etchants for sub-10nm lithography, precursor gases for novel material deposition in ALD and CVD, and ultra-pure dopant gases for precise semiconductor doping. Performance metrics are critically evaluated based on purity, consistency, low particle counts, and minimal metallic impurities. Unique selling propositions often lie in the proprietary purification processes, the ability to provide custom gas blends, and reliable, traceable supply chains. Technological advancements are also geared towards minimizing the environmental impact of gas production and delivery.
Key Drivers, Barriers & Challenges in Electronic Grade Gases
Key Drivers:
- Exponential Growth in Semiconductor Demand: The relentless expansion of end-user applications like 5G, AI, IoT, and electric vehicles directly fuels the need for advanced semiconductors, thus driving demand for electronic grade gases.
- Miniaturization and Complexity in Chip Design: As transistors shrink and chip architectures become more intricate, the requirement for ultra-high purity gases in processes like etching, deposition, and doping escalates.
- Technological Advancements in Manufacturing Processes: The adoption of new manufacturing techniques such as Atomic Layer Deposition (ALD), Extreme Ultraviolet (EUV) lithography, and advanced 3D NAND flash memory necessitates specialized and highly pure gases.
- Government Support and Investments: Favorable government policies and substantial investments in the semiconductor industry in key regions like Asia Pacific are creating significant demand for electronic grade gases.
Barriers & Challenges:
- High Capital Investment for Purification and Production: Achieving and maintaining ultra-high purity levels requires significant investment in advanced purification technologies, specialized production facilities, and stringent quality control measures, posing a substantial barrier for new entrants.
- Supply Chain Volatility and Geopolitical Risks: The global supply chain for critical raw materials and manufacturing equipment for electronic grade gases can be susceptible to disruptions due to geopolitical tensions, trade policies, and natural disasters, impacting availability and pricing.
- Stringent Regulatory and Safety Compliance: Handling and transporting hazardous electronic grade gases necessitates strict adherence to international and local safety regulations, increasing operational costs and complexity.
- Intellectual Property Protection and Technology Leakage: The highly specialized nature of gas chemistries and purification processes makes intellectual property protection a significant challenge, with the risk of technology leakage impacting competitive advantage.
- Skilled Workforce Shortage: The industry requires a highly skilled workforce for R&D, production, and quality control, and a shortage of such talent can impede growth and innovation.
Emerging Opportunities in Electronic Grade Gases
Emerging opportunities in the Electronic Grade Gases market are primarily driven by the rapid evolution of new electronic technologies and advanced manufacturing processes. The increasing adoption of next-generation memory technologies such as 3D XPoint and emerging non-volatile memory solutions presents a significant opportunity for specialized gases. Furthermore, the burgeoning advanced packaging technologies, which integrate multiple chips into a single package, require novel gas chemistries for deposition and bonding processes. The expansion of the metaverse and augmented/virtual reality (AR/VR) markets will necessitate more powerful and compact computing hardware, creating demand for advanced semiconductor manufacturing and, consequently, higher purity gases. The growing focus on sustainable manufacturing practices is also opening doors for the development of environmentally friendly gas alternatives and more efficient gas recycling and recovery systems. The expansion of semiconductor manufacturing in new geographical regions, such as India and parts of Southeast Asia, presents untapped market potential for gas suppliers.
Growth Accelerators in the Electronic Grade Gases Industry
Several key catalysts are accelerating the long-term growth of the Electronic Grade Gases industry. The continuous push for Moore's Law extensions and the development of new semiconductor materials like 2D materials and advanced compound semiconductors are creating demand for an expanded portfolio of highly specialized gases. Strategic partnerships between gas suppliers and semiconductor manufacturers are crucial for co-developing and qualifying new gas solutions for emerging manufacturing processes. Market expansion strategies, including building new production facilities in close proximity to major fab clusters and establishing robust global supply chains, are essential for meeting escalating demand. The increasing adoption of digitalization and automation in gas production and delivery systems is enhancing efficiency, reducing costs, and improving product consistency. Investments in research and development for novel purification technologies and gas chemistries will be critical for staying ahead of the innovation curve and capturing future market share.
Key Players Shaping the Electronic Grade Gases Market
- Taiyo Nippon Sanso
- Praxair
- Air Products
- Air Liquide
- Linde
- Yingde Gases
- Sumitomo Seika Chemicals
- Hangzhou Hangyang
- Suzhou Jinhong Gas
- Showa Denko
- REC
Notable Milestones in Electronic Grade Gases Sector
- 2019: Launch of new ultra-high purity nitrogen trifluoride (NF3) grades for advanced etching applications by major manufacturers.
- 2020: Increased M&A activity as companies sought to consolidate market share and expand technological capabilities. For example, a significant acquisition in the US electronic gas market valued at approximately $800 million.
- 2021: Growing demand for specialty gases to support the expansion of memory chip production, particularly for 3D NAND and DRAM technologies.
- 2022: Significant investments in expanding production capacity for critical etching and deposition gases in Southeast Asia to support the diversification of global supply chains.
- 2023: Introduction of novel precursor gases for Atomic Layer Deposition (ALD) to enable the manufacturing of next-generation display technologies.
- 2024: Heightened focus on sustainability initiatives, with manufacturers exploring more energy-efficient gas production methods and advanced recycling solutions.
In-Depth Electronic Grade Gases Market Outlook
The future outlook for the Electronic Grade Gases market is exceptionally bright, driven by an unyielding demand for advanced electronic components. The market's growth trajectory is firmly anchored by the continued innovation in semiconductor technology, the expansion of the display and photovoltaic sectors, and the emergence of new frontiers like AI and the metaverse. Strategic investments in R&D for novel gas chemistries and purification techniques, coupled with the establishment of resilient and localized supply chains, will be paramount for success. Opportunities abound for companies that can offer not only ultra-high purity gases but also comprehensive solutions including safe delivery, on-site supply, and responsible disposal. The increasing focus on environmental sustainability will also shape future product development and market strategies, favoring suppliers who can demonstrate eco-friendly manufacturing processes. The projected market size of $35,000 million by 2033 underscores the critical and growing importance of electronic grade gases in enabling the digital future.
Electronic Grade Gases Segmentation
-
1. Application
- 1.1. Semiconductor Industries
- 1.2. Displays
- 1.3. Photovoltaic
- 1.4. Others
-
2. Types
- 2.1. Deposition
- 2.2. Etching
- 2.3. Doping
- 2.4. Lithography
Electronic Grade Gases Segmentation By Geography
-
1. North America
- 1.1. United States
- 1.2. Canada
- 1.3. Mexico
-
2. South America
- 2.1. Brazil
- 2.2. Argentina
- 2.3. Rest of South America
-
3. Europe
- 3.1. United Kingdom
- 3.2. Germany
- 3.3. France
- 3.4. Italy
- 3.5. Spain
- 3.6. Russia
- 3.7. Benelux
- 3.8. Nordics
- 3.9. Rest of Europe
-
4. Middle East & Africa
- 4.1. Turkey
- 4.2. Israel
- 4.3. GCC
- 4.4. North Africa
- 4.5. South Africa
- 4.6. Rest of Middle East & Africa
-
5. Asia Pacific
- 5.1. China
- 5.2. India
- 5.3. Japan
- 5.4. South Korea
- 5.5. ASEAN
- 5.6. Oceania
- 5.7. Rest of Asia Pacific
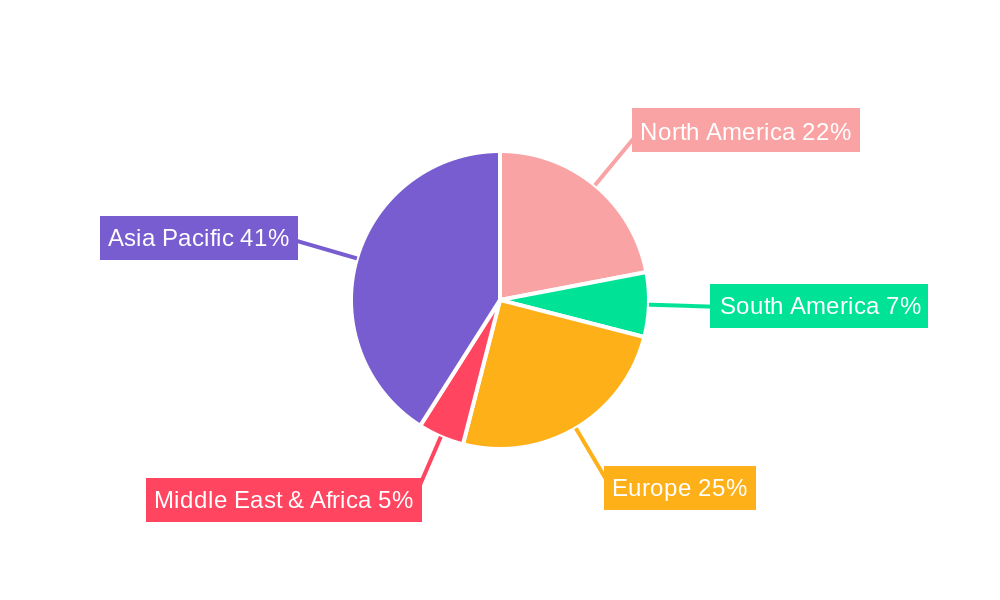
Electronic Grade Gases Regional Market Share
Geographic Coverage of Electronic Grade Gases
Electronic Grade Gases REPORT HIGHLIGHTS
| Aspects | Details |
|---|---|
| Study Period | 2020-2034 |
| Base Year | 2025 |
| Estimated Year | 2026 |
| Forecast Period | 2026-2034 |
| Historical Period | 2020-2025 |
| Growth Rate | CAGR of XX% from 2020-2034 |
| Segmentation |
|
Table of Contents
- 1. Introduction
- 1.1. Research Scope
- 1.2. Market Segmentation
- 1.3. Research Objective
- 1.4. Definitions and Assumptions
- 2. Executive Summary
- 2.1. Market Snapshot
- 3. Market Dynamics
- 3.1. Market Drivers
- 3.2. Market Restrains
- 3.3. Market Trends
- 3.4. Market Opportunities
- 4. Market Factor Analysis
- 4.1. Porters Five Forces
- 4.1.1. Bargaining Power of Suppliers
- 4.1.2. Bargaining Power of Buyers
- 4.1.3. Threat of New Entrants
- 4.1.4. Threat of Substitutes
- 4.1.5. Competitive Rivalry
- 4.2. PESTEL analysis
- 4.3. BCG Analysis
- 4.3.1. Stars (High Growth, High Market Share)
- 4.3.2. Cash Cows (Low Growth, High Market Share)
- 4.3.3. Question Mark (High Growth, Low Market Share)
- 4.3.4. Dogs (Low Growth, Low Market Share)
- 4.4. Ansoff Matrix Analysis
- 4.5. Supply Chain Analysis
- 4.6. Regulatory Landscape
- 4.7. Current Market Potential and Opportunity Assessment (TAM–SAM–SOM Framework)
- 4.8. NRP Analyst Note
- 4.1. Porters Five Forces
- 5. Market Analysis, Insights and Forecast 2021-2033
- 5.1. Market Analysis, Insights and Forecast - by Application
- 5.1.1. Semiconductor Industries
- 5.1.2. Displays
- 5.1.3. Photovoltaic
- 5.1.4. Others
- 5.2. Market Analysis, Insights and Forecast - by Types
- 5.2.1. Deposition
- 5.2.2. Etching
- 5.2.3. Doping
- 5.2.4. Lithography
- 5.3. Market Analysis, Insights and Forecast - by Region
- 5.3.1. North America
- 5.3.2. South America
- 5.3.3. Europe
- 5.3.4. Middle East & Africa
- 5.3.5. Asia Pacific
- 5.1. Market Analysis, Insights and Forecast - by Application
- 6. Global Electronic Grade Gases Analysis, Insights and Forecast, 2021-2033
- 6.1. Market Analysis, Insights and Forecast - by Application
- 6.1.1. Semiconductor Industries
- 6.1.2. Displays
- 6.1.3. Photovoltaic
- 6.1.4. Others
- 6.2. Market Analysis, Insights and Forecast - by Types
- 6.2.1. Deposition
- 6.2.2. Etching
- 6.2.3. Doping
- 6.2.4. Lithography
- 6.1. Market Analysis, Insights and Forecast - by Application
- 7. North America Electronic Grade Gases Analysis, Insights and Forecast, 2020-2032
- 7.1. Market Analysis, Insights and Forecast - by Application
- 7.1.1. Semiconductor Industries
- 7.1.2. Displays
- 7.1.3. Photovoltaic
- 7.1.4. Others
- 7.2. Market Analysis, Insights and Forecast - by Types
- 7.2.1. Deposition
- 7.2.2. Etching
- 7.2.3. Doping
- 7.2.4. Lithography
- 7.1. Market Analysis, Insights and Forecast - by Application
- 8. South America Electronic Grade Gases Analysis, Insights and Forecast, 2020-2032
- 8.1. Market Analysis, Insights and Forecast - by Application
- 8.1.1. Semiconductor Industries
- 8.1.2. Displays
- 8.1.3. Photovoltaic
- 8.1.4. Others
- 8.2. Market Analysis, Insights and Forecast - by Types
- 8.2.1. Deposition
- 8.2.2. Etching
- 8.2.3. Doping
- 8.2.4. Lithography
- 8.1. Market Analysis, Insights and Forecast - by Application
- 9. Europe Electronic Grade Gases Analysis, Insights and Forecast, 2020-2032
- 9.1. Market Analysis, Insights and Forecast - by Application
- 9.1.1. Semiconductor Industries
- 9.1.2. Displays
- 9.1.3. Photovoltaic
- 9.1.4. Others
- 9.2. Market Analysis, Insights and Forecast - by Types
- 9.2.1. Deposition
- 9.2.2. Etching
- 9.2.3. Doping
- 9.2.4. Lithography
- 9.1. Market Analysis, Insights and Forecast - by Application
- 10. Middle East & Africa Electronic Grade Gases Analysis, Insights and Forecast, 2020-2032
- 10.1. Market Analysis, Insights and Forecast - by Application
- 10.1.1. Semiconductor Industries
- 10.1.2. Displays
- 10.1.3. Photovoltaic
- 10.1.4. Others
- 10.2. Market Analysis, Insights and Forecast - by Types
- 10.2.1. Deposition
- 10.2.2. Etching
- 10.2.3. Doping
- 10.2.4. Lithography
- 10.1. Market Analysis, Insights and Forecast - by Application
- 11. Asia Pacific Electronic Grade Gases Analysis, Insights and Forecast, 2020-2032
- 11.1. Market Analysis, Insights and Forecast - by Application
- 11.1.1. Semiconductor Industries
- 11.1.2. Displays
- 11.1.3. Photovoltaic
- 11.1.4. Others
- 11.2. Market Analysis, Insights and Forecast - by Types
- 11.2.1. Deposition
- 11.2.2. Etching
- 11.2.3. Doping
- 11.2.4. Lithography
- 11.1. Market Analysis, Insights and Forecast - by Application
- 12. Competitive Analysis
- 12.1. Company Profiles
- 12.1.1 Taiyo Nippon Sanso
- 12.1.1.1. Company Overview
- 12.1.1.2. Products
- 12.1.1.3. Company Financials
- 12.1.1.4. SWOT Analysis
- 12.1.2 Praxair
- 12.1.2.1. Company Overview
- 12.1.2.2. Products
- 12.1.2.3. Company Financials
- 12.1.2.4. SWOT Analysis
- 12.1.3 Air Products
- 12.1.3.1. Company Overview
- 12.1.3.2. Products
- 12.1.3.3. Company Financials
- 12.1.3.4. SWOT Analysis
- 12.1.4 Air Liquide
- 12.1.4.1. Company Overview
- 12.1.4.2. Products
- 12.1.4.3. Company Financials
- 12.1.4.4. SWOT Analysis
- 12.1.5 Linde
- 12.1.5.1. Company Overview
- 12.1.5.2. Products
- 12.1.5.3. Company Financials
- 12.1.5.4. SWOT Analysis
- 12.1.6 Yingde Gases
- 12.1.6.1. Company Overview
- 12.1.6.2. Products
- 12.1.6.3. Company Financials
- 12.1.6.4. SWOT Analysis
- 12.1.7 Sumitomo Seika Chemicals
- 12.1.7.1. Company Overview
- 12.1.7.2. Products
- 12.1.7.3. Company Financials
- 12.1.7.4. SWOT Analysis
- 12.1.8 Hangzhou Hangyang
- 12.1.8.1. Company Overview
- 12.1.8.2. Products
- 12.1.8.3. Company Financials
- 12.1.8.4. SWOT Analysis
- 12.1.9 Suzhou Jinhong Gas
- 12.1.9.1. Company Overview
- 12.1.9.2. Products
- 12.1.9.3. Company Financials
- 12.1.9.4. SWOT Analysis
- 12.1.10 Showa Denko
- 12.1.10.1. Company Overview
- 12.1.10.2. Products
- 12.1.10.3. Company Financials
- 12.1.10.4. SWOT Analysis
- 12.1.11 REC
- 12.1.11.1. Company Overview
- 12.1.11.2. Products
- 12.1.11.3. Company Financials
- 12.1.11.4. SWOT Analysis
- 12.1.1 Taiyo Nippon Sanso
- 12.2. Market Entropy
- 12.2.1 Company's Key Areas Served
- 12.2.2 Recent Developments
- 12.3. Company Market Share Analysis 2025
- 12.3.1 Top 5 Companies Market Share Analysis
- 12.3.2 Top 3 Companies Market Share Analysis
- 12.4. List of Potential Customers
- 13. Research Methodology
List of Figures
- Figure 1: Global Electronic Grade Gases Revenue Breakdown (million, %) by Region 2025 & 2033
- Figure 2: North America Electronic Grade Gases Revenue (million), by Application 2025 & 2033
- Figure 3: North America Electronic Grade Gases Revenue Share (%), by Application 2025 & 2033
- Figure 4: North America Electronic Grade Gases Revenue (million), by Types 2025 & 2033
- Figure 5: North America Electronic Grade Gases Revenue Share (%), by Types 2025 & 2033
- Figure 6: North America Electronic Grade Gases Revenue (million), by Country 2025 & 2033
- Figure 7: North America Electronic Grade Gases Revenue Share (%), by Country 2025 & 2033
- Figure 8: South America Electronic Grade Gases Revenue (million), by Application 2025 & 2033
- Figure 9: South America Electronic Grade Gases Revenue Share (%), by Application 2025 & 2033
- Figure 10: South America Electronic Grade Gases Revenue (million), by Types 2025 & 2033
- Figure 11: South America Electronic Grade Gases Revenue Share (%), by Types 2025 & 2033
- Figure 12: South America Electronic Grade Gases Revenue (million), by Country 2025 & 2033
- Figure 13: South America Electronic Grade Gases Revenue Share (%), by Country 2025 & 2033
- Figure 14: Europe Electronic Grade Gases Revenue (million), by Application 2025 & 2033
- Figure 15: Europe Electronic Grade Gases Revenue Share (%), by Application 2025 & 2033
- Figure 16: Europe Electronic Grade Gases Revenue (million), by Types 2025 & 2033
- Figure 17: Europe Electronic Grade Gases Revenue Share (%), by Types 2025 & 2033
- Figure 18: Europe Electronic Grade Gases Revenue (million), by Country 2025 & 2033
- Figure 19: Europe Electronic Grade Gases Revenue Share (%), by Country 2025 & 2033
- Figure 20: Middle East & Africa Electronic Grade Gases Revenue (million), by Application 2025 & 2033
- Figure 21: Middle East & Africa Electronic Grade Gases Revenue Share (%), by Application 2025 & 2033
- Figure 22: Middle East & Africa Electronic Grade Gases Revenue (million), by Types 2025 & 2033
- Figure 23: Middle East & Africa Electronic Grade Gases Revenue Share (%), by Types 2025 & 2033
- Figure 24: Middle East & Africa Electronic Grade Gases Revenue (million), by Country 2025 & 2033
- Figure 25: Middle East & Africa Electronic Grade Gases Revenue Share (%), by Country 2025 & 2033
- Figure 26: Asia Pacific Electronic Grade Gases Revenue (million), by Application 2025 & 2033
- Figure 27: Asia Pacific Electronic Grade Gases Revenue Share (%), by Application 2025 & 2033
- Figure 28: Asia Pacific Electronic Grade Gases Revenue (million), by Types 2025 & 2033
- Figure 29: Asia Pacific Electronic Grade Gases Revenue Share (%), by Types 2025 & 2033
- Figure 30: Asia Pacific Electronic Grade Gases Revenue (million), by Country 2025 & 2033
- Figure 31: Asia Pacific Electronic Grade Gases Revenue Share (%), by Country 2025 & 2033
List of Tables
- Table 1: Global Electronic Grade Gases Revenue million Forecast, by Application 2020 & 2033
- Table 2: Global Electronic Grade Gases Revenue million Forecast, by Types 2020 & 2033
- Table 3: Global Electronic Grade Gases Revenue million Forecast, by Region 2020 & 2033
- Table 4: Global Electronic Grade Gases Revenue million Forecast, by Application 2020 & 2033
- Table 5: Global Electronic Grade Gases Revenue million Forecast, by Types 2020 & 2033
- Table 6: Global Electronic Grade Gases Revenue million Forecast, by Country 2020 & 2033
- Table 7: United States Electronic Grade Gases Revenue (million) Forecast, by Application 2020 & 2033
- Table 8: Canada Electronic Grade Gases Revenue (million) Forecast, by Application 2020 & 2033
- Table 9: Mexico Electronic Grade Gases Revenue (million) Forecast, by Application 2020 & 2033
- Table 10: Global Electronic Grade Gases Revenue million Forecast, by Application 2020 & 2033
- Table 11: Global Electronic Grade Gases Revenue million Forecast, by Types 2020 & 2033
- Table 12: Global Electronic Grade Gases Revenue million Forecast, by Country 2020 & 2033
- Table 13: Brazil Electronic Grade Gases Revenue (million) Forecast, by Application 2020 & 2033
- Table 14: Argentina Electronic Grade Gases Revenue (million) Forecast, by Application 2020 & 2033
- Table 15: Rest of South America Electronic Grade Gases Revenue (million) Forecast, by Application 2020 & 2033
- Table 16: Global Electronic Grade Gases Revenue million Forecast, by Application 2020 & 2033
- Table 17: Global Electronic Grade Gases Revenue million Forecast, by Types 2020 & 2033
- Table 18: Global Electronic Grade Gases Revenue million Forecast, by Country 2020 & 2033
- Table 19: United Kingdom Electronic Grade Gases Revenue (million) Forecast, by Application 2020 & 2033
- Table 20: Germany Electronic Grade Gases Revenue (million) Forecast, by Application 2020 & 2033
- Table 21: France Electronic Grade Gases Revenue (million) Forecast, by Application 2020 & 2033
- Table 22: Italy Electronic Grade Gases Revenue (million) Forecast, by Application 2020 & 2033
- Table 23: Spain Electronic Grade Gases Revenue (million) Forecast, by Application 2020 & 2033
- Table 24: Russia Electronic Grade Gases Revenue (million) Forecast, by Application 2020 & 2033
- Table 25: Benelux Electronic Grade Gases Revenue (million) Forecast, by Application 2020 & 2033
- Table 26: Nordics Electronic Grade Gases Revenue (million) Forecast, by Application 2020 & 2033
- Table 27: Rest of Europe Electronic Grade Gases Revenue (million) Forecast, by Application 2020 & 2033
- Table 28: Global Electronic Grade Gases Revenue million Forecast, by Application 2020 & 2033
- Table 29: Global Electronic Grade Gases Revenue million Forecast, by Types 2020 & 2033
- Table 30: Global Electronic Grade Gases Revenue million Forecast, by Country 2020 & 2033
- Table 31: Turkey Electronic Grade Gases Revenue (million) Forecast, by Application 2020 & 2033
- Table 32: Israel Electronic Grade Gases Revenue (million) Forecast, by Application 2020 & 2033
- Table 33: GCC Electronic Grade Gases Revenue (million) Forecast, by Application 2020 & 2033
- Table 34: North Africa Electronic Grade Gases Revenue (million) Forecast, by Application 2020 & 2033
- Table 35: South Africa Electronic Grade Gases Revenue (million) Forecast, by Application 2020 & 2033
- Table 36: Rest of Middle East & Africa Electronic Grade Gases Revenue (million) Forecast, by Application 2020 & 2033
- Table 37: Global Electronic Grade Gases Revenue million Forecast, by Application 2020 & 2033
- Table 38: Global Electronic Grade Gases Revenue million Forecast, by Types 2020 & 2033
- Table 39: Global Electronic Grade Gases Revenue million Forecast, by Country 2020 & 2033
- Table 40: China Electronic Grade Gases Revenue (million) Forecast, by Application 2020 & 2033
- Table 41: India Electronic Grade Gases Revenue (million) Forecast, by Application 2020 & 2033
- Table 42: Japan Electronic Grade Gases Revenue (million) Forecast, by Application 2020 & 2033
- Table 43: South Korea Electronic Grade Gases Revenue (million) Forecast, by Application 2020 & 2033
- Table 44: ASEAN Electronic Grade Gases Revenue (million) Forecast, by Application 2020 & 2033
- Table 45: Oceania Electronic Grade Gases Revenue (million) Forecast, by Application 2020 & 2033
- Table 46: Rest of Asia Pacific Electronic Grade Gases Revenue (million) Forecast, by Application 2020 & 2033
Frequently Asked Questions
1. What is the projected Compound Annual Growth Rate (CAGR) of the Electronic Grade Gases?
The projected CAGR is approximately XX%.
2. Which companies are prominent players in the Electronic Grade Gases?
Key companies in the market include Taiyo Nippon Sanso, Praxair, Air Products, Air Liquide, Linde, Yingde Gases, Sumitomo Seika Chemicals, Hangzhou Hangyang, Suzhou Jinhong Gas, Showa Denko, REC.
3. What are the main segments of the Electronic Grade Gases?
The market segments include Application, Types.
4. Can you provide details about the market size?
The market size is estimated to be USD XXX million as of 2022.
5. What are some drivers contributing to market growth?
N/A
6. What are the notable trends driving market growth?
N/A
7. Are there any restraints impacting market growth?
N/A
8. Can you provide examples of recent developments in the market?
N/A
9. What pricing options are available for accessing the report?
Pricing options include single-user, multi-user, and enterprise licenses priced at USD 4900.00, USD 7350.00, and USD 9800.00 respectively.
10. Is the market size provided in terms of value or volume?
The market size is provided in terms of value, measured in million.
11. Are there any specific market keywords associated with the report?
Yes, the market keyword associated with the report is "Electronic Grade Gases," which aids in identifying and referencing the specific market segment covered.
12. How do I determine which pricing option suits my needs best?
The pricing options vary based on user requirements and access needs. Individual users may opt for single-user licenses, while businesses requiring broader access may choose multi-user or enterprise licenses for cost-effective access to the report.
13. Are there any additional resources or data provided in the Electronic Grade Gases report?
While the report offers comprehensive insights, it's advisable to review the specific contents or supplementary materials provided to ascertain if additional resources or data are available.
14. How can I stay updated on further developments or reports in the Electronic Grade Gases?
To stay informed about further developments, trends, and reports in the Electronic Grade Gases, consider subscribing to industry newsletters, following relevant companies and organizations, or regularly checking reputable industry news sources and publications.
Methodology
Step 1 - Identification of Relevant Samples Size from Population Database


Step 2 - Approaches for Defining Global Market Size (Value, Volume* & Price*)

Note*: In applicable scenarios
Step 3 - Data Sources
Primary Research
- Web Analytics
- Survey Reports
- Research Institute
- Latest Research Reports
- Opinion Leaders
Secondary Research
- Annual Reports
- White Paper
- Latest Press Release
- Industry Association
- Paid Database
- Investor Presentations

Step 4 - Data Triangulation
Involves using different sources of information in order to increase the validity of a study
These sources are likely to be stakeholders in a program - participants, other researchers, program staff, other community members, and so on.
Then we put all data in single framework & apply various statistical tools to find out the dynamic on the market.
During the analysis stage, feedback from the stakeholder groups would be compared to determine areas of agreement as well as areas of divergence