

Key Insights
The Electronic Grade Ultra Thin Glass (e-UTG) market, currently valued at $2.927 billion in 2025, is projected to experience robust growth, driven by the increasing demand for foldable smartphones, flexible displays, and advanced wearable devices. A compound annual growth rate (CAGR) of 4.5% from 2025 to 2033 suggests a significant market expansion, reaching an estimated value exceeding $4.5 billion by 2033. This growth is fueled by continuous technological advancements leading to improved glass properties like flexibility, transparency, and durability. Key players like Corning, AGC, and Schott are heavily invested in R&D, pushing the boundaries of e-UTG production and driving innovation in material science. The market's segmentation is likely diversified across various thicknesses, applications (e.g., smartphones, tablets, automotive displays), and manufacturing processes (e.g., float glass, chemical etching). The competitive landscape is characterized by both established glass manufacturers and specialized e-UTG producers, leading to price competition and innovation.

Electronic Grade Ultra Thin Glass Market Size (In Billion)
The market's expansion faces some challenges, primarily related to the high production costs and complex manufacturing processes involved in creating e-UTG. Yield rates can be lower than traditional glass production, contributing to higher prices. However, ongoing research and development efforts are focused on optimizing production methods, improving yield, and reducing costs. Furthermore, emerging applications in areas like automotive displays and advanced medical devices are expected to offset these challenges and support further market growth. Regional variations in adoption rates are also likely, with regions exhibiting higher penetration of advanced technologies likely experiencing faster growth. The consistent technological advancements and expanding applications are poised to overcome the present limitations, assuring the long-term growth potential of the e-UTG market.

Electronic Grade Ultra Thin Glass Company Market Share
Electronic Grade Ultra Thin Glass Market Report: 2019-2033
This comprehensive report provides a detailed analysis of the Electronic Grade Ultra Thin Glass market, offering invaluable insights for industry professionals, investors, and strategic decision-makers. Covering the period 2019-2033, with a focus on the 2025-2033 forecast, this report illuminates market dynamics, growth trends, competitive landscapes, and future opportunities within the parent market of Specialty Glass and the child market of Display Technology. The report quantifies the market in million units, providing crucial data for informed strategic planning.
Electronic Grade Ultra Thin Glass Market Dynamics & Structure
The Electronic Grade Ultra Thin Glass market is characterized by a moderately concentrated structure, with key players like Corning, AGC, and Nippon Electric Glass holding significant market share (xx%). Technological innovation, particularly in areas like improved strength, flexibility, and transparency, is a major driver. Stringent regulatory frameworks concerning material safety and environmental impact also play a crucial role. Competitive substitutes, such as plastic substrates, pose a challenge, but the superior performance of ultra-thin glass in applications demanding high clarity and durability ensures its continued relevance. The market witnesses continuous M&A activity, with xx major deals recorded during the historical period (2019-2024), primarily driven by vertical integration strategies and expansion into new geographical markets.
- Market Concentration: Moderately concentrated, with top 5 players holding xx% market share in 2025.
- Technological Innovation: Focus on enhanced strength, flexibility, and large-size production capabilities.
- Regulatory Landscape: Stringent environmental and safety regulations impacting manufacturing processes.
- Competitive Substitutes: Plastic substrates present a challenge, but ultra-thin glass retains advantages in high-performance applications.
- M&A Activity: xx major deals in 2019-2024, driven by vertical integration and geographical expansion.
- End-User Demographics: Primarily driven by the electronics and display industries.
Electronic Grade Ultra Thin Glass Growth Trends & Insights
The Electronic Grade Ultra Thin Glass market experienced significant growth during the historical period (2019-2024), with a CAGR of xx%. This growth is primarily attributed to the increasing adoption of flexible displays, foldable smartphones, and advancements in wearable technology. The market size reached xx million units in 2025, and is projected to reach xx million units by 2033, exhibiting a CAGR of xx% during the forecast period (2025-2033). Technological disruptions, such as the introduction of new manufacturing processes (like roll-to-roll processing) and materials science breakthroughs, are accelerating market expansion. Shifting consumer preferences towards lighter, thinner, and more durable electronic devices are also key growth drivers. Market penetration within the targeted end-user segments is expected to increase from xx% in 2025 to xx% by 2033.
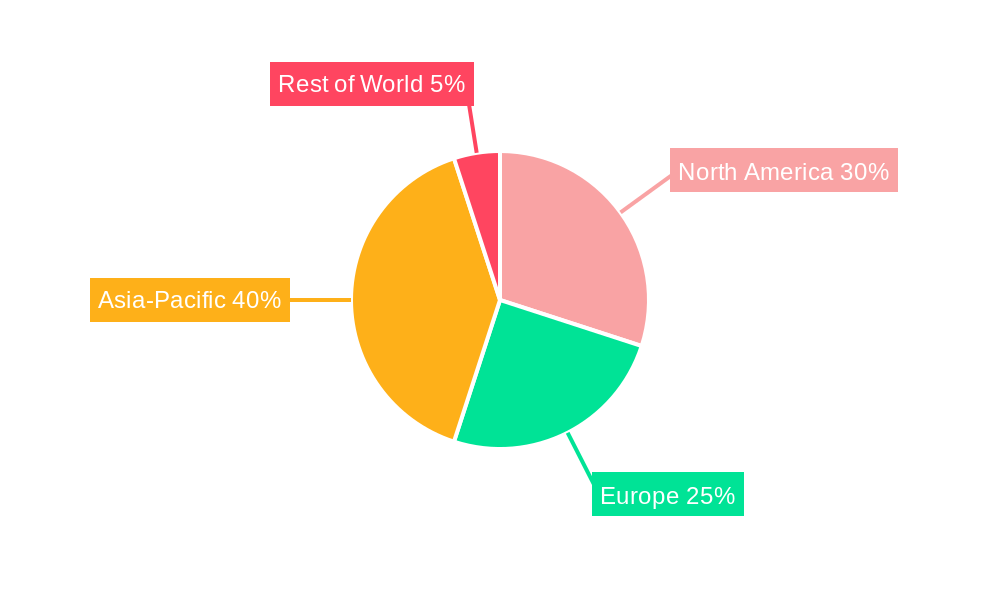
Dominant Regions, Countries, or Segments in Electronic Grade Ultra Thin Glass
Asia-Pacific, particularly China, South Korea, and Japan, dominates the Electronic Grade Ultra Thin Glass market, holding xx% of the global market share in 2025. This dominance stems from the region's robust electronics manufacturing sector, supportive government policies promoting technological advancements, and a well-established supply chain. North America and Europe follow, exhibiting significant but slower growth rates. The mobile devices segment holds the largest market share due to the high demand for ultra-thin glass in smartphones and tablets.
- Key Drivers in Asia-Pacific:
- Strong electronics manufacturing base
- Government incentives for technological advancement
- Established supply chain infrastructure
- Dominance Factors: High demand from electronics manufacturers, cost advantages, and technological leadership.
- Growth Potential: Continued expansion driven by increasing smartphone penetration and the rise of foldable devices.
Electronic Grade Ultra Thin Glass Product Landscape
Electronic Grade Ultra Thin Glass is characterized by continuous product innovation. Manufacturers are focusing on enhanced flexibility, improved strength-to-weight ratios, and larger sheet sizes to meet the demands of advanced display technologies. Unique selling propositions include improved optical clarity, scratch resistance, and reduced weight. Technological advancements in deposition techniques and material compositions are driving the development of next-generation ultra-thin glass with superior performance characteristics.
Key Drivers, Barriers & Challenges in Electronic Grade Ultra Thin Glass
Key Drivers:
- Increasing demand from the consumer electronics industry (especially smartphones and foldable devices).
- Technological advancements in manufacturing processes enabling larger, thinner, and more flexible glass.
- Government support and incentives for the development of advanced display technologies.
Key Challenges & Restraints:
- High manufacturing costs associated with advanced ultra-thin glass production techniques.
- Supply chain disruptions impacting the availability of raw materials.
- Intense competition among established players and emerging entrants.
Emerging Opportunities in Electronic Grade Ultra Thin Glass
Emerging opportunities lie in the growing adoption of flexible displays in various applications, including wearable electronics, automotive displays, and advanced medical devices. Untapped markets in developing economies present significant growth potential. The development of new applications, such as transparent electronics and smart windows, opens further avenues for market expansion.
Growth Accelerators in the Electronic Grade Ultra Thin Glass Industry
Technological breakthroughs in manufacturing processes (e.g., roll-to-roll production) and materials science are key growth accelerators. Strategic partnerships between glass manufacturers and electronics companies enable collaborative development and faster market penetration. Market expansion into emerging economies with growing consumer electronics demand fuels further growth.
Key Players Shaping the Electronic Grade Ultra Thin Glass Market
- Corning
- AGC
- Nippon Electric Glass
- Schott
- CSG Holding
- NSG
- Caihong Display Devices
- Luoyang Glass
- Taiwan Glass
- Triumph Science & Technology
Notable Milestones in Electronic Grade Ultra Thin Glass Sector
- 2020: Corning introduces a new generation of ultra-thin glass with enhanced flexibility.
- 2022: AGC announces a strategic partnership with a leading smartphone manufacturer to develop foldable display technology.
- 2023: Nippon Electric Glass invests in a new manufacturing facility for large-size ultra-thin glass production.
In-Depth Electronic Grade Ultra Thin Glass Market Outlook
The Electronic Grade Ultra Thin Glass market is poised for sustained growth, driven by technological advancements, increasing demand from the electronics industry, and expansion into new applications. Strategic partnerships, investments in R&D, and the development of innovative manufacturing processes will be crucial for success in this dynamic market. The market is expected to witness significant growth, reaching xx million units by 2033, offering lucrative opportunities for existing and new players.
Electronic Grade Ultra Thin Glass Segmentation
-
1. Application
- 1.1. Consumer Electronics
- 1.2. Automotive
- 1.3. Medical Use
- 1.4. Others
-
2. Type
- 2.1. <0.5mm
- 2.2. 0.5-1mm
- 2.3. >1mm
Electronic Grade Ultra Thin Glass Segmentation By Geography
-
1. North America
- 1.1. United States
- 1.2. Canada
- 1.3. Mexico
-
2. South America
- 2.1. Brazil
- 2.2. Argentina
- 2.3. Rest of South America
-
3. Europe
- 3.1. United Kingdom
- 3.2. Germany
- 3.3. France
- 3.4. Italy
- 3.5. Spain
- 3.6. Russia
- 3.7. Benelux
- 3.8. Nordics
- 3.9. Rest of Europe
-
4. Middle East & Africa
- 4.1. Turkey
- 4.2. Israel
- 4.3. GCC
- 4.4. North Africa
- 4.5. South Africa
- 4.6. Rest of Middle East & Africa
-
5. Asia Pacific
- 5.1. China
- 5.2. India
- 5.3. Japan
- 5.4. South Korea
- 5.5. ASEAN
- 5.6. Oceania
- 5.7. Rest of Asia Pacific
Electronic Grade Ultra Thin Glass Regional Market Share
Geographic Coverage of Electronic Grade Ultra Thin Glass
Electronic Grade Ultra Thin Glass REPORT HIGHLIGHTS
| Aspects | Details |
|---|---|
| Study Period | 2020-2034 |
| Base Year | 2025 |
| Estimated Year | 2026 |
| Forecast Period | 2026-2034 |
| Historical Period | 2020-2025 |
| Growth Rate | CAGR of 4.5% from 2020-2034 |
| Segmentation |
|
Table of Contents
- 1. Introduction
- 1.1. Research Scope
- 1.2. Market Segmentation
- 1.3. Research Objective
- 1.4. Definitions and Assumptions
- 2. Executive Summary
- 2.1. Market Snapshot
- 3. Market Dynamics
- 3.1. Market Drivers
- 3.2. Market Restrains
- 3.3. Market Trends
- 3.4. Market Opportunities
- 4. Market Factor Analysis
- 4.1. Porters Five Forces
- 4.1.1. Bargaining Power of Suppliers
- 4.1.2. Bargaining Power of Buyers
- 4.1.3. Threat of New Entrants
- 4.1.4. Threat of Substitutes
- 4.1.5. Competitive Rivalry
- 4.2. PESTEL analysis
- 4.3. BCG Analysis
- 4.3.1. Stars (High Growth, High Market Share)
- 4.3.2. Cash Cows (Low Growth, High Market Share)
- 4.3.3. Question Mark (High Growth, Low Market Share)
- 4.3.4. Dogs (Low Growth, Low Market Share)
- 4.4. Ansoff Matrix Analysis
- 4.5. Supply Chain Analysis
- 4.6. Regulatory Landscape
- 4.7. Current Market Potential and Opportunity Assessment (TAM–SAM–SOM Framework)
- 4.8. NRP Analyst Note
- 4.1. Porters Five Forces
- 5. Market Analysis, Insights and Forecast 2021-2033
- 5.1. Market Analysis, Insights and Forecast - by Application
- 5.1.1. Consumer Electronics
- 5.1.2. Automotive
- 5.1.3. Medical Use
- 5.1.4. Others
- 5.2. Market Analysis, Insights and Forecast - by Type
- 5.2.1. <0.5mm
- 5.2.2. 0.5-1mm
- 5.2.3. >1mm
- 5.3. Market Analysis, Insights and Forecast - by Region
- 5.3.1. North America
- 5.3.2. South America
- 5.3.3. Europe
- 5.3.4. Middle East & Africa
- 5.3.5. Asia Pacific
- 5.1. Market Analysis, Insights and Forecast - by Application
- 6. Global Electronic Grade Ultra Thin Glass Analysis, Insights and Forecast, 2021-2033
- 6.1. Market Analysis, Insights and Forecast - by Application
- 6.1.1. Consumer Electronics
- 6.1.2. Automotive
- 6.1.3. Medical Use
- 6.1.4. Others
- 6.2. Market Analysis, Insights and Forecast - by Type
- 6.2.1. <0.5mm
- 6.2.2. 0.5-1mm
- 6.2.3. >1mm
- 6.1. Market Analysis, Insights and Forecast - by Application
- 7. North America Electronic Grade Ultra Thin Glass Analysis, Insights and Forecast, 2020-2032
- 7.1. Market Analysis, Insights and Forecast - by Application
- 7.1.1. Consumer Electronics
- 7.1.2. Automotive
- 7.1.3. Medical Use
- 7.1.4. Others
- 7.2. Market Analysis, Insights and Forecast - by Type
- 7.2.1. <0.5mm
- 7.2.2. 0.5-1mm
- 7.2.3. >1mm
- 7.1. Market Analysis, Insights and Forecast - by Application
- 8. South America Electronic Grade Ultra Thin Glass Analysis, Insights and Forecast, 2020-2032
- 8.1. Market Analysis, Insights and Forecast - by Application
- 8.1.1. Consumer Electronics
- 8.1.2. Automotive
- 8.1.3. Medical Use
- 8.1.4. Others
- 8.2. Market Analysis, Insights and Forecast - by Type
- 8.2.1. <0.5mm
- 8.2.2. 0.5-1mm
- 8.2.3. >1mm
- 8.1. Market Analysis, Insights and Forecast - by Application
- 9. Europe Electronic Grade Ultra Thin Glass Analysis, Insights and Forecast, 2020-2032
- 9.1. Market Analysis, Insights and Forecast - by Application
- 9.1.1. Consumer Electronics
- 9.1.2. Automotive
- 9.1.3. Medical Use
- 9.1.4. Others
- 9.2. Market Analysis, Insights and Forecast - by Type
- 9.2.1. <0.5mm
- 9.2.2. 0.5-1mm
- 9.2.3. >1mm
- 9.1. Market Analysis, Insights and Forecast - by Application
- 10. Middle East & Africa Electronic Grade Ultra Thin Glass Analysis, Insights and Forecast, 2020-2032
- 10.1. Market Analysis, Insights and Forecast - by Application
- 10.1.1. Consumer Electronics
- 10.1.2. Automotive
- 10.1.3. Medical Use
- 10.1.4. Others
- 10.2. Market Analysis, Insights and Forecast - by Type
- 10.2.1. <0.5mm
- 10.2.2. 0.5-1mm
- 10.2.3. >1mm
- 10.1. Market Analysis, Insights and Forecast - by Application
- 11. Asia Pacific Electronic Grade Ultra Thin Glass Analysis, Insights and Forecast, 2020-2032
- 11.1. Market Analysis, Insights and Forecast - by Application
- 11.1.1. Consumer Electronics
- 11.1.2. Automotive
- 11.1.3. Medical Use
- 11.1.4. Others
- 11.2. Market Analysis, Insights and Forecast - by Type
- 11.2.1. <0.5mm
- 11.2.2. 0.5-1mm
- 11.2.3. >1mm
- 11.1. Market Analysis, Insights and Forecast - by Application
- 12. Competitive Analysis
- 12.1. Company Profiles
- 12.1.1 Corning
- 12.1.1.1. Company Overview
- 12.1.1.2. Products
- 12.1.1.3. Company Financials
- 12.1.1.4. SWOT Analysis
- 12.1.2 AGC
- 12.1.2.1. Company Overview
- 12.1.2.2. Products
- 12.1.2.3. Company Financials
- 12.1.2.4. SWOT Analysis
- 12.1.3 Nippon Electric Glass
- 12.1.3.1. Company Overview
- 12.1.3.2. Products
- 12.1.3.3. Company Financials
- 12.1.3.4. SWOT Analysis
- 12.1.4 Schott
- 12.1.4.1. Company Overview
- 12.1.4.2. Products
- 12.1.4.3. Company Financials
- 12.1.4.4. SWOT Analysis
- 12.1.5 CSG Holding
- 12.1.5.1. Company Overview
- 12.1.5.2. Products
- 12.1.5.3. Company Financials
- 12.1.5.4. SWOT Analysis
- 12.1.6 NSG
- 12.1.6.1. Company Overview
- 12.1.6.2. Products
- 12.1.6.3. Company Financials
- 12.1.6.4. SWOT Analysis
- 12.1.7 Caihong Display Devices
- 12.1.7.1. Company Overview
- 12.1.7.2. Products
- 12.1.7.3. Company Financials
- 12.1.7.4. SWOT Analysis
- 12.1.8 Luoyang Glass
- 12.1.8.1. Company Overview
- 12.1.8.2. Products
- 12.1.8.3. Company Financials
- 12.1.8.4. SWOT Analysis
- 12.1.9 Taiwan Glass
- 12.1.9.1. Company Overview
- 12.1.9.2. Products
- 12.1.9.3. Company Financials
- 12.1.9.4. SWOT Analysis
- 12.1.10 Triumph Science&Technology
- 12.1.10.1. Company Overview
- 12.1.10.2. Products
- 12.1.10.3. Company Financials
- 12.1.10.4. SWOT Analysis
- 12.1.1 Corning
- 12.2. Market Entropy
- 12.2.1 Company's Key Areas Served
- 12.2.2 Recent Developments
- 12.3. Company Market Share Analysis 2025
- 12.3.1 Top 5 Companies Market Share Analysis
- 12.3.2 Top 3 Companies Market Share Analysis
- 12.4. List of Potential Customers
- 13. Research Methodology
List of Figures
- Figure 1: Global Electronic Grade Ultra Thin Glass Revenue Breakdown (million, %) by Region 2025 & 2033
- Figure 2: Global Electronic Grade Ultra Thin Glass Volume Breakdown (K, %) by Region 2025 & 2033
- Figure 3: North America Electronic Grade Ultra Thin Glass Revenue (million), by Application 2025 & 2033
- Figure 4: North America Electronic Grade Ultra Thin Glass Volume (K), by Application 2025 & 2033
- Figure 5: North America Electronic Grade Ultra Thin Glass Revenue Share (%), by Application 2025 & 2033
- Figure 6: North America Electronic Grade Ultra Thin Glass Volume Share (%), by Application 2025 & 2033
- Figure 7: North America Electronic Grade Ultra Thin Glass Revenue (million), by Type 2025 & 2033
- Figure 8: North America Electronic Grade Ultra Thin Glass Volume (K), by Type 2025 & 2033
- Figure 9: North America Electronic Grade Ultra Thin Glass Revenue Share (%), by Type 2025 & 2033
- Figure 10: North America Electronic Grade Ultra Thin Glass Volume Share (%), by Type 2025 & 2033
- Figure 11: North America Electronic Grade Ultra Thin Glass Revenue (million), by Country 2025 & 2033
- Figure 12: North America Electronic Grade Ultra Thin Glass Volume (K), by Country 2025 & 2033
- Figure 13: North America Electronic Grade Ultra Thin Glass Revenue Share (%), by Country 2025 & 2033
- Figure 14: North America Electronic Grade Ultra Thin Glass Volume Share (%), by Country 2025 & 2033
- Figure 15: South America Electronic Grade Ultra Thin Glass Revenue (million), by Application 2025 & 2033
- Figure 16: South America Electronic Grade Ultra Thin Glass Volume (K), by Application 2025 & 2033
- Figure 17: South America Electronic Grade Ultra Thin Glass Revenue Share (%), by Application 2025 & 2033
- Figure 18: South America Electronic Grade Ultra Thin Glass Volume Share (%), by Application 2025 & 2033
- Figure 19: South America Electronic Grade Ultra Thin Glass Revenue (million), by Type 2025 & 2033
- Figure 20: South America Electronic Grade Ultra Thin Glass Volume (K), by Type 2025 & 2033
- Figure 21: South America Electronic Grade Ultra Thin Glass Revenue Share (%), by Type 2025 & 2033
- Figure 22: South America Electronic Grade Ultra Thin Glass Volume Share (%), by Type 2025 & 2033
- Figure 23: South America Electronic Grade Ultra Thin Glass Revenue (million), by Country 2025 & 2033
- Figure 24: South America Electronic Grade Ultra Thin Glass Volume (K), by Country 2025 & 2033
- Figure 25: South America Electronic Grade Ultra Thin Glass Revenue Share (%), by Country 2025 & 2033
- Figure 26: South America Electronic Grade Ultra Thin Glass Volume Share (%), by Country 2025 & 2033
- Figure 27: Europe Electronic Grade Ultra Thin Glass Revenue (million), by Application 2025 & 2033
- Figure 28: Europe Electronic Grade Ultra Thin Glass Volume (K), by Application 2025 & 2033
- Figure 29: Europe Electronic Grade Ultra Thin Glass Revenue Share (%), by Application 2025 & 2033
- Figure 30: Europe Electronic Grade Ultra Thin Glass Volume Share (%), by Application 2025 & 2033
- Figure 31: Europe Electronic Grade Ultra Thin Glass Revenue (million), by Type 2025 & 2033
- Figure 32: Europe Electronic Grade Ultra Thin Glass Volume (K), by Type 2025 & 2033
- Figure 33: Europe Electronic Grade Ultra Thin Glass Revenue Share (%), by Type 2025 & 2033
- Figure 34: Europe Electronic Grade Ultra Thin Glass Volume Share (%), by Type 2025 & 2033
- Figure 35: Europe Electronic Grade Ultra Thin Glass Revenue (million), by Country 2025 & 2033
- Figure 36: Europe Electronic Grade Ultra Thin Glass Volume (K), by Country 2025 & 2033
- Figure 37: Europe Electronic Grade Ultra Thin Glass Revenue Share (%), by Country 2025 & 2033
- Figure 38: Europe Electronic Grade Ultra Thin Glass Volume Share (%), by Country 2025 & 2033
- Figure 39: Middle East & Africa Electronic Grade Ultra Thin Glass Revenue (million), by Application 2025 & 2033
- Figure 40: Middle East & Africa Electronic Grade Ultra Thin Glass Volume (K), by Application 2025 & 2033
- Figure 41: Middle East & Africa Electronic Grade Ultra Thin Glass Revenue Share (%), by Application 2025 & 2033
- Figure 42: Middle East & Africa Electronic Grade Ultra Thin Glass Volume Share (%), by Application 2025 & 2033
- Figure 43: Middle East & Africa Electronic Grade Ultra Thin Glass Revenue (million), by Type 2025 & 2033
- Figure 44: Middle East & Africa Electronic Grade Ultra Thin Glass Volume (K), by Type 2025 & 2033
- Figure 45: Middle East & Africa Electronic Grade Ultra Thin Glass Revenue Share (%), by Type 2025 & 2033
- Figure 46: Middle East & Africa Electronic Grade Ultra Thin Glass Volume Share (%), by Type 2025 & 2033
- Figure 47: Middle East & Africa Electronic Grade Ultra Thin Glass Revenue (million), by Country 2025 & 2033
- Figure 48: Middle East & Africa Electronic Grade Ultra Thin Glass Volume (K), by Country 2025 & 2033
- Figure 49: Middle East & Africa Electronic Grade Ultra Thin Glass Revenue Share (%), by Country 2025 & 2033
- Figure 50: Middle East & Africa Electronic Grade Ultra Thin Glass Volume Share (%), by Country 2025 & 2033
- Figure 51: Asia Pacific Electronic Grade Ultra Thin Glass Revenue (million), by Application 2025 & 2033
- Figure 52: Asia Pacific Electronic Grade Ultra Thin Glass Volume (K), by Application 2025 & 2033
- Figure 53: Asia Pacific Electronic Grade Ultra Thin Glass Revenue Share (%), by Application 2025 & 2033
- Figure 54: Asia Pacific Electronic Grade Ultra Thin Glass Volume Share (%), by Application 2025 & 2033
- Figure 55: Asia Pacific Electronic Grade Ultra Thin Glass Revenue (million), by Type 2025 & 2033
- Figure 56: Asia Pacific Electronic Grade Ultra Thin Glass Volume (K), by Type 2025 & 2033
- Figure 57: Asia Pacific Electronic Grade Ultra Thin Glass Revenue Share (%), by Type 2025 & 2033
- Figure 58: Asia Pacific Electronic Grade Ultra Thin Glass Volume Share (%), by Type 2025 & 2033
- Figure 59: Asia Pacific Electronic Grade Ultra Thin Glass Revenue (million), by Country 2025 & 2033
- Figure 60: Asia Pacific Electronic Grade Ultra Thin Glass Volume (K), by Country 2025 & 2033
- Figure 61: Asia Pacific Electronic Grade Ultra Thin Glass Revenue Share (%), by Country 2025 & 2033
- Figure 62: Asia Pacific Electronic Grade Ultra Thin Glass Volume Share (%), by Country 2025 & 2033
List of Tables
- Table 1: Global Electronic Grade Ultra Thin Glass Revenue million Forecast, by Application 2020 & 2033
- Table 2: Global Electronic Grade Ultra Thin Glass Volume K Forecast, by Application 2020 & 2033
- Table 3: Global Electronic Grade Ultra Thin Glass Revenue million Forecast, by Type 2020 & 2033
- Table 4: Global Electronic Grade Ultra Thin Glass Volume K Forecast, by Type 2020 & 2033
- Table 5: Global Electronic Grade Ultra Thin Glass Revenue million Forecast, by Region 2020 & 2033
- Table 6: Global Electronic Grade Ultra Thin Glass Volume K Forecast, by Region 2020 & 2033
- Table 7: Global Electronic Grade Ultra Thin Glass Revenue million Forecast, by Application 2020 & 2033
- Table 8: Global Electronic Grade Ultra Thin Glass Volume K Forecast, by Application 2020 & 2033
- Table 9: Global Electronic Grade Ultra Thin Glass Revenue million Forecast, by Type 2020 & 2033
- Table 10: Global Electronic Grade Ultra Thin Glass Volume K Forecast, by Type 2020 & 2033
- Table 11: Global Electronic Grade Ultra Thin Glass Revenue million Forecast, by Country 2020 & 2033
- Table 12: Global Electronic Grade Ultra Thin Glass Volume K Forecast, by Country 2020 & 2033
- Table 13: United States Electronic Grade Ultra Thin Glass Revenue (million) Forecast, by Application 2020 & 2033
- Table 14: United States Electronic Grade Ultra Thin Glass Volume (K) Forecast, by Application 2020 & 2033
- Table 15: Canada Electronic Grade Ultra Thin Glass Revenue (million) Forecast, by Application 2020 & 2033
- Table 16: Canada Electronic Grade Ultra Thin Glass Volume (K) Forecast, by Application 2020 & 2033
- Table 17: Mexico Electronic Grade Ultra Thin Glass Revenue (million) Forecast, by Application 2020 & 2033
- Table 18: Mexico Electronic Grade Ultra Thin Glass Volume (K) Forecast, by Application 2020 & 2033
- Table 19: Global Electronic Grade Ultra Thin Glass Revenue million Forecast, by Application 2020 & 2033
- Table 20: Global Electronic Grade Ultra Thin Glass Volume K Forecast, by Application 2020 & 2033
- Table 21: Global Electronic Grade Ultra Thin Glass Revenue million Forecast, by Type 2020 & 2033
- Table 22: Global Electronic Grade Ultra Thin Glass Volume K Forecast, by Type 2020 & 2033
- Table 23: Global Electronic Grade Ultra Thin Glass Revenue million Forecast, by Country 2020 & 2033
- Table 24: Global Electronic Grade Ultra Thin Glass Volume K Forecast, by Country 2020 & 2033
- Table 25: Brazil Electronic Grade Ultra Thin Glass Revenue (million) Forecast, by Application 2020 & 2033
- Table 26: Brazil Electronic Grade Ultra Thin Glass Volume (K) Forecast, by Application 2020 & 2033
- Table 27: Argentina Electronic Grade Ultra Thin Glass Revenue (million) Forecast, by Application 2020 & 2033
- Table 28: Argentina Electronic Grade Ultra Thin Glass Volume (K) Forecast, by Application 2020 & 2033
- Table 29: Rest of South America Electronic Grade Ultra Thin Glass Revenue (million) Forecast, by Application 2020 & 2033
- Table 30: Rest of South America Electronic Grade Ultra Thin Glass Volume (K) Forecast, by Application 2020 & 2033
- Table 31: Global Electronic Grade Ultra Thin Glass Revenue million Forecast, by Application 2020 & 2033
- Table 32: Global Electronic Grade Ultra Thin Glass Volume K Forecast, by Application 2020 & 2033
- Table 33: Global Electronic Grade Ultra Thin Glass Revenue million Forecast, by Type 2020 & 2033
- Table 34: Global Electronic Grade Ultra Thin Glass Volume K Forecast, by Type 2020 & 2033
- Table 35: Global Electronic Grade Ultra Thin Glass Revenue million Forecast, by Country 2020 & 2033
- Table 36: Global Electronic Grade Ultra Thin Glass Volume K Forecast, by Country 2020 & 2033
- Table 37: United Kingdom Electronic Grade Ultra Thin Glass Revenue (million) Forecast, by Application 2020 & 2033
- Table 38: United Kingdom Electronic Grade Ultra Thin Glass Volume (K) Forecast, by Application 2020 & 2033
- Table 39: Germany Electronic Grade Ultra Thin Glass Revenue (million) Forecast, by Application 2020 & 2033
- Table 40: Germany Electronic Grade Ultra Thin Glass Volume (K) Forecast, by Application 2020 & 2033
- Table 41: France Electronic Grade Ultra Thin Glass Revenue (million) Forecast, by Application 2020 & 2033
- Table 42: France Electronic Grade Ultra Thin Glass Volume (K) Forecast, by Application 2020 & 2033
- Table 43: Italy Electronic Grade Ultra Thin Glass Revenue (million) Forecast, by Application 2020 & 2033
- Table 44: Italy Electronic Grade Ultra Thin Glass Volume (K) Forecast, by Application 2020 & 2033
- Table 45: Spain Electronic Grade Ultra Thin Glass Revenue (million) Forecast, by Application 2020 & 2033
- Table 46: Spain Electronic Grade Ultra Thin Glass Volume (K) Forecast, by Application 2020 & 2033
- Table 47: Russia Electronic Grade Ultra Thin Glass Revenue (million) Forecast, by Application 2020 & 2033
- Table 48: Russia Electronic Grade Ultra Thin Glass Volume (K) Forecast, by Application 2020 & 2033
- Table 49: Benelux Electronic Grade Ultra Thin Glass Revenue (million) Forecast, by Application 2020 & 2033
- Table 50: Benelux Electronic Grade Ultra Thin Glass Volume (K) Forecast, by Application 2020 & 2033
- Table 51: Nordics Electronic Grade Ultra Thin Glass Revenue (million) Forecast, by Application 2020 & 2033
- Table 52: Nordics Electronic Grade Ultra Thin Glass Volume (K) Forecast, by Application 2020 & 2033
- Table 53: Rest of Europe Electronic Grade Ultra Thin Glass Revenue (million) Forecast, by Application 2020 & 2033
- Table 54: Rest of Europe Electronic Grade Ultra Thin Glass Volume (K) Forecast, by Application 2020 & 2033
- Table 55: Global Electronic Grade Ultra Thin Glass Revenue million Forecast, by Application 2020 & 2033
- Table 56: Global Electronic Grade Ultra Thin Glass Volume K Forecast, by Application 2020 & 2033
- Table 57: Global Electronic Grade Ultra Thin Glass Revenue million Forecast, by Type 2020 & 2033
- Table 58: Global Electronic Grade Ultra Thin Glass Volume K Forecast, by Type 2020 & 2033
- Table 59: Global Electronic Grade Ultra Thin Glass Revenue million Forecast, by Country 2020 & 2033
- Table 60: Global Electronic Grade Ultra Thin Glass Volume K Forecast, by Country 2020 & 2033
- Table 61: Turkey Electronic Grade Ultra Thin Glass Revenue (million) Forecast, by Application 2020 & 2033
- Table 62: Turkey Electronic Grade Ultra Thin Glass Volume (K) Forecast, by Application 2020 & 2033
- Table 63: Israel Electronic Grade Ultra Thin Glass Revenue (million) Forecast, by Application 2020 & 2033
- Table 64: Israel Electronic Grade Ultra Thin Glass Volume (K) Forecast, by Application 2020 & 2033
- Table 65: GCC Electronic Grade Ultra Thin Glass Revenue (million) Forecast, by Application 2020 & 2033
- Table 66: GCC Electronic Grade Ultra Thin Glass Volume (K) Forecast, by Application 2020 & 2033
- Table 67: North Africa Electronic Grade Ultra Thin Glass Revenue (million) Forecast, by Application 2020 & 2033
- Table 68: North Africa Electronic Grade Ultra Thin Glass Volume (K) Forecast, by Application 2020 & 2033
- Table 69: South Africa Electronic Grade Ultra Thin Glass Revenue (million) Forecast, by Application 2020 & 2033
- Table 70: South Africa Electronic Grade Ultra Thin Glass Volume (K) Forecast, by Application 2020 & 2033
- Table 71: Rest of Middle East & Africa Electronic Grade Ultra Thin Glass Revenue (million) Forecast, by Application 2020 & 2033
- Table 72: Rest of Middle East & Africa Electronic Grade Ultra Thin Glass Volume (K) Forecast, by Application 2020 & 2033
- Table 73: Global Electronic Grade Ultra Thin Glass Revenue million Forecast, by Application 2020 & 2033
- Table 74: Global Electronic Grade Ultra Thin Glass Volume K Forecast, by Application 2020 & 2033
- Table 75: Global Electronic Grade Ultra Thin Glass Revenue million Forecast, by Type 2020 & 2033
- Table 76: Global Electronic Grade Ultra Thin Glass Volume K Forecast, by Type 2020 & 2033
- Table 77: Global Electronic Grade Ultra Thin Glass Revenue million Forecast, by Country 2020 & 2033
- Table 78: Global Electronic Grade Ultra Thin Glass Volume K Forecast, by Country 2020 & 2033
- Table 79: China Electronic Grade Ultra Thin Glass Revenue (million) Forecast, by Application 2020 & 2033
- Table 80: China Electronic Grade Ultra Thin Glass Volume (K) Forecast, by Application 2020 & 2033
- Table 81: India Electronic Grade Ultra Thin Glass Revenue (million) Forecast, by Application 2020 & 2033
- Table 82: India Electronic Grade Ultra Thin Glass Volume (K) Forecast, by Application 2020 & 2033
- Table 83: Japan Electronic Grade Ultra Thin Glass Revenue (million) Forecast, by Application 2020 & 2033
- Table 84: Japan Electronic Grade Ultra Thin Glass Volume (K) Forecast, by Application 2020 & 2033
- Table 85: South Korea Electronic Grade Ultra Thin Glass Revenue (million) Forecast, by Application 2020 & 2033
- Table 86: South Korea Electronic Grade Ultra Thin Glass Volume (K) Forecast, by Application 2020 & 2033
- Table 87: ASEAN Electronic Grade Ultra Thin Glass Revenue (million) Forecast, by Application 2020 & 2033
- Table 88: ASEAN Electronic Grade Ultra Thin Glass Volume (K) Forecast, by Application 2020 & 2033
- Table 89: Oceania Electronic Grade Ultra Thin Glass Revenue (million) Forecast, by Application 2020 & 2033
- Table 90: Oceania Electronic Grade Ultra Thin Glass Volume (K) Forecast, by Application 2020 & 2033
- Table 91: Rest of Asia Pacific Electronic Grade Ultra Thin Glass Revenue (million) Forecast, by Application 2020 & 2033
- Table 92: Rest of Asia Pacific Electronic Grade Ultra Thin Glass Volume (K) Forecast, by Application 2020 & 2033
Frequently Asked Questions
1. What is the projected Compound Annual Growth Rate (CAGR) of the Electronic Grade Ultra Thin Glass?
The projected CAGR is approximately 4.5%.
2. Which companies are prominent players in the Electronic Grade Ultra Thin Glass?
Key companies in the market include Corning, AGC, Nippon Electric Glass, Schott, CSG Holding, NSG, Caihong Display Devices, Luoyang Glass, Taiwan Glass, Triumph Science&Technology.
3. What are the main segments of the Electronic Grade Ultra Thin Glass?
The market segments include Application, Type.
4. Can you provide details about the market size?
The market size is estimated to be USD 2927 million as of 2022.
5. What are some drivers contributing to market growth?
N/A
6. What are the notable trends driving market growth?
N/A
7. Are there any restraints impacting market growth?
N/A
8. Can you provide examples of recent developments in the market?
N/A
9. What pricing options are available for accessing the report?
Pricing options include single-user, multi-user, and enterprise licenses priced at USD 3950.00, USD 5925.00, and USD 7900.00 respectively.
10. Is the market size provided in terms of value or volume?
The market size is provided in terms of value, measured in million and volume, measured in K.
11. Are there any specific market keywords associated with the report?
Yes, the market keyword associated with the report is "Electronic Grade Ultra Thin Glass," which aids in identifying and referencing the specific market segment covered.
12. How do I determine which pricing option suits my needs best?
The pricing options vary based on user requirements and access needs. Individual users may opt for single-user licenses, while businesses requiring broader access may choose multi-user or enterprise licenses for cost-effective access to the report.
13. Are there any additional resources or data provided in the Electronic Grade Ultra Thin Glass report?
While the report offers comprehensive insights, it's advisable to review the specific contents or supplementary materials provided to ascertain if additional resources or data are available.
14. How can I stay updated on further developments or reports in the Electronic Grade Ultra Thin Glass?
To stay informed about further developments, trends, and reports in the Electronic Grade Ultra Thin Glass, consider subscribing to industry newsletters, following relevant companies and organizations, or regularly checking reputable industry news sources and publications.
Methodology
Step 1 - Identification of Relevant Samples Size from Population Database


Step 2 - Approaches for Defining Global Market Size (Value, Volume* & Price*)

Note*: In applicable scenarios
Step 3 - Data Sources
Primary Research
- Web Analytics
- Survey Reports
- Research Institute
- Latest Research Reports
- Opinion Leaders
Secondary Research
- Annual Reports
- White Paper
- Latest Press Release
- Industry Association
- Paid Database
- Investor Presentations

Step 4 - Data Triangulation
Involves using different sources of information in order to increase the validity of a study
These sources are likely to be stakeholders in a program - participants, other researchers, program staff, other community members, and so on.
Then we put all data in single framework & apply various statistical tools to find out the dynamic on the market.
During the analysis stage, feedback from the stakeholder groups would be compared to determine areas of agreement as well as areas of divergence