

Key Insights
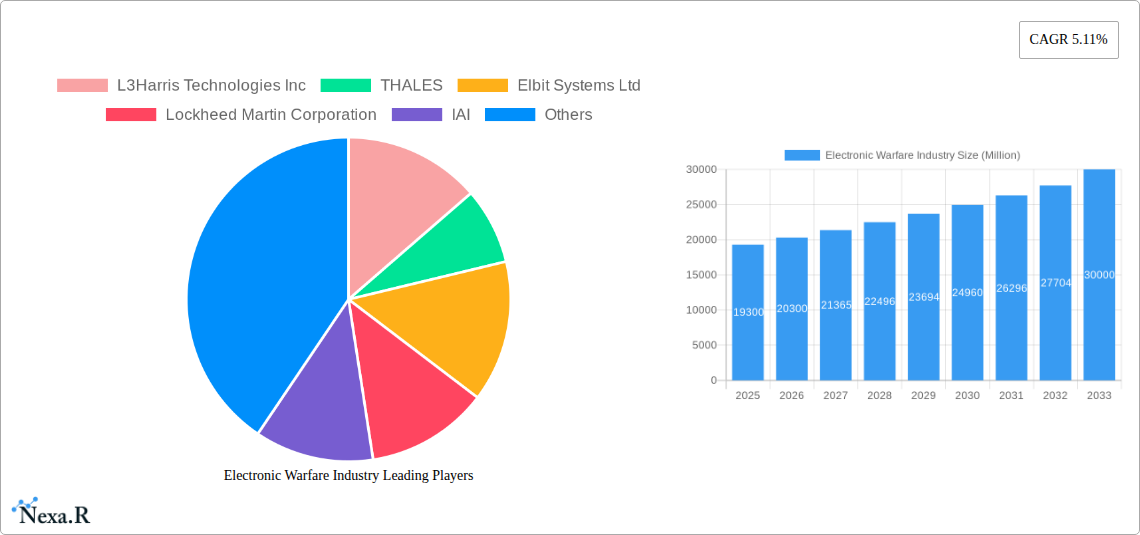
The Electronic Warfare (EW) market, valued at $19.30 billion in 2025, is projected to experience robust growth, driven by escalating geopolitical tensions and the increasing sophistication of military technologies. A Compound Annual Growth Rate (CAGR) of 5.11% from 2025 to 2033 indicates a significant expansion of the market to approximately $30 billion by 2033. Key drivers include the modernization of armed forces globally, the rise of asymmetric warfare necessitating advanced EW capabilities, and the integration of EW systems into next-generation platforms like unmanned aerial vehicles (UAVs) and hypersonic weapons. Growth is further fueled by technological advancements in areas such as artificial intelligence (AI) and machine learning (ML) which enhance EW systems' effectiveness. Market segmentation reveals strong demand across all platforms (air, sea, land, and space), with Electronic Attack (EA) capabilities commanding a significant share due to its offensive nature and ability to disrupt enemy operations. While the market faces certain restraints like the high cost of development and deployment of these advanced systems and the potential for technological obsolescence, the overall outlook remains positive due to continuous investment in defense budgets worldwide and the persistent need for effective EW countermeasures.
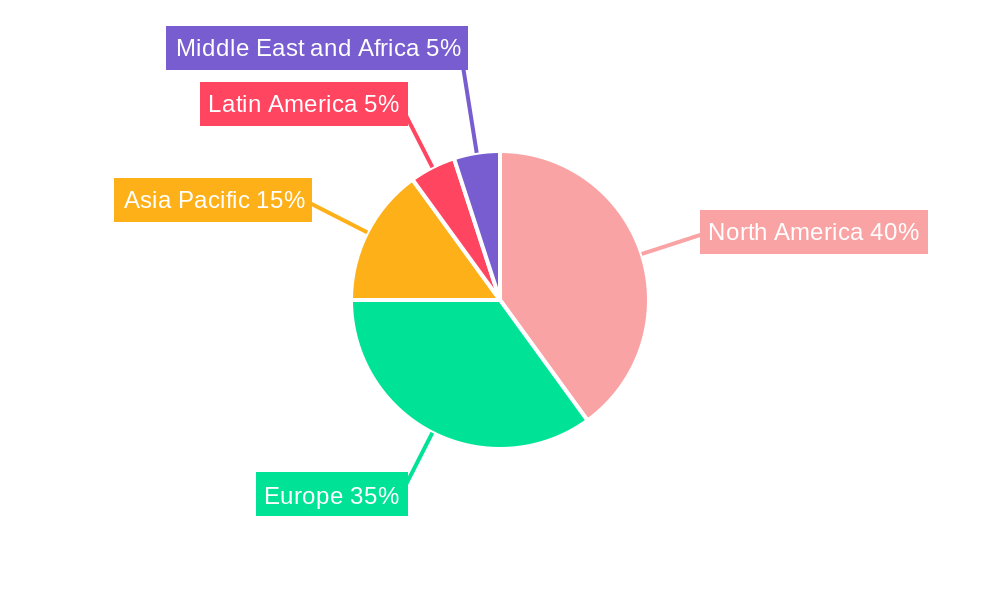
The regional breakdown shows North America and Europe currently holding substantial market shares, owing to established defense industries and high technological advancements. However, the Asia-Pacific region is anticipated to witness rapid growth in the coming years driven by increased military spending from countries like China and India. The increasing focus on cybersecurity and the integration of EW technologies into commercial applications, such as protecting critical infrastructure, will also contribute to overall market expansion. Prominent players such as L3Harris Technologies, Thales, Elbit Systems, Lockheed Martin, and others are actively engaged in research and development, strategic partnerships, and mergers and acquisitions to maintain their competitive edge and capitalize on this expanding market. The ongoing advancements in EW technology and the rise of new threats will continuously shape market dynamics, creating opportunities for innovation and further growth throughout the forecast period.
Electronic Warfare Industry Market Report: 2019-2033
This comprehensive report provides an in-depth analysis of the Electronic Warfare (EW) industry, encompassing market dynamics, growth trends, key players, and future outlook. The study period covers 2019-2033, with 2025 as the base and estimated year. The forecast period is 2025-2033, and the historical period is 2019-2024. The total market size is predicted to reach xx Million units by 2033.
Electronic Warfare Industry Market Dynamics & Structure
The Electronic Warfare market is a highly concentrated industry, with a few major players holding significant market share. The market is characterized by continuous technological innovation, driven by the need for advanced capabilities to counter evolving threats. Stringent regulatory frameworks and export controls further shape the competitive landscape. Substitutes are limited, mostly focusing on alternative defensive or offensive technologies. End-users primarily include defense ministries, armed forces, and intelligence agencies globally. M&A activity is relatively frequent, aiming to consolidate capabilities and expand market reach.
- Market Concentration: The top 10 players hold approximately 75% market share in 2025.
- Technological Innovation: Focus on AI, machine learning, and advanced signal processing.
- Regulatory Frameworks: Stringent export controls and licensing requirements.
- M&A Activity: Average of 15-20 significant deals per year since 2019 (estimated).
Electronic Warfare Industry Growth Trends & Insights
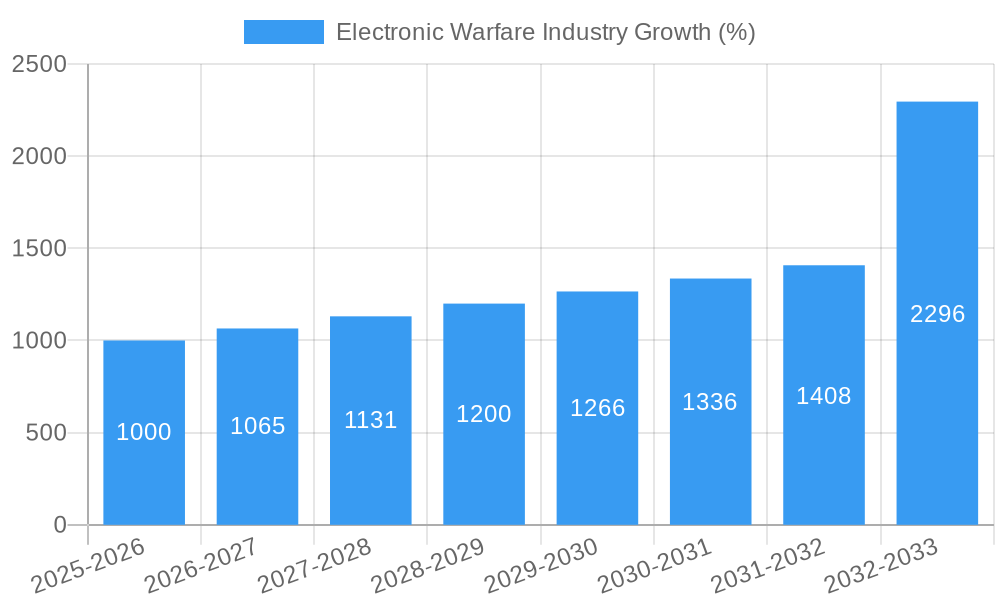
The Electronic Warfare market has experienced steady growth over the past few years, driven by increasing geopolitical instability, modernization of military forces, and the rising demand for sophisticated EW systems. The adoption rate of advanced EW technologies is increasing, with a particular focus on network-centric warfare and cyber defense. Technological disruptions, such as the proliferation of directed energy weapons and advanced jamming techniques, are reshaping the market. Consumer behavior shifts involve a higher preference for integrated systems and improved interoperability. The CAGR from 2025 to 2033 is projected to be 5%, resulting in a market size of xx Million units by 2033. Market penetration is steadily increasing, particularly in emerging economies.
Dominant Regions, Countries, or Segments in Electronic Warfare Industry
North America currently dominates the Electronic Warfare market, driven by substantial defense budgets and technological advancements. Within capabilities, Electronic Attack holds the largest market share due to increased demand for offensive EW capabilities. The Air platform segment is the most significant, fueled by upgrades to existing air fleets and the development of new combat aircraft.
- North America: High defense spending and technological leadership.
- Europe: Significant investments in EW capabilities within NATO framework.
- Asia-Pacific: Rapid military modernization driving growth, particularly in China and India.
- Electronic Attack: Largest segment due to its offensive nature.
- Air Platform: Highest demand due to prevalence of air-based EW operations.
Electronic Warfare Industry Product Landscape
The Electronic Warfare product landscape is characterized by sophisticated systems combining electronic attack, electronic protection, and electronic support capabilities. Recent innovations focus on improving signal processing, reducing size, weight, and power (SWaP), and enhancing system integration. Products are increasingly incorporating AI and machine learning for improved threat detection and response. Unique selling propositions emphasize improved accuracy, higher effectiveness against advanced threats, and greater interoperability within broader military systems.
Key Drivers, Barriers & Challenges in Electronic Warfare Industry
Key Drivers:
- Increasing geopolitical tensions and conflicts
- Modernization of military forces globally
- Rising demand for cyber defense capabilities
- Technological advancements (AI, machine learning)
Key Challenges:
- High development and procurement costs
- Complex integration challenges across platforms
- Supply chain disruptions, impacting component availability. These lead to a projected 3-5% increase in overall product costs from 2025-2028.
- Stringent regulatory frameworks and export controls.
Emerging Opportunities in Electronic Warfare Industry
Emerging opportunities include the development of:
- Next-generation electronic attack systems with advanced capabilities.
- Improved electronic protection systems against emerging threats.
- Integration of EW systems into broader cyber defense strategies.
- Expansion into commercial markets (e.g., drone countermeasures).
Growth Accelerators in the Electronic Warfare Industry
Long-term growth will be accelerated by technological breakthroughs in areas such as AI, directed energy weapons, and hypersonic missile defense. Strategic partnerships between defense contractors and technology companies will also play a crucial role, facilitating innovation and market expansion. The adoption of open systems architecture, improving interoperability, will drive further growth.
Key Players Shaping the Electronic Warfare Industry Market
- L3Harris Technologies Inc
- THALES
- Elbit Systems Ltd
- Lockheed Martin Corporation
- IAI
- RTX Corporation
- ASELSAN A S
- Leonardo S p A
- BAE Systems plc
- Northrop Grumman Corporation
- Saab AB
- HENSOLDT A
Notable Milestones in Electronic Warfare Industry Sector
- 2021: Successful testing of a new generation of electronic attack pod.
- 2022: Launch of a new EW system integration platform.
- 2023: Major merger between two leading EW companies. (specific details not publicly available – needs additional research)
- 2024: Significant government investment in advanced EW research.
In-Depth Electronic Warfare Industry Market Outlook
The future of the Electronic Warfare market is bright. Continuous technological advancements, coupled with increasing global defense spending and the emergence of new threats, will fuel significant growth over the coming years. Strategic partnerships, the development of advanced capabilities, and expansion into untapped markets will create substantial opportunities for key players. The market is poised for sustained expansion, with significant potential for further growth and innovation.
Electronic Warfare Industry Segmentation
-
1. Capability
- 1.1. Electronic Attack
- 1.2. Electronic Protection
- 1.3. Electronic Support
-
2. Platform
- 2.1. Air
- 2.2. Sea
- 2.3. Land
- 2.4. Space
Electronic Warfare Industry Segmentation By Geography
-
1. North America
- 1.1. United States
- 1.2. Canda
-
2. Europe
- 2.1. United Kingdom
- 2.2. Germany
- 2.3. France
- 2.4. Russia
- 2.5. Rest of Europe
-
3. Asia Pacific
- 3.1. China
- 3.2. India
- 3.3. Japan
- 3.4. South Korea
- 3.5. Rest of Asia Pacific
-
4. Latin America
- 4.1. Brazil
- 4.2. Mexico
- 4.3. Rest of Latin America
-
5. Middle East and Africa
- 5.1. Saudi Arabia
- 5.2. United Arab Emirates
- 5.3. Rest of Middle East and Africa
Electronic Warfare Industry REPORT HIGHLIGHTS
| Aspects | Details |
|---|---|
| Study Period | 2019-2033 |
| Base Year | 2024 |
| Estimated Year | 2025 |
| Forecast Period | 2025-2033 |
| Historical Period | 2019-2024 |
| Growth Rate | CAGR of 5.11% from 2019-2033 |
| Segmentation |
|
Table of Contents
- 1. Introduction
- 1.1. Research Scope
- 1.2. Market Segmentation
- 1.3. Research Methodology
- 1.4. Definitions and Assumptions
- 2. Executive Summary
- 2.1. Introduction
- 3. Market Dynamics
- 3.1. Introduction
- 3.2. Market Drivers
- 3.2.1. Increase in Internet of Things (IoT) and Autonomous Systems; Rise in Demand for Military and Defense Satellite Communication Solutions
- 3.3. Market Restrains
- 3.3.1. Cybersecurity Threats to Satellite Communication; Interference in Transmission of Data
- 3.4. Market Trends
- 3.4.1. Sea Segment Will Showcase Remarkable Growth During the Forecast Period
- 4. Market Factor Analysis
- 4.1. Porters Five Forces
- 4.2. Supply/Value Chain
- 4.3. PESTEL analysis
- 4.4. Market Entropy
- 4.5. Patent/Trademark Analysis
- 5. Global Electronic Warfare Industry Analysis, Insights and Forecast, 2019-2031
- 5.1. Market Analysis, Insights and Forecast - by Capability
- 5.1.1. Electronic Attack
- 5.1.2. Electronic Protection
- 5.1.3. Electronic Support
- 5.2. Market Analysis, Insights and Forecast - by Platform
- 5.2.1. Air
- 5.2.2. Sea
- 5.2.3. Land
- 5.2.4. Space
- 5.3. Market Analysis, Insights and Forecast - by Region
- 5.3.1. North America
- 5.3.2. Europe
- 5.3.3. Asia Pacific
- 5.3.4. Latin America
- 5.3.5. Middle East and Africa
- 5.1. Market Analysis, Insights and Forecast - by Capability
- 6. North America Electronic Warfare Industry Analysis, Insights and Forecast, 2019-2031
- 6.1. Market Analysis, Insights and Forecast - by Capability
- 6.1.1. Electronic Attack
- 6.1.2. Electronic Protection
- 6.1.3. Electronic Support
- 6.2. Market Analysis, Insights and Forecast - by Platform
- 6.2.1. Air
- 6.2.2. Sea
- 6.2.3. Land
- 6.2.4. Space
- 6.1. Market Analysis, Insights and Forecast - by Capability
- 7. Europe Electronic Warfare Industry Analysis, Insights and Forecast, 2019-2031
- 7.1. Market Analysis, Insights and Forecast - by Capability
- 7.1.1. Electronic Attack
- 7.1.2. Electronic Protection
- 7.1.3. Electronic Support
- 7.2. Market Analysis, Insights and Forecast - by Platform
- 7.2.1. Air
- 7.2.2. Sea
- 7.2.3. Land
- 7.2.4. Space
- 7.1. Market Analysis, Insights and Forecast - by Capability
- 8. Asia Pacific Electronic Warfare Industry Analysis, Insights and Forecast, 2019-2031
- 8.1. Market Analysis, Insights and Forecast - by Capability
- 8.1.1. Electronic Attack
- 8.1.2. Electronic Protection
- 8.1.3. Electronic Support
- 8.2. Market Analysis, Insights and Forecast - by Platform
- 8.2.1. Air
- 8.2.2. Sea
- 8.2.3. Land
- 8.2.4. Space
- 8.1. Market Analysis, Insights and Forecast - by Capability
- 9. Latin America Electronic Warfare Industry Analysis, Insights and Forecast, 2019-2031
- 9.1. Market Analysis, Insights and Forecast - by Capability
- 9.1.1. Electronic Attack
- 9.1.2. Electronic Protection
- 9.1.3. Electronic Support
- 9.2. Market Analysis, Insights and Forecast - by Platform
- 9.2.1. Air
- 9.2.2. Sea
- 9.2.3. Land
- 9.2.4. Space
- 9.1. Market Analysis, Insights and Forecast - by Capability
- 10. Middle East and Africa Electronic Warfare Industry Analysis, Insights and Forecast, 2019-2031
- 10.1. Market Analysis, Insights and Forecast - by Capability
- 10.1.1. Electronic Attack
- 10.1.2. Electronic Protection
- 10.1.3. Electronic Support
- 10.2. Market Analysis, Insights and Forecast - by Platform
- 10.2.1. Air
- 10.2.2. Sea
- 10.2.3. Land
- 10.2.4. Space
- 10.1. Market Analysis, Insights and Forecast - by Capability
- 11. North America Electronic Warfare Industry Analysis, Insights and Forecast, 2019-2031
- 11.1. Market Analysis, Insights and Forecast - By Country/Sub-region
- 11.1.1 United States
- 11.1.2 Canda
- 12. Europe Electronic Warfare Industry Analysis, Insights and Forecast, 2019-2031
- 12.1. Market Analysis, Insights and Forecast - By Country/Sub-region
- 12.1.1 United Kingdom
- 12.1.2 Germany
- 12.1.3 France
- 12.1.4 Russia
- 12.1.5 Rest of Europe
- 13. Asia Pacific Electronic Warfare Industry Analysis, Insights and Forecast, 2019-2031
- 13.1. Market Analysis, Insights and Forecast - By Country/Sub-region
- 13.1.1 China
- 13.1.2 India
- 13.1.3 Japan
- 13.1.4 South Korea
- 13.1.5 Rest of Asia Pacific
- 14. Latin America Electronic Warfare Industry Analysis, Insights and Forecast, 2019-2031
- 14.1. Market Analysis, Insights and Forecast - By Country/Sub-region
- 14.1.1 Brazil
- 14.1.2 Mexico
- 14.1.3 Rest of Latin America
- 15. Middle East and Africa Electronic Warfare Industry Analysis, Insights and Forecast, 2019-2031
- 15.1. Market Analysis, Insights and Forecast - By Country/Sub-region
- 15.1.1 Saudi Arabia
- 15.1.2 United Arab Emirates
- 15.1.3 Rest of Middle East and Africa
- 16. Competitive Analysis
- 16.1. Global Market Share Analysis 2024
- 16.2. Company Profiles
- 16.2.1 L3Harris Technologies Inc
- 16.2.1.1. Overview
- 16.2.1.2. Products
- 16.2.1.3. SWOT Analysis
- 16.2.1.4. Recent Developments
- 16.2.1.5. Financials (Based on Availability)
- 16.2.2 THALES
- 16.2.2.1. Overview
- 16.2.2.2. Products
- 16.2.2.3. SWOT Analysis
- 16.2.2.4. Recent Developments
- 16.2.2.5. Financials (Based on Availability)
- 16.2.3 Elbit Systems Ltd
- 16.2.3.1. Overview
- 16.2.3.2. Products
- 16.2.3.3. SWOT Analysis
- 16.2.3.4. Recent Developments
- 16.2.3.5. Financials (Based on Availability)
- 16.2.4 Lockheed Martin Corporation
- 16.2.4.1. Overview
- 16.2.4.2. Products
- 16.2.4.3. SWOT Analysis
- 16.2.4.4. Recent Developments
- 16.2.4.5. Financials (Based on Availability)
- 16.2.5 IAI
- 16.2.5.1. Overview
- 16.2.5.2. Products
- 16.2.5.3. SWOT Analysis
- 16.2.5.4. Recent Developments
- 16.2.5.5. Financials (Based on Availability)
- 16.2.6 RTX Corporation
- 16.2.6.1. Overview
- 16.2.6.2. Products
- 16.2.6.3. SWOT Analysis
- 16.2.6.4. Recent Developments
- 16.2.6.5. Financials (Based on Availability)
- 16.2.7 ASELSAN A S
- 16.2.7.1. Overview
- 16.2.7.2. Products
- 16.2.7.3. SWOT Analysis
- 16.2.7.4. Recent Developments
- 16.2.7.5. Financials (Based on Availability)
- 16.2.8 Leonardo S p A
- 16.2.8.1. Overview
- 16.2.8.2. Products
- 16.2.8.3. SWOT Analysis
- 16.2.8.4. Recent Developments
- 16.2.8.5. Financials (Based on Availability)
- 16.2.9 BAE Systems plc
- 16.2.9.1. Overview
- 16.2.9.2. Products
- 16.2.9.3. SWOT Analysis
- 16.2.9.4. Recent Developments
- 16.2.9.5. Financials (Based on Availability)
- 16.2.10 Northrop Grumman Corporation
- 16.2.10.1. Overview
- 16.2.10.2. Products
- 16.2.10.3. SWOT Analysis
- 16.2.10.4. Recent Developments
- 16.2.10.5. Financials (Based on Availability)
- 16.2.11 Saab AB
- 16.2.11.1. Overview
- 16.2.11.2. Products
- 16.2.11.3. SWOT Analysis
- 16.2.11.4. Recent Developments
- 16.2.11.5. Financials (Based on Availability)
- 16.2.12 HENSOLDT A
- 16.2.12.1. Overview
- 16.2.12.2. Products
- 16.2.12.3. SWOT Analysis
- 16.2.12.4. Recent Developments
- 16.2.12.5. Financials (Based on Availability)
- 16.2.1 L3Harris Technologies Inc
List of Figures
- Figure 1: Global Electronic Warfare Industry Revenue Breakdown (Million, %) by Region 2024 & 2032
- Figure 2: North America Electronic Warfare Industry Revenue (Million), by Country 2024 & 2032
- Figure 3: North America Electronic Warfare Industry Revenue Share (%), by Country 2024 & 2032
- Figure 4: Europe Electronic Warfare Industry Revenue (Million), by Country 2024 & 2032
- Figure 5: Europe Electronic Warfare Industry Revenue Share (%), by Country 2024 & 2032
- Figure 6: Asia Pacific Electronic Warfare Industry Revenue (Million), by Country 2024 & 2032
- Figure 7: Asia Pacific Electronic Warfare Industry Revenue Share (%), by Country 2024 & 2032
- Figure 8: Latin America Electronic Warfare Industry Revenue (Million), by Country 2024 & 2032
- Figure 9: Latin America Electronic Warfare Industry Revenue Share (%), by Country 2024 & 2032
- Figure 10: Middle East and Africa Electronic Warfare Industry Revenue (Million), by Country 2024 & 2032
- Figure 11: Middle East and Africa Electronic Warfare Industry Revenue Share (%), by Country 2024 & 2032
- Figure 12: North America Electronic Warfare Industry Revenue (Million), by Capability 2024 & 2032
- Figure 13: North America Electronic Warfare Industry Revenue Share (%), by Capability 2024 & 2032
- Figure 14: North America Electronic Warfare Industry Revenue (Million), by Platform 2024 & 2032
- Figure 15: North America Electronic Warfare Industry Revenue Share (%), by Platform 2024 & 2032
- Figure 16: North America Electronic Warfare Industry Revenue (Million), by Country 2024 & 2032
- Figure 17: North America Electronic Warfare Industry Revenue Share (%), by Country 2024 & 2032
- Figure 18: Europe Electronic Warfare Industry Revenue (Million), by Capability 2024 & 2032
- Figure 19: Europe Electronic Warfare Industry Revenue Share (%), by Capability 2024 & 2032
- Figure 20: Europe Electronic Warfare Industry Revenue (Million), by Platform 2024 & 2032
- Figure 21: Europe Electronic Warfare Industry Revenue Share (%), by Platform 2024 & 2032
- Figure 22: Europe Electronic Warfare Industry Revenue (Million), by Country 2024 & 2032
- Figure 23: Europe Electronic Warfare Industry Revenue Share (%), by Country 2024 & 2032
- Figure 24: Asia Pacific Electronic Warfare Industry Revenue (Million), by Capability 2024 & 2032
- Figure 25: Asia Pacific Electronic Warfare Industry Revenue Share (%), by Capability 2024 & 2032
- Figure 26: Asia Pacific Electronic Warfare Industry Revenue (Million), by Platform 2024 & 2032
- Figure 27: Asia Pacific Electronic Warfare Industry Revenue Share (%), by Platform 2024 & 2032
- Figure 28: Asia Pacific Electronic Warfare Industry Revenue (Million), by Country 2024 & 2032
- Figure 29: Asia Pacific Electronic Warfare Industry Revenue Share (%), by Country 2024 & 2032
- Figure 30: Latin America Electronic Warfare Industry Revenue (Million), by Capability 2024 & 2032
- Figure 31: Latin America Electronic Warfare Industry Revenue Share (%), by Capability 2024 & 2032
- Figure 32: Latin America Electronic Warfare Industry Revenue (Million), by Platform 2024 & 2032
- Figure 33: Latin America Electronic Warfare Industry Revenue Share (%), by Platform 2024 & 2032
- Figure 34: Latin America Electronic Warfare Industry Revenue (Million), by Country 2024 & 2032
- Figure 35: Latin America Electronic Warfare Industry Revenue Share (%), by Country 2024 & 2032
- Figure 36: Middle East and Africa Electronic Warfare Industry Revenue (Million), by Capability 2024 & 2032
- Figure 37: Middle East and Africa Electronic Warfare Industry Revenue Share (%), by Capability 2024 & 2032
- Figure 38: Middle East and Africa Electronic Warfare Industry Revenue (Million), by Platform 2024 & 2032
- Figure 39: Middle East and Africa Electronic Warfare Industry Revenue Share (%), by Platform 2024 & 2032
- Figure 40: Middle East and Africa Electronic Warfare Industry Revenue (Million), by Country 2024 & 2032
- Figure 41: Middle East and Africa Electronic Warfare Industry Revenue Share (%), by Country 2024 & 2032
List of Tables
- Table 1: Global Electronic Warfare Industry Revenue Million Forecast, by Region 2019 & 2032
- Table 2: Global Electronic Warfare Industry Revenue Million Forecast, by Capability 2019 & 2032
- Table 3: Global Electronic Warfare Industry Revenue Million Forecast, by Platform 2019 & 2032
- Table 4: Global Electronic Warfare Industry Revenue Million Forecast, by Region 2019 & 2032
- Table 5: Global Electronic Warfare Industry Revenue Million Forecast, by Country 2019 & 2032
- Table 6: United States Electronic Warfare Industry Revenue (Million) Forecast, by Application 2019 & 2032
- Table 7: Canda Electronic Warfare Industry Revenue (Million) Forecast, by Application 2019 & 2032
- Table 8: Global Electronic Warfare Industry Revenue Million Forecast, by Country 2019 & 2032
- Table 9: United Kingdom Electronic Warfare Industry Revenue (Million) Forecast, by Application 2019 & 2032
- Table 10: Germany Electronic Warfare Industry Revenue (Million) Forecast, by Application 2019 & 2032
- Table 11: France Electronic Warfare Industry Revenue (Million) Forecast, by Application 2019 & 2032
- Table 12: Russia Electronic Warfare Industry Revenue (Million) Forecast, by Application 2019 & 2032
- Table 13: Rest of Europe Electronic Warfare Industry Revenue (Million) Forecast, by Application 2019 & 2032
- Table 14: Global Electronic Warfare Industry Revenue Million Forecast, by Country 2019 & 2032
- Table 15: China Electronic Warfare Industry Revenue (Million) Forecast, by Application 2019 & 2032
- Table 16: India Electronic Warfare Industry Revenue (Million) Forecast, by Application 2019 & 2032
- Table 17: Japan Electronic Warfare Industry Revenue (Million) Forecast, by Application 2019 & 2032
- Table 18: South Korea Electronic Warfare Industry Revenue (Million) Forecast, by Application 2019 & 2032
- Table 19: Rest of Asia Pacific Electronic Warfare Industry Revenue (Million) Forecast, by Application 2019 & 2032
- Table 20: Global Electronic Warfare Industry Revenue Million Forecast, by Country 2019 & 2032
- Table 21: Brazil Electronic Warfare Industry Revenue (Million) Forecast, by Application 2019 & 2032
- Table 22: Mexico Electronic Warfare Industry Revenue (Million) Forecast, by Application 2019 & 2032
- Table 23: Rest of Latin America Electronic Warfare Industry Revenue (Million) Forecast, by Application 2019 & 2032
- Table 24: Global Electronic Warfare Industry Revenue Million Forecast, by Country 2019 & 2032
- Table 25: Saudi Arabia Electronic Warfare Industry Revenue (Million) Forecast, by Application 2019 & 2032
- Table 26: United Arab Emirates Electronic Warfare Industry Revenue (Million) Forecast, by Application 2019 & 2032
- Table 27: Rest of Middle East and Africa Electronic Warfare Industry Revenue (Million) Forecast, by Application 2019 & 2032
- Table 28: Global Electronic Warfare Industry Revenue Million Forecast, by Capability 2019 & 2032
- Table 29: Global Electronic Warfare Industry Revenue Million Forecast, by Platform 2019 & 2032
- Table 30: Global Electronic Warfare Industry Revenue Million Forecast, by Country 2019 & 2032
- Table 31: United States Electronic Warfare Industry Revenue (Million) Forecast, by Application 2019 & 2032
- Table 32: Canda Electronic Warfare Industry Revenue (Million) Forecast, by Application 2019 & 2032
- Table 33: Global Electronic Warfare Industry Revenue Million Forecast, by Capability 2019 & 2032
- Table 34: Global Electronic Warfare Industry Revenue Million Forecast, by Platform 2019 & 2032
- Table 35: Global Electronic Warfare Industry Revenue Million Forecast, by Country 2019 & 2032
- Table 36: United Kingdom Electronic Warfare Industry Revenue (Million) Forecast, by Application 2019 & 2032
- Table 37: Germany Electronic Warfare Industry Revenue (Million) Forecast, by Application 2019 & 2032
- Table 38: France Electronic Warfare Industry Revenue (Million) Forecast, by Application 2019 & 2032
- Table 39: Russia Electronic Warfare Industry Revenue (Million) Forecast, by Application 2019 & 2032
- Table 40: Rest of Europe Electronic Warfare Industry Revenue (Million) Forecast, by Application 2019 & 2032
- Table 41: Global Electronic Warfare Industry Revenue Million Forecast, by Capability 2019 & 2032
- Table 42: Global Electronic Warfare Industry Revenue Million Forecast, by Platform 2019 & 2032
- Table 43: Global Electronic Warfare Industry Revenue Million Forecast, by Country 2019 & 2032
- Table 44: China Electronic Warfare Industry Revenue (Million) Forecast, by Application 2019 & 2032
- Table 45: India Electronic Warfare Industry Revenue (Million) Forecast, by Application 2019 & 2032
- Table 46: Japan Electronic Warfare Industry Revenue (Million) Forecast, by Application 2019 & 2032
- Table 47: South Korea Electronic Warfare Industry Revenue (Million) Forecast, by Application 2019 & 2032
- Table 48: Rest of Asia Pacific Electronic Warfare Industry Revenue (Million) Forecast, by Application 2019 & 2032
- Table 49: Global Electronic Warfare Industry Revenue Million Forecast, by Capability 2019 & 2032
- Table 50: Global Electronic Warfare Industry Revenue Million Forecast, by Platform 2019 & 2032
- Table 51: Global Electronic Warfare Industry Revenue Million Forecast, by Country 2019 & 2032
- Table 52: Brazil Electronic Warfare Industry Revenue (Million) Forecast, by Application 2019 & 2032
- Table 53: Mexico Electronic Warfare Industry Revenue (Million) Forecast, by Application 2019 & 2032
- Table 54: Rest of Latin America Electronic Warfare Industry Revenue (Million) Forecast, by Application 2019 & 2032
- Table 55: Global Electronic Warfare Industry Revenue Million Forecast, by Capability 2019 & 2032
- Table 56: Global Electronic Warfare Industry Revenue Million Forecast, by Platform 2019 & 2032
- Table 57: Global Electronic Warfare Industry Revenue Million Forecast, by Country 2019 & 2032
- Table 58: Saudi Arabia Electronic Warfare Industry Revenue (Million) Forecast, by Application 2019 & 2032
- Table 59: United Arab Emirates Electronic Warfare Industry Revenue (Million) Forecast, by Application 2019 & 2032
- Table 60: Rest of Middle East and Africa Electronic Warfare Industry Revenue (Million) Forecast, by Application 2019 & 2032
Frequently Asked Questions
1. What is the projected Compound Annual Growth Rate (CAGR) of the Electronic Warfare Industry?
The projected CAGR is approximately 5.11%.
2. Which companies are prominent players in the Electronic Warfare Industry?
Key companies in the market include L3Harris Technologies Inc, THALES, Elbit Systems Ltd, Lockheed Martin Corporation, IAI, RTX Corporation, ASELSAN A S, Leonardo S p A, BAE Systems plc, Northrop Grumman Corporation, Saab AB, HENSOLDT A.
3. What are the main segments of the Electronic Warfare Industry?
The market segments include Capability, Platform.
4. Can you provide details about the market size?
The market size is estimated to be USD 19.30 Million as of 2022.
5. What are some drivers contributing to market growth?
Increase in Internet of Things (IoT) and Autonomous Systems; Rise in Demand for Military and Defense Satellite Communication Solutions.
6. What are the notable trends driving market growth?
Sea Segment Will Showcase Remarkable Growth During the Forecast Period.
7. Are there any restraints impacting market growth?
Cybersecurity Threats to Satellite Communication; Interference in Transmission of Data.
8. Can you provide examples of recent developments in the market?
N/A
9. What pricing options are available for accessing the report?
Pricing options include single-user, multi-user, and enterprise licenses priced at USD 4750, USD 5250, and USD 8750 respectively.
10. Is the market size provided in terms of value or volume?
The market size is provided in terms of value, measured in Million.
11. Are there any specific market keywords associated with the report?
Yes, the market keyword associated with the report is "Electronic Warfare Industry," which aids in identifying and referencing the specific market segment covered.
12. How do I determine which pricing option suits my needs best?
The pricing options vary based on user requirements and access needs. Individual users may opt for single-user licenses, while businesses requiring broader access may choose multi-user or enterprise licenses for cost-effective access to the report.
13. Are there any additional resources or data provided in the Electronic Warfare Industry report?
While the report offers comprehensive insights, it's advisable to review the specific contents or supplementary materials provided to ascertain if additional resources or data are available.
14. How can I stay updated on further developments or reports in the Electronic Warfare Industry?
To stay informed about further developments, trends, and reports in the Electronic Warfare Industry, consider subscribing to industry newsletters, following relevant companies and organizations, or regularly checking reputable industry news sources and publications.
Methodology
Step 1 - Identification of Relevant Samples Size from Population Database


Step 2 - Approaches for Defining Global Market Size (Value, Volume* & Price*)

Note*: In applicable scenarios
Step 3 - Data Sources
Primary Research
- Web Analytics
- Survey Reports
- Research Institute
- Latest Research Reports
- Opinion Leaders
Secondary Research
- Annual Reports
- White Paper
- Latest Press Release
- Industry Association
- Paid Database
- Investor Presentations

Step 4 - Data Triangulation
Involves using different sources of information in order to increase the validity of a study
These sources are likely to be stakeholders in a program - participants, other researchers, program staff, other community members, and so on.
Then we put all data in single framework & apply various statistical tools to find out the dynamic on the market.
During the analysis stage, feedback from the stakeholder groups would be compared to determine areas of agreement as well as areas of divergence
