

Key Insights
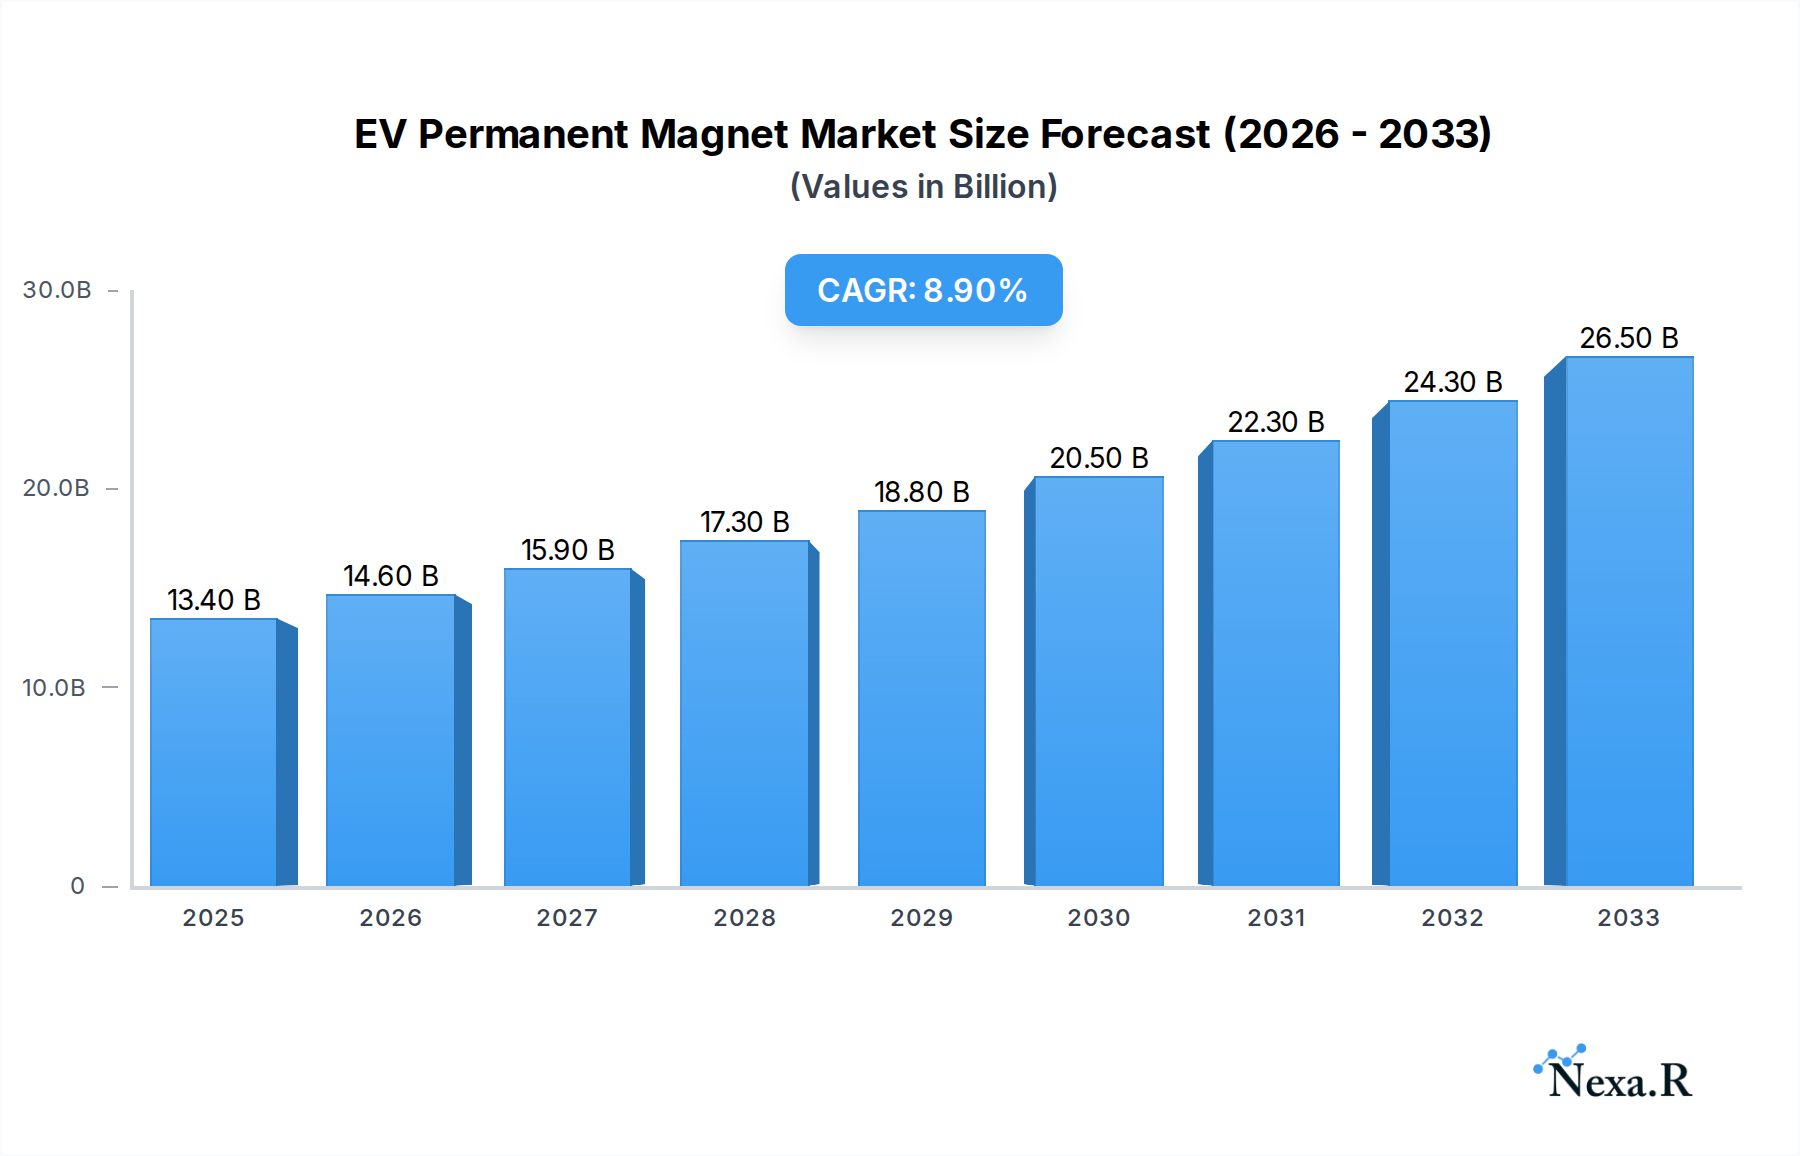
The global EV Permanent Magnet market is poised for substantial growth, projected to reach an estimated USD 13.4 billion in 2025, driven by the accelerating adoption of electric vehicles worldwide. This surge is underpinned by a compelling compound annual growth rate (CAGR) of 9.21% throughout the forecast period of 2025-2033. The primary driver behind this robust expansion is the global shift towards sustainable transportation, propelled by stringent government regulations aimed at reducing carbon emissions and increasing consumer preference for eco-friendly mobility solutions. Furthermore, advancements in battery technology, leading to longer ranges and reduced charging times for EVs, are significantly boosting consumer confidence and demand for electric vehicles, consequently fueling the need for high-performance permanent magnets essential for electric motor efficiency. The increasing focus on lightweight materials and energy efficiency in automotive design also plays a crucial role, as permanent magnets offer superior magnetic properties in a compact and lightweight form factor, contributing to overall vehicle performance and fuel economy.

EV Permanent Magnet Market Size (In Billion)
The market is segmented by application into Commercial Vehicles and Passenger Vehicles, with the latter expected to dominate due to higher production volumes and a rapidly expanding consumer base. By type, Neodymium-Iron-Boron (NdFeB) magnets are anticipated to hold the largest market share owing to their exceptional magnetic strength and cost-effectiveness, making them ideal for high-performance EV motors. While the market is characterized by strong growth, potential restraints include the volatile pricing of rare-earth elements, which are key raw materials for NdFeB magnets, and the complexities associated with their sourcing and recycling. Nevertheless, ongoing research and development efforts focused on exploring alternative magnet materials and improving recycling processes are expected to mitigate these challenges. Leading companies such as TDK Corporation, Shin-Etsu Chemical Co. LTD., and Proterial are actively investing in innovation and capacity expansion to cater to the escalating demand across key regions like Asia Pacific, Europe, and North America.
EV Permanent Magnet Company Market Share
Comprehensive EV Permanent Magnet Market Report: Growth, Trends, and Innovations (2019-2033)
This in-depth report provides a holistic analysis of the global EV Permanent Magnet market, encompassing market dynamics, growth trajectories, regional dominance, product innovations, key drivers, emerging opportunities, and major players. With a study period spanning from 2019 to 2033, including a base year of 2025 and a forecast period of 2025-2033, this report offers critical insights for industry stakeholders. Covering parent and child markets, we delve into applications like Commercial Vehicles and Passenger Vehicles, and types such as NdFeB, SmCo, and Others.
EV Permanent Magnet Market Dynamics & Structure
The EV Permanent Magnet market is characterized by a moderately concentrated structure, with a few leading players holding significant market shares. Technological innovation serves as a primary driver, fueled by the relentless pursuit of higher energy density, improved coercivity, and reduced reliance on critical rare-earth elements. Regulatory frameworks, particularly stringent emission standards and government incentives for EV adoption, are pivotal in shaping market demand. Competitive product substitutes, such as induction motors or alternative magnet materials, exert some pressure, but the superior performance of permanent magnets in electric drivetrains maintains their dominance. End-user demographics are rapidly shifting towards environmentally conscious consumers and fleet operators seeking cost-effective and efficient mobility solutions. Mergers and acquisitions (M&A) are increasingly prevalent as companies seek to secure raw material supply chains, expand their technological capabilities, and gain market access. For instance, the historical period from 2019-2024 witnessed approximately 15 significant M&A deals collectively valued at over $5 billion, indicating a consolidation trend aimed at achieving economies of scale and vertical integration. Innovation barriers, such as high R&D costs for novel magnet compositions and the complex intellectual property landscape, are present but are being overcome through strategic collaborations and government funding.
EV Permanent Magnet Growth Trends & Insights
The global EV Permanent Magnet market is poised for substantial expansion, projected to reach an estimated market size of $45.7 billion by 2025, with a robust Compound Annual Growth Rate (CAGR) of 12.8% anticipated from 2025 to 2033. This growth is intrinsically linked to the accelerating adoption of electric vehicles worldwide, driven by increasing consumer awareness of environmental sustainability and governmental mandates for reduced carbon emissions. By 2033, the market is expected to surpass $110 billion. The market penetration of EVs, currently at approximately 15% globally, is forecast to climb to over 40% by the end of the forecast period, directly translating into a commensurate demand for high-performance permanent magnets. Technological disruptions, such as advancements in rare-earth magnet manufacturing processes, the development of bonded magnets for cost-sensitive applications, and research into rare-earth-free alternatives, are continuously reshaping the competitive landscape. Consumer behavior shifts towards electric mobility are characterized by a growing preference for longer driving ranges, faster charging capabilities, and lower operating costs, all of which are directly influenced by the efficiency and power output of EV motors, where permanent magnets play a critical role. Furthermore, the integration of advanced magnetic materials in next-generation EV powertrains is enabling lighter, more compact, and more powerful motor designs, further stimulating market growth. The increasing average number of permanent magnets per EV, rising from an average of 1.5 in 2019 to an estimated 2.0 in 2025, exemplifies this trend. The historical evolution of the market size, from an estimated $20 billion in 2019 to $38.5 billion in 2024, highlights a strong upward trajectory.
Dominant Regions, Countries, or Segments in EV Permanent Magnet
The Passenger Vehicles segment is the dominant force driving the EV Permanent Magnet market, accounting for an estimated 75% of the total market share in 2025. This dominance is attributed to the sheer volume of passenger vehicles produced globally and the rapid electrification of this consumer-centric market. As of 2025, Passenger Vehicles are projected to represent a market value of $34.3 billion, with a forecast to reach $82.5 billion by 2033. The primary drivers for this segment's leadership include strong government incentives for individual car buyers, the proliferation of charging infrastructure, and the increasing availability of diverse EV models catering to various consumer preferences and price points. Economic policies in major automotive markets, such as China, Europe, and North America, heavily favor EV adoption through subsidies, tax credits, and stricter emission regulations for internal combustion engine (ICE) vehicles. For instance, China, a global leader in EV production and adoption, contributes significantly to this segment's growth, representing an estimated 40% of the global passenger EV market in 2025. North America, with its growing consumer interest and expanding charging networks, is expected to witness a CAGR of 13.5% in the passenger EV segment from 2025 to 2033. Europe's ambitious Green Deal initiatives and stringent CO2 emission targets further bolster demand for EVs in the passenger segment, with an estimated market size of $25 billion in 2025.
The dominance of Passenger Vehicles is further underscored by the prevalence of NdFeB (Neodymium Iron Boron) magnets within this application. NdFeB magnets, known for their high energy product and coercivity, are the preferred choice for the high-performance motors in most passenger EVs. The market share of NdFeB magnets within the Passenger Vehicles application is estimated to be 85% in 2025, valued at $29.1 billion. This preference stems from the need for compact, lightweight, and powerful motors to ensure optimal range and performance for everyday driving. While Commercial Vehicles are also electrifying, their adoption rate, though growing, is currently lower due to factors such as higher upfront costs, range anxiety for long-haul trucking, and the need for robust charging solutions. Nevertheless, the Commercial Vehicles segment is projected to grow at a CAGR of 11.5% from 2025 to 2033, representing a significant growth opportunity.
EV Permanent Magnet Product Landscape
The EV Permanent Magnet product landscape is characterized by continuous innovation, with a focus on enhancing performance metrics such as magnetic flux density, coercivity, and operating temperature range. NdFeB magnets remain the workhorse, offering superior magnetic properties ideal for high-efficiency EV motors. Recent product innovations include advanced coatings for improved corrosion resistance and higher-temperature grades of NdFeB magnets to withstand the demanding thermal conditions within EV powertrains. SmCo magnets, while more expensive, offer exceptional thermal stability and corrosion resistance, making them suitable for specialized high-performance applications and extreme environments. The market is also witnessing advancements in the development of bonded magnets, which are cost-effective and offer greater design flexibility, particularly for less demanding motor applications. Unique selling propositions revolve around increased power density, reduced magnet weight, and enhanced energy efficiency, directly contributing to longer EV driving ranges and improved overall vehicle performance.
Key Drivers, Barriers & Challenges in EV Permanent Magnet
Key Drivers:
- Rapid EV adoption: Increasing consumer demand and government mandates for electric vehicles are the primary growth accelerators.
- Technological advancements: Improvements in magnet material science, manufacturing processes, and motor design enhance EV performance.
- Sustainability initiatives: Growing environmental consciousness and a focus on reducing carbon emissions drive the shift to EVs.
- Government incentives and regulations: Subsidies, tax credits, and emission standards encourage EV sales and production.
Barriers & Challenges:
- Rare-earth material supply chain volatility: Dependence on specific rare-earth elements (e.g., Neodymium, Dysprosium) leads to price fluctuations and geopolitical risks. The estimated dependence on a few mining regions represents approximately 65% of global rare-earth supply.
- High manufacturing costs: The production of high-performance permanent magnets is capital-intensive and requires specialized expertise.
- Recycling and sustainability of magnets: Developing efficient and cost-effective methods for recycling rare-earth magnets is a significant challenge.
- Competition from alternative technologies: While currently dominant, advancements in other motor technologies could pose a future challenge.
- Trade tensions and tariffs: Geopolitical factors and trade policies can impact the cost and availability of raw materials and finished products.
Emerging Opportunities in EV Permanent Magnet
Emerging opportunities in the EV Permanent Magnet sector lie in the development of high-performance, rare-earth-free or low-rare-earth permanent magnets to mitigate supply chain risks and reduce costs. The increasing demand for electric two-wheelers and specialized industrial EVs presents untapped markets. Furthermore, the integration of advanced magnetic materials in hybrid electric vehicles (HEVs) and plug-in hybrid electric vehicles (PHEVs) offers substantial growth potential. Innovations in magnet design for optimized thermal management and improved energy harvesting systems within EVs also represent significant avenues for expansion. The growing emphasis on circular economy principles is fostering opportunities in advanced magnet recycling and remanufacturing.
Growth Accelerators in the EV Permanent Magnet Industry
The EV Permanent Magnet industry is experiencing significant growth acceleration driven by several key catalysts. Continuous technological breakthroughs in material science are leading to the development of magnets with higher energy density and superior performance characteristics, enabling smaller, lighter, and more efficient EV motors. Strategic partnerships between magnet manufacturers, automotive OEMs, and battery suppliers are crucial for co-developing integrated powertrain solutions and securing long-term supply agreements. Market expansion strategies, including investments in new manufacturing facilities in emerging EV markets and the diversification of supply chains, are further fueling growth. The increasing electrification of commercial vehicle fleets, including buses and trucks, presents a substantial expansion opportunity.
Key Players Shaping the EV Permanent Magnet Market
- Proterial
- Adams Magnetic Products Co.
- Shin-Etsu Chemical Co. LTD.
- Arnold Magnetic Technologies
- TDK Corporation
- Newland Magnetics
- Vacuumschmelze GmbH & Co. KG
- Electron Energy Corporation.
- Daido Steel Co.,Ltd
- MP Materials
- Tengam Engineering,Inc.
- Viona Magnetics
- Yantai Zhenghai Magnetic Material CO. LTD.
- Hangzhou Permanent Magnet Group.,Ltd.
- Yantai Dongxing Magnetic Materials Inc
- Beijing Zhong Ke San Huan Hi-Tech Co.,Ltd.
Notable Milestones in EV Permanent Magnet Sector
- 2019: Increased global investment in rare-earth magnet production capacity, driven by rising EV demand.
- 2020: Significant product launches featuring higher-coercivity NdFeB magnets for enhanced motor efficiency.
- 2021: Expansion of recycling initiatives for rare-earth magnets, aiming to reduce reliance on virgin materials.
- 2022: Strategic acquisitions by major players to secure raw material sourcing and technological expertise.
- 2023: Advancements in research and development of low-rare-earth and rare-earth-free magnet technologies.
- 2024: Growing emphasis on sustainable sourcing and ethical mining practices within the rare-earth supply chain.
In-Depth EV Permanent Magnet Market Outlook
The future outlook for the EV Permanent Magnet market is exceptionally promising, driven by an unwavering global commitment to decarbonization and the accelerated transition to electric mobility. Growth accelerators, including groundbreaking material science innovations, strategic collaborations across the value chain, and the aggressive electrification of commercial vehicle segments, will continue to propel market expansion. The ongoing development of robust recycling infrastructure and the exploration of alternative magnet compositions will further solidify the industry's sustainability and resilience. The market is on a trajectory to achieve substantial growth, presenting significant strategic opportunities for companies that can navigate supply chain complexities, embrace technological advancements, and meet the evolving demands of the electric vehicle revolution.
EV Permanent Magnet Segmentation
-
1. Application
- 1.1. Commercial Vehicles
- 1.2. Passenger Vehicles
-
2. Types
- 2.1. NdFeB
- 2.2. SmCo
- 2.3. Others
EV Permanent Magnet Segmentation By Geography
-
1. North America
- 1.1. United States
- 1.2. Canada
- 1.3. Mexico
-
2. South America
- 2.1. Brazil
- 2.2. Argentina
- 2.3. Rest of South America
-
3. Europe
- 3.1. United Kingdom
- 3.2. Germany
- 3.3. France
- 3.4. Italy
- 3.5. Spain
- 3.6. Russia
- 3.7. Benelux
- 3.8. Nordics
- 3.9. Rest of Europe
-
4. Middle East & Africa
- 4.1. Turkey
- 4.2. Israel
- 4.3. GCC
- 4.4. North Africa
- 4.5. South Africa
- 4.6. Rest of Middle East & Africa
-
5. Asia Pacific
- 5.1. China
- 5.2. India
- 5.3. Japan
- 5.4. South Korea
- 5.5. ASEAN
- 5.6. Oceania
- 5.7. Rest of Asia Pacific
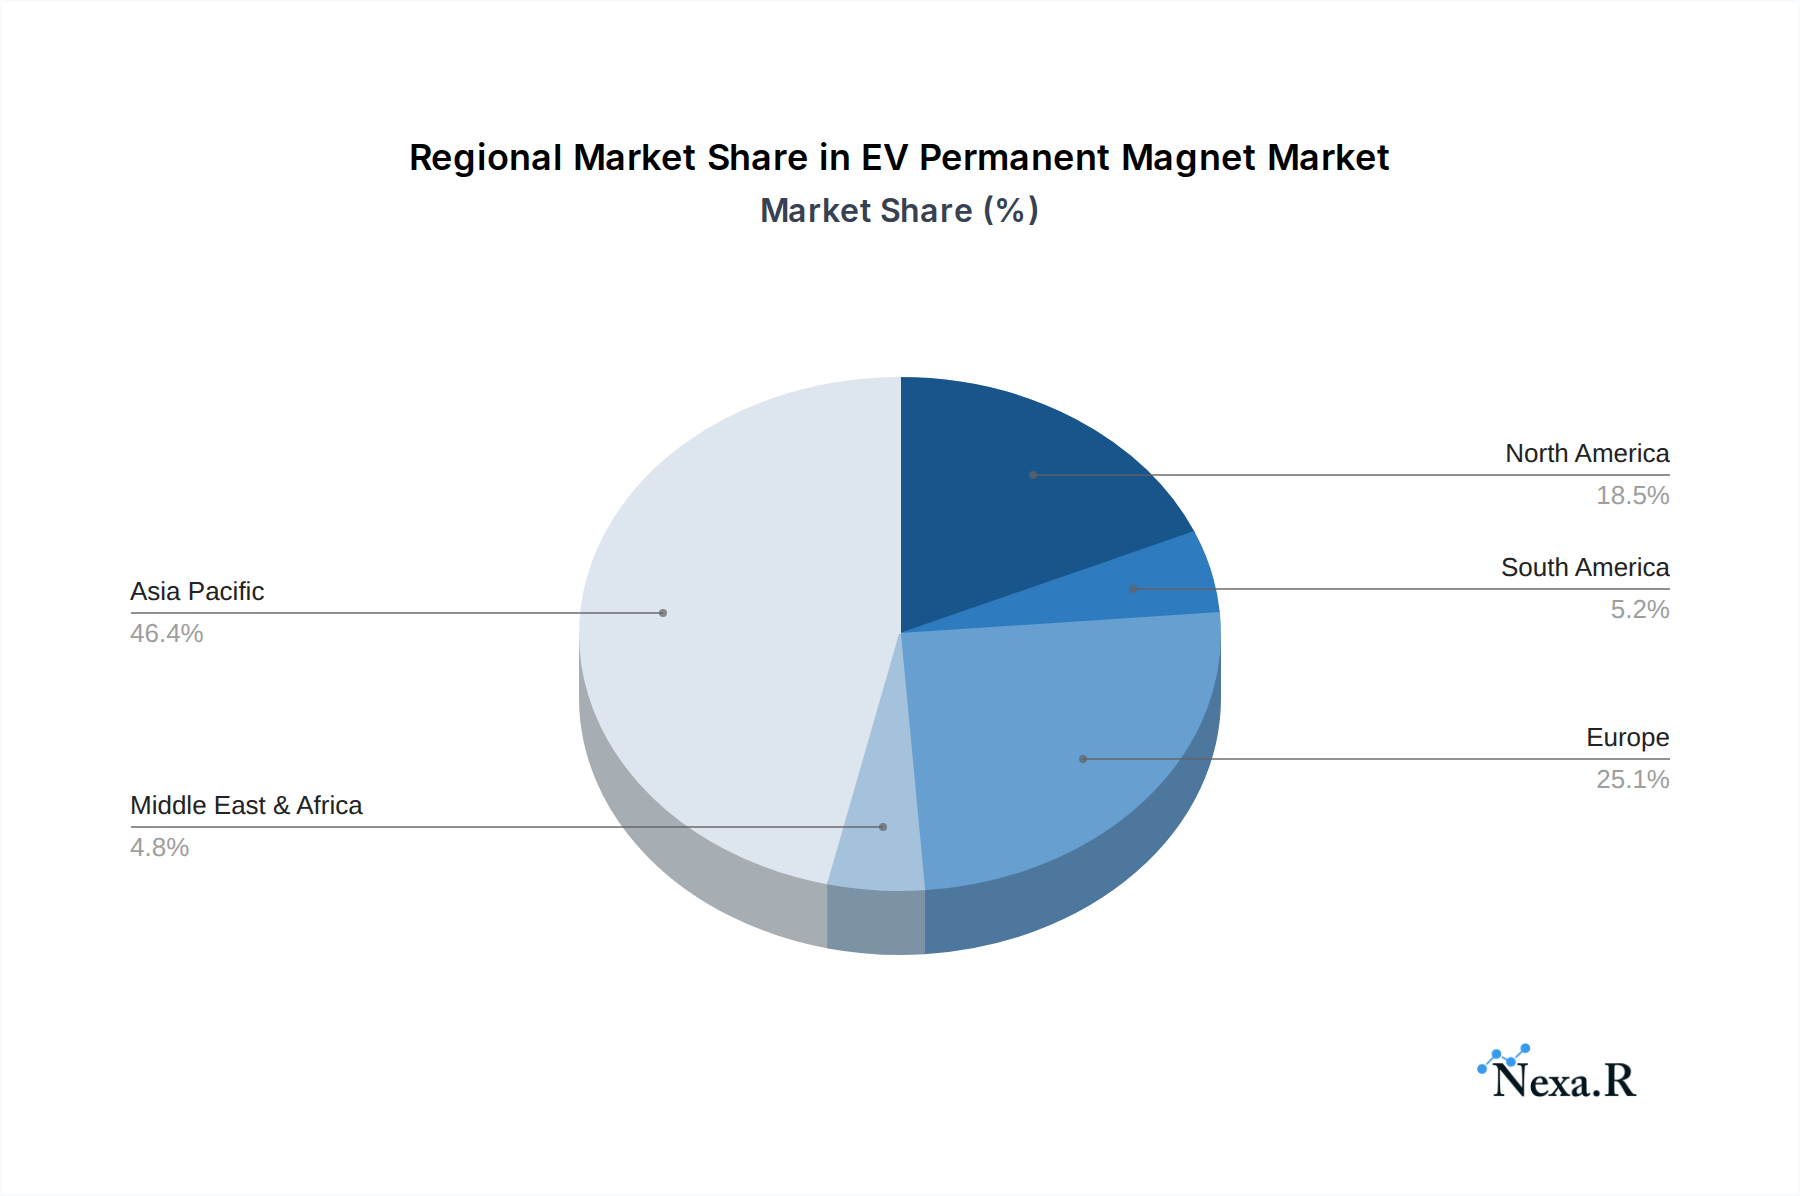
EV Permanent Magnet Regional Market Share
Geographic Coverage of EV Permanent Magnet
EV Permanent Magnet REPORT HIGHLIGHTS
| Aspects | Details |
|---|---|
| Study Period | 2020-2034 |
| Base Year | 2025 |
| Estimated Year | 2026 |
| Forecast Period | 2026-2034 |
| Historical Period | 2020-2025 |
| Growth Rate | CAGR of 9.21% from 2020-2034 |
| Segmentation |
|
Table of Contents
- 1. Introduction
- 1.1. Research Scope
- 1.2. Market Segmentation
- 1.3. Research Methodology
- 1.4. Definitions and Assumptions
- 2. Executive Summary
- 2.1. Introduction
- 3. Market Dynamics
- 3.1. Introduction
- 3.2. Market Drivers
- 3.3. Market Restrains
- 3.4. Market Trends
- 4. Market Factor Analysis
- 4.1. Porters Five Forces
- 4.2. Supply/Value Chain
- 4.3. PESTEL analysis
- 4.4. Market Entropy
- 4.5. Patent/Trademark Analysis
- 5. Global EV Permanent Magnet Analysis, Insights and Forecast, 2020-2032
- 5.1. Market Analysis, Insights and Forecast - by Application
- 5.1.1. Commercial Vehicles
- 5.1.2. Passenger Vehicles
- 5.2. Market Analysis, Insights and Forecast - by Types
- 5.2.1. NdFeB
- 5.2.2. SmCo
- 5.2.3. Others
- 5.3. Market Analysis, Insights and Forecast - by Region
- 5.3.1. North America
- 5.3.2. South America
- 5.3.3. Europe
- 5.3.4. Middle East & Africa
- 5.3.5. Asia Pacific
- 5.1. Market Analysis, Insights and Forecast - by Application
- 6. North America EV Permanent Magnet Analysis, Insights and Forecast, 2020-2032
- 6.1. Market Analysis, Insights and Forecast - by Application
- 6.1.1. Commercial Vehicles
- 6.1.2. Passenger Vehicles
- 6.2. Market Analysis, Insights and Forecast - by Types
- 6.2.1. NdFeB
- 6.2.2. SmCo
- 6.2.3. Others
- 6.1. Market Analysis, Insights and Forecast - by Application
- 7. South America EV Permanent Magnet Analysis, Insights and Forecast, 2020-2032
- 7.1. Market Analysis, Insights and Forecast - by Application
- 7.1.1. Commercial Vehicles
- 7.1.2. Passenger Vehicles
- 7.2. Market Analysis, Insights and Forecast - by Types
- 7.2.1. NdFeB
- 7.2.2. SmCo
- 7.2.3. Others
- 7.1. Market Analysis, Insights and Forecast - by Application
- 8. Europe EV Permanent Magnet Analysis, Insights and Forecast, 2020-2032
- 8.1. Market Analysis, Insights and Forecast - by Application
- 8.1.1. Commercial Vehicles
- 8.1.2. Passenger Vehicles
- 8.2. Market Analysis, Insights and Forecast - by Types
- 8.2.1. NdFeB
- 8.2.2. SmCo
- 8.2.3. Others
- 8.1. Market Analysis, Insights and Forecast - by Application
- 9. Middle East & Africa EV Permanent Magnet Analysis, Insights and Forecast, 2020-2032
- 9.1. Market Analysis, Insights and Forecast - by Application
- 9.1.1. Commercial Vehicles
- 9.1.2. Passenger Vehicles
- 9.2. Market Analysis, Insights and Forecast - by Types
- 9.2.1. NdFeB
- 9.2.2. SmCo
- 9.2.3. Others
- 9.1. Market Analysis, Insights and Forecast - by Application
- 10. Asia Pacific EV Permanent Magnet Analysis, Insights and Forecast, 2020-2032
- 10.1. Market Analysis, Insights and Forecast - by Application
- 10.1.1. Commercial Vehicles
- 10.1.2. Passenger Vehicles
- 10.2. Market Analysis, Insights and Forecast - by Types
- 10.2.1. NdFeB
- 10.2.2. SmCo
- 10.2.3. Others
- 10.1. Market Analysis, Insights and Forecast - by Application
- 11. Competitive Analysis
- 11.1. Global Market Share Analysis 2025
- 11.2. Company Profiles
- 11.2.1 Proterial
- 11.2.1.1. Overview
- 11.2.1.2. Products
- 11.2.1.3. SWOT Analysis
- 11.2.1.4. Recent Developments
- 11.2.1.5. Financials (Based on Availability)
- 11.2.2 Adams Magnetic Products Co.
- 11.2.2.1. Overview
- 11.2.2.2. Products
- 11.2.2.3. SWOT Analysis
- 11.2.2.4. Recent Developments
- 11.2.2.5. Financials (Based on Availability)
- 11.2.3 Shin-Etsu Chemical Co. LTD.
- 11.2.3.1. Overview
- 11.2.3.2. Products
- 11.2.3.3. SWOT Analysis
- 11.2.3.4. Recent Developments
- 11.2.3.5. Financials (Based on Availability)
- 11.2.4 Arnold Magnetic Technologies
- 11.2.4.1. Overview
- 11.2.4.2. Products
- 11.2.4.3. SWOT Analysis
- 11.2.4.4. Recent Developments
- 11.2.4.5. Financials (Based on Availability)
- 11.2.5 TDK Corporation
- 11.2.5.1. Overview
- 11.2.5.2. Products
- 11.2.5.3. SWOT Analysis
- 11.2.5.4. Recent Developments
- 11.2.5.5. Financials (Based on Availability)
- 11.2.6 Newland Magnetics
- 11.2.6.1. Overview
- 11.2.6.2. Products
- 11.2.6.3. SWOT Analysis
- 11.2.6.4. Recent Developments
- 11.2.6.5. Financials (Based on Availability)
- 11.2.7 Vacuumschmelze GmbH & Co. KG
- 11.2.7.1. Overview
- 11.2.7.2. Products
- 11.2.7.3. SWOT Analysis
- 11.2.7.4. Recent Developments
- 11.2.7.5. Financials (Based on Availability)
- 11.2.8 Electron Energy Corporation.
- 11.2.8.1. Overview
- 11.2.8.2. Products
- 11.2.8.3. SWOT Analysis
- 11.2.8.4. Recent Developments
- 11.2.8.5. Financials (Based on Availability)
- 11.2.9 Daido Steel Co.
- 11.2.9.1. Overview
- 11.2.9.2. Products
- 11.2.9.3. SWOT Analysis
- 11.2.9.4. Recent Developments
- 11.2.9.5. Financials (Based on Availability)
- 11.2.10 Ltd
- 11.2.10.1. Overview
- 11.2.10.2. Products
- 11.2.10.3. SWOT Analysis
- 11.2.10.4. Recent Developments
- 11.2.10.5. Financials (Based on Availability)
- 11.2.11 MP Materials
- 11.2.11.1. Overview
- 11.2.11.2. Products
- 11.2.11.3. SWOT Analysis
- 11.2.11.4. Recent Developments
- 11.2.11.5. Financials (Based on Availability)
- 11.2.12 Tengam Engineering
- 11.2.12.1. Overview
- 11.2.12.2. Products
- 11.2.12.3. SWOT Analysis
- 11.2.12.4. Recent Developments
- 11.2.12.5. Financials (Based on Availability)
- 11.2.13 Inc.
- 11.2.13.1. Overview
- 11.2.13.2. Products
- 11.2.13.3. SWOT Analysis
- 11.2.13.4. Recent Developments
- 11.2.13.5. Financials (Based on Availability)
- 11.2.14 Viona Magnetics
- 11.2.14.1. Overview
- 11.2.14.2. Products
- 11.2.14.3. SWOT Analysis
- 11.2.14.4. Recent Developments
- 11.2.14.5. Financials (Based on Availability)
- 11.2.15 Yantai Zhenghai Magnetic Material CO. LTD.
- 11.2.15.1. Overview
- 11.2.15.2. Products
- 11.2.15.3. SWOT Analysis
- 11.2.15.4. Recent Developments
- 11.2.15.5. Financials (Based on Availability)
- 11.2.16 Hangzhou Permanent Magnet Group.
- 11.2.16.1. Overview
- 11.2.16.2. Products
- 11.2.16.3. SWOT Analysis
- 11.2.16.4. Recent Developments
- 11.2.16.5. Financials (Based on Availability)
- 11.2.17 Ltd.
- 11.2.17.1. Overview
- 11.2.17.2. Products
- 11.2.17.3. SWOT Analysis
- 11.2.17.4. Recent Developments
- 11.2.17.5. Financials (Based on Availability)
- 11.2.18 Yantai Dongxing Magnetic Materials Inc
- 11.2.18.1. Overview
- 11.2.18.2. Products
- 11.2.18.3. SWOT Analysis
- 11.2.18.4. Recent Developments
- 11.2.18.5. Financials (Based on Availability)
- 11.2.19 Beijing Zhong Ke San Huan Hi-Tech Co.
- 11.2.19.1. Overview
- 11.2.19.2. Products
- 11.2.19.3. SWOT Analysis
- 11.2.19.4. Recent Developments
- 11.2.19.5. Financials (Based on Availability)
- 11.2.20 Ltd.
- 11.2.20.1. Overview
- 11.2.20.2. Products
- 11.2.20.3. SWOT Analysis
- 11.2.20.4. Recent Developments
- 11.2.20.5. Financials (Based on Availability)
- 11.2.1 Proterial
List of Figures
- Figure 1: Global EV Permanent Magnet Revenue Breakdown (billion, %) by Region 2025 & 2033
- Figure 2: North America EV Permanent Magnet Revenue (billion), by Application 2025 & 2033
- Figure 3: North America EV Permanent Magnet Revenue Share (%), by Application 2025 & 2033
- Figure 4: North America EV Permanent Magnet Revenue (billion), by Types 2025 & 2033
- Figure 5: North America EV Permanent Magnet Revenue Share (%), by Types 2025 & 2033
- Figure 6: North America EV Permanent Magnet Revenue (billion), by Country 2025 & 2033
- Figure 7: North America EV Permanent Magnet Revenue Share (%), by Country 2025 & 2033
- Figure 8: South America EV Permanent Magnet Revenue (billion), by Application 2025 & 2033
- Figure 9: South America EV Permanent Magnet Revenue Share (%), by Application 2025 & 2033
- Figure 10: South America EV Permanent Magnet Revenue (billion), by Types 2025 & 2033
- Figure 11: South America EV Permanent Magnet Revenue Share (%), by Types 2025 & 2033
- Figure 12: South America EV Permanent Magnet Revenue (billion), by Country 2025 & 2033
- Figure 13: South America EV Permanent Magnet Revenue Share (%), by Country 2025 & 2033
- Figure 14: Europe EV Permanent Magnet Revenue (billion), by Application 2025 & 2033
- Figure 15: Europe EV Permanent Magnet Revenue Share (%), by Application 2025 & 2033
- Figure 16: Europe EV Permanent Magnet Revenue (billion), by Types 2025 & 2033
- Figure 17: Europe EV Permanent Magnet Revenue Share (%), by Types 2025 & 2033
- Figure 18: Europe EV Permanent Magnet Revenue (billion), by Country 2025 & 2033
- Figure 19: Europe EV Permanent Magnet Revenue Share (%), by Country 2025 & 2033
- Figure 20: Middle East & Africa EV Permanent Magnet Revenue (billion), by Application 2025 & 2033
- Figure 21: Middle East & Africa EV Permanent Magnet Revenue Share (%), by Application 2025 & 2033
- Figure 22: Middle East & Africa EV Permanent Magnet Revenue (billion), by Types 2025 & 2033
- Figure 23: Middle East & Africa EV Permanent Magnet Revenue Share (%), by Types 2025 & 2033
- Figure 24: Middle East & Africa EV Permanent Magnet Revenue (billion), by Country 2025 & 2033
- Figure 25: Middle East & Africa EV Permanent Magnet Revenue Share (%), by Country 2025 & 2033
- Figure 26: Asia Pacific EV Permanent Magnet Revenue (billion), by Application 2025 & 2033
- Figure 27: Asia Pacific EV Permanent Magnet Revenue Share (%), by Application 2025 & 2033
- Figure 28: Asia Pacific EV Permanent Magnet Revenue (billion), by Types 2025 & 2033
- Figure 29: Asia Pacific EV Permanent Magnet Revenue Share (%), by Types 2025 & 2033
- Figure 30: Asia Pacific EV Permanent Magnet Revenue (billion), by Country 2025 & 2033
- Figure 31: Asia Pacific EV Permanent Magnet Revenue Share (%), by Country 2025 & 2033
List of Tables
- Table 1: Global EV Permanent Magnet Revenue billion Forecast, by Application 2020 & 2033
- Table 2: Global EV Permanent Magnet Revenue billion Forecast, by Types 2020 & 2033
- Table 3: Global EV Permanent Magnet Revenue billion Forecast, by Region 2020 & 2033
- Table 4: Global EV Permanent Magnet Revenue billion Forecast, by Application 2020 & 2033
- Table 5: Global EV Permanent Magnet Revenue billion Forecast, by Types 2020 & 2033
- Table 6: Global EV Permanent Magnet Revenue billion Forecast, by Country 2020 & 2033
- Table 7: United States EV Permanent Magnet Revenue (billion) Forecast, by Application 2020 & 2033
- Table 8: Canada EV Permanent Magnet Revenue (billion) Forecast, by Application 2020 & 2033
- Table 9: Mexico EV Permanent Magnet Revenue (billion) Forecast, by Application 2020 & 2033
- Table 10: Global EV Permanent Magnet Revenue billion Forecast, by Application 2020 & 2033
- Table 11: Global EV Permanent Magnet Revenue billion Forecast, by Types 2020 & 2033
- Table 12: Global EV Permanent Magnet Revenue billion Forecast, by Country 2020 & 2033
- Table 13: Brazil EV Permanent Magnet Revenue (billion) Forecast, by Application 2020 & 2033
- Table 14: Argentina EV Permanent Magnet Revenue (billion) Forecast, by Application 2020 & 2033
- Table 15: Rest of South America EV Permanent Magnet Revenue (billion) Forecast, by Application 2020 & 2033
- Table 16: Global EV Permanent Magnet Revenue billion Forecast, by Application 2020 & 2033
- Table 17: Global EV Permanent Magnet Revenue billion Forecast, by Types 2020 & 2033
- Table 18: Global EV Permanent Magnet Revenue billion Forecast, by Country 2020 & 2033
- Table 19: United Kingdom EV Permanent Magnet Revenue (billion) Forecast, by Application 2020 & 2033
- Table 20: Germany EV Permanent Magnet Revenue (billion) Forecast, by Application 2020 & 2033
- Table 21: France EV Permanent Magnet Revenue (billion) Forecast, by Application 2020 & 2033
- Table 22: Italy EV Permanent Magnet Revenue (billion) Forecast, by Application 2020 & 2033
- Table 23: Spain EV Permanent Magnet Revenue (billion) Forecast, by Application 2020 & 2033
- Table 24: Russia EV Permanent Magnet Revenue (billion) Forecast, by Application 2020 & 2033
- Table 25: Benelux EV Permanent Magnet Revenue (billion) Forecast, by Application 2020 & 2033
- Table 26: Nordics EV Permanent Magnet Revenue (billion) Forecast, by Application 2020 & 2033
- Table 27: Rest of Europe EV Permanent Magnet Revenue (billion) Forecast, by Application 2020 & 2033
- Table 28: Global EV Permanent Magnet Revenue billion Forecast, by Application 2020 & 2033
- Table 29: Global EV Permanent Magnet Revenue billion Forecast, by Types 2020 & 2033
- Table 30: Global EV Permanent Magnet Revenue billion Forecast, by Country 2020 & 2033
- Table 31: Turkey EV Permanent Magnet Revenue (billion) Forecast, by Application 2020 & 2033
- Table 32: Israel EV Permanent Magnet Revenue (billion) Forecast, by Application 2020 & 2033
- Table 33: GCC EV Permanent Magnet Revenue (billion) Forecast, by Application 2020 & 2033
- Table 34: North Africa EV Permanent Magnet Revenue (billion) Forecast, by Application 2020 & 2033
- Table 35: South Africa EV Permanent Magnet Revenue (billion) Forecast, by Application 2020 & 2033
- Table 36: Rest of Middle East & Africa EV Permanent Magnet Revenue (billion) Forecast, by Application 2020 & 2033
- Table 37: Global EV Permanent Magnet Revenue billion Forecast, by Application 2020 & 2033
- Table 38: Global EV Permanent Magnet Revenue billion Forecast, by Types 2020 & 2033
- Table 39: Global EV Permanent Magnet Revenue billion Forecast, by Country 2020 & 2033
- Table 40: China EV Permanent Magnet Revenue (billion) Forecast, by Application 2020 & 2033
- Table 41: India EV Permanent Magnet Revenue (billion) Forecast, by Application 2020 & 2033
- Table 42: Japan EV Permanent Magnet Revenue (billion) Forecast, by Application 2020 & 2033
- Table 43: South Korea EV Permanent Magnet Revenue (billion) Forecast, by Application 2020 & 2033
- Table 44: ASEAN EV Permanent Magnet Revenue (billion) Forecast, by Application 2020 & 2033
- Table 45: Oceania EV Permanent Magnet Revenue (billion) Forecast, by Application 2020 & 2033
- Table 46: Rest of Asia Pacific EV Permanent Magnet Revenue (billion) Forecast, by Application 2020 & 2033
Frequently Asked Questions
1. What is the projected Compound Annual Growth Rate (CAGR) of the EV Permanent Magnet?
The projected CAGR is approximately 9.21%.
2. Which companies are prominent players in the EV Permanent Magnet?
Key companies in the market include Proterial, Adams Magnetic Products Co., Shin-Etsu Chemical Co. LTD., Arnold Magnetic Technologies, TDK Corporation, Newland Magnetics, Vacuumschmelze GmbH & Co. KG, Electron Energy Corporation., Daido Steel Co., Ltd, MP Materials, Tengam Engineering, Inc., Viona Magnetics, Yantai Zhenghai Magnetic Material CO. LTD., Hangzhou Permanent Magnet Group., Ltd., Yantai Dongxing Magnetic Materials Inc, Beijing Zhong Ke San Huan Hi-Tech Co., Ltd..
3. What are the main segments of the EV Permanent Magnet?
The market segments include Application, Types.
4. Can you provide details about the market size?
The market size is estimated to be USD 13.4 billion as of 2022.
5. What are some drivers contributing to market growth?
N/A
6. What are the notable trends driving market growth?
N/A
7. Are there any restraints impacting market growth?
N/A
8. Can you provide examples of recent developments in the market?
N/A
9. What pricing options are available for accessing the report?
Pricing options include single-user, multi-user, and enterprise licenses priced at USD 4900.00, USD 7350.00, and USD 9800.00 respectively.
10. Is the market size provided in terms of value or volume?
The market size is provided in terms of value, measured in billion.
11. Are there any specific market keywords associated with the report?
Yes, the market keyword associated with the report is "EV Permanent Magnet," which aids in identifying and referencing the specific market segment covered.
12. How do I determine which pricing option suits my needs best?
The pricing options vary based on user requirements and access needs. Individual users may opt for single-user licenses, while businesses requiring broader access may choose multi-user or enterprise licenses for cost-effective access to the report.
13. Are there any additional resources or data provided in the EV Permanent Magnet report?
While the report offers comprehensive insights, it's advisable to review the specific contents or supplementary materials provided to ascertain if additional resources or data are available.
14. How can I stay updated on further developments or reports in the EV Permanent Magnet?
To stay informed about further developments, trends, and reports in the EV Permanent Magnet, consider subscribing to industry newsletters, following relevant companies and organizations, or regularly checking reputable industry news sources and publications.
Methodology
Step 1 - Identification of Relevant Samples Size from Population Database


Step 2 - Approaches for Defining Global Market Size (Value, Volume* & Price*)

Note*: In applicable scenarios
Step 3 - Data Sources
Primary Research
- Web Analytics
- Survey Reports
- Research Institute
- Latest Research Reports
- Opinion Leaders
Secondary Research
- Annual Reports
- White Paper
- Latest Press Release
- Industry Association
- Paid Database
- Investor Presentations

Step 4 - Data Triangulation
Involves using different sources of information in order to increase the validity of a study
These sources are likely to be stakeholders in a program - participants, other researchers, program staff, other community members, and so on.
Then we put all data in single framework & apply various statistical tools to find out the dynamic on the market.
During the analysis stage, feedback from the stakeholder groups would be compared to determine areas of agreement as well as areas of divergence