

Key Insights
The global excipients market is poised for substantial growth, driven by increasing pharmaceutical R&D investments, a rising prevalence of chronic diseases, and the continuous development of novel drug delivery systems. Valued at an estimated $15.05 billion in 2025, the market is projected to expand at a robust Compound Annual Growth Rate (CAGR) of 7.56% through 2033. This upward trajectory is primarily fueled by the escalating demand for high-quality, functional excipients that enhance drug efficacy, bioavailability, and patient compliance. Key drivers include the growing preference for oral formulations due to their convenience and cost-effectiveness, alongside advancements in topical and parenteral formulations for targeted drug delivery. The organic excipients segment, in particular, is witnessing significant traction owing to its biocompatibility and reduced toxicity profiles, aligning with stricter regulatory demands and a growing consumer preference for natural ingredients in pharmaceutical products.

Excipients Market Size (In Billion)
The market's expansion is further supported by technological innovations in excipient manufacturing and formulation techniques, enabling the creation of sophisticated drug delivery platforms. Major players are actively engaged in strategic collaborations and acquisitions to broaden their product portfolios and expand their geographical reach. Despite the positive outlook, challenges such as stringent regulatory approvals for novel excipients and the fluctuating costs of raw materials present some restraints. However, the increasing outsourcing of pharmaceutical manufacturing and the burgeoning generics market are expected to offset these concerns. The Asia Pacific region is anticipated to emerge as a significant growth engine, propelled by its expanding healthcare infrastructure, a large patient pool, and the presence of a robust pharmaceutical manufacturing base.

Excipients Company Market Share
Excipients Market Report: Navigating Growth, Innovation, and Regional Dominance (2019–2033)
This comprehensive report offers an in-depth analysis of the global Excipients market, meticulously examining its dynamics, growth trajectories, and competitive landscape from 2019 to 2033. We delve into market segmentation by application and type, identify dominant regional forces, and spotlight key industry players and their strategic moves. With a base year of 2025 and a forecast period extending to 2033, this report provides actionable intelligence for stakeholders seeking to capitalize on the evolving pharmaceutical and healthcare sectors. The global excipients market is projected to reach USD 72.8 billion in 2025, with substantial growth anticipated.
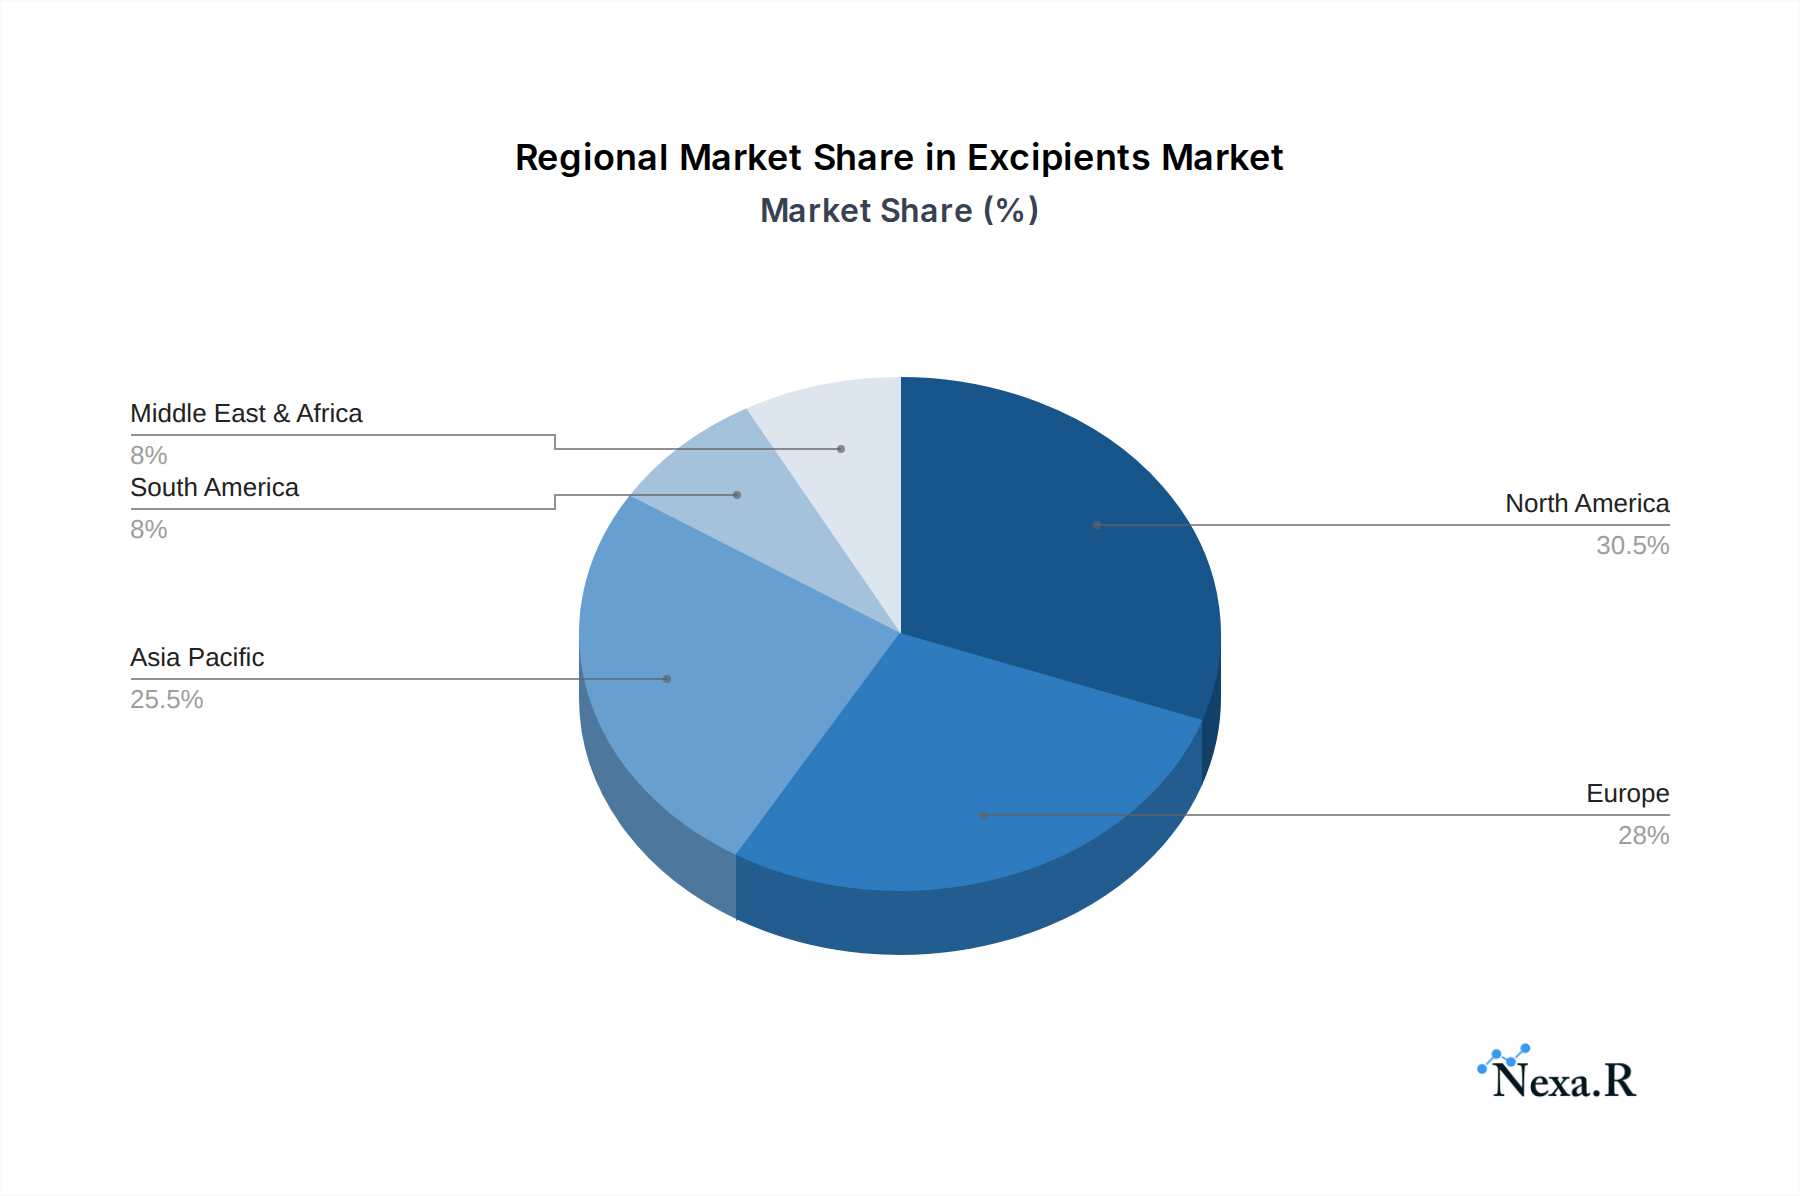
Excipients Regional Market Share
Excipients Market Dynamics & Structure
The global excipients market exhibits a moderately consolidated structure, with a blend of large multinational corporations and specialized regional players. Leading companies like DuPont, Roquette, Ashland, BASF, and Evonik hold significant market shares, driven by extensive R&D capabilities and broad product portfolios. Technological innovation is a primary growth driver, with continuous advancements in novel excipient development to enhance drug delivery, stability, and patient compliance. The report will analyze the impact of patent cliffs on generic drug development and the subsequent demand for high-performance excipients. Regulatory frameworks, including stringent guidelines from agencies like the FDA and EMA, play a crucial role in market entry and product approval, fostering a demand for high-quality, compliant excipients. Competitive product substitutes, primarily from emerging economies and niche manufacturers, present a challenge, but the emphasis on quality and efficacy in regulated markets maintains the dominance of established players. End-user demographics, particularly the aging global population and the rise in chronic diseases, are increasing the demand for pharmaceutical formulations, thereby boosting the excipients market. Mergers and acquisitions (M&A) are strategic tools for market consolidation and expansion, with several high-value deals expected in the forecast period, further shaping the competitive landscape. For instance, the acquisition of specialized excipient manufacturers by larger pharmaceutical ingredient providers is a recurring trend.
- Market Concentration: Moderately consolidated, dominated by key global players.
- Technological Innovation: Driven by novel excipient development for advanced drug delivery systems.
- Regulatory Frameworks: Strict adherence to FDA and EMA guidelines is paramount.
- Competitive Product Substitutes: Emerging economies and niche players offer alternatives, but quality remains a differentiator.
- End-User Demographics: Aging population and chronic disease prevalence fuel demand.
- M&A Trends: Strategic acquisitions for market consolidation and portfolio expansion.
Excipients Growth Trends & Insights
The global excipients market is poised for robust growth, driven by an increasing global pharmaceutical production volume, a growing pipeline of complex biologics, and the continuous pursuit of enhanced drug delivery systems. The market size is projected to witness a significant upward trajectory, expanding from an estimated USD 72.8 billion in the base year of 2025 to reach over USD 105.5 billion by 2033. This represents a Compound Annual Growth Rate (CAGR) of approximately 4.8% during the forecast period. The adoption rates of advanced excipients are accelerating, particularly those enabling targeted drug delivery, improved bioavailability, and patient convenience such as orally disintegrating tablets and long-acting injectables. Technological disruptions, including the integration of nanotechnology in drug formulation and the development of biodegradable and biocompatible excipients, are reshaping product offerings and market demands. Consumer behavior shifts, such as a preference for less invasive drug administration routes and personalized medicine, are creating opportunities for innovative excipient solutions. The report will detail the impact of emerging drug modalities like mRNA vaccines, which require specialized lipid-based excipients, on market expansion. Furthermore, the increasing prevalence of self-medication for minor ailments is boosting the demand for over-the-counter (OTC) formulations, a significant segment for excipients. The rising disposable incomes in emerging economies, coupled with improving healthcare infrastructure, are also contributing to higher market penetration of pharmaceutical products and, consequently, excipients. The increasing focus on pediatric and geriatric drug formulations, which often require specific excipient properties for palatability and ease of administration, will also be a key growth determinant. The report will provide granular insights into the market penetration of key excipient types and their respective growth rates.
Dominant Regions, Countries, or Segments in Excipients
North America, led by the United States, is a dominant force in the global excipients market, driven by its robust pharmaceutical industry, high healthcare expenditure, and significant investment in research and development. The region's advanced regulatory infrastructure and a strong focus on innovation in drug delivery systems contribute to a substantial demand for high-quality excipients. The United States alone accounts for a significant portion of the global market share. Key drivers for this dominance include the presence of major pharmaceutical companies, a well-established network of contract manufacturing organizations (CMOs), and a high prevalence of chronic diseases necessitating advanced pharmaceutical formulations.
The Oral Formulations segment is the largest and most significant application driving market growth. This dominance is attributed to the widespread use of oral dosage forms for a vast array of therapeutic treatments due to their convenience, patient compliance, and cost-effectiveness. The increasing global demand for solid oral dosage forms like tablets and capsules, as well as the growing popularity of specialized oral formulations such as orally disintegrating tablets (ODTs) and modified-release dosage forms, directly fuels the demand for a wide range of organic and inorganic excipients.
- North America's Dominance: Fueled by R&D, high healthcare spending, and advanced regulatory standards.
- United States' Leading Role: Significant market share driven by a mature pharmaceutical ecosystem.
- Oral Formulations Segment: The largest application due to convenience and widespread use.
- Key Drivers for Oral Formulations:
- High prevalence of chronic diseases requiring oral medication.
- Growth in generic and branded oral drug production.
- Advancements in modified-release and ODT technologies.
- Increasing demand for patient-friendly dosage forms.
- Cost-effectiveness of oral drug delivery.
Excipients Product Landscape
The excipients product landscape is characterized by continuous innovation aimed at enhancing drug performance and patient experience. Key product innovations include advanced polymers for controlled-release formulations, lipid-based excipients for improved solubility and bioavailability of poorly water-soluble drugs, and specialized binders and disintegrants designed for challenging active pharmaceutical ingredients (APIs). Performance metrics such as particle size, flowability, compressibility, and dissolution profiles are critical differentiators. Unique selling propositions often lie in excipients that offer improved stability, reduced batch-to-batch variability, and enhanced compatibility with sensitive APIs. Technological advancements are focusing on biodegradable and bio-based excipients to meet sustainability demands and the development of functional excipients that contribute directly to therapeutic outcomes.
Key Drivers, Barriers & Challenges in Excipients
Key Drivers: The excipients market is propelled by the relentless growth of the pharmaceutical industry, driven by an aging global population, increasing prevalence of chronic diseases, and expanding healthcare access in emerging economies. Technological advancements in drug delivery systems, such as nanotechnology and controlled-release formulations, create a sustained demand for novel and high-performance excipients. Government initiatives supporting pharmaceutical R&D and manufacturing further stimulate market growth. The rising demand for generic drugs and biosimilars also necessitates a diverse range of cost-effective and high-quality excipients.
Key Barriers & Challenges: Supply chain disruptions, exacerbated by geopolitical instability and the COVID-19 pandemic, pose significant challenges to the availability and cost of excipients. Stringent regulatory approval processes for new excipients and the need for extensive testing can lead to prolonged market entry timelines. Intense competition among numerous manufacturers, including those from lower-cost regions, can lead to price pressures and affect profit margins. The development and validation of novel excipients, requiring substantial R&D investment and clinical trials, represent a considerable financial and time barrier. Furthermore, the increasing scrutiny on the environmental impact of pharmaceutical manufacturing drives a demand for sustainable excipient solutions, which can present development and adoption challenges.
Emerging Opportunities in Excipients
Emerging opportunities in the excipients market are largely centered around the burgeoning fields of personalized medicine and advanced biologics. The development of novel excipients tailored for gene and cell therapies, mRNA vaccines, and other cutting-edge therapeutic modalities presents a significant growth avenue. Untapped markets in developing regions, where access to advanced healthcare solutions is rapidly improving, offer substantial potential for market penetration. Evolving consumer preferences for patient-friendly and minimally invasive drug delivery methods are creating demand for excipients that enable the development of orally disintegrating tablets, transdermal patches, and inhalable formulations. The increasing focus on sustainable and bio-based excipients also presents an opportunity for companies investing in green chemistry and biodegradable materials.
Growth Accelerators in the Excipients Industry
Long-term growth in the excipients industry is significantly accelerated by breakthroughs in drug delivery technologies, such as nanocarriers and stimuli-responsive polymers, which enhance API efficacy and reduce side effects. Strategic partnerships between excipient manufacturers and pharmaceutical companies are crucial for co-developing customized solutions and ensuring market adoption of innovative products. Market expansion strategies, including penetration into emerging economies with growing pharmaceutical markets and an increasing focus on specialty excipients for niche therapeutic areas, act as potent growth accelerators. Furthermore, advancements in manufacturing processes, leading to improved efficiency, purity, and scalability of excipient production, contribute to sustained market expansion.
Key Players Shaping the Excipients Market
DuPont, Roquette, Ashland, BASF, Evonik, Associated British Foods, Lubrizol, DOW, Croda International, Archer Daniels Midland, Innophos, Kerry Group, Wacker Chemie, DFE Pharma, Colorcon, JRS Pharma, Air Liquide, Hunan ER-Kang pharmaceutical, Anhui Sunhere Pharmaceutical Excipients, Toudongbao Biotechnology, Shandong Head Co.,Ltd.
Notable Milestones in Excipients Sector
- 2019: Launch of novel biodegradable polymers for advanced controlled-release drug delivery systems by leading manufacturers.
- 2020: Increased demand for lipid-based excipients due to the rapid development and manufacturing of mRNA vaccines.
- 2021: Strategic acquisition of specialized excipient manufacturers by larger chemical and pharmaceutical ingredient companies to expand product portfolios and market reach.
- 2022: Growing emphasis on sustainable excipient sourcing and production, with several companies investing in bio-based raw materials.
- 2023: Advancements in the development of functional excipients designed to improve API stability and solubility for oral and parenteral formulations.
- 2024: Significant investment in R&D for excipients supporting the growth of biopharmaceuticals and advanced therapeutic modalities.
In-Depth Excipients Market Outlook
The future outlook for the excipients market is exceptionally promising, fueled by continuous innovation in pharmaceutical sciences and an ever-growing global demand for effective and patient-centric healthcare solutions. The sustained growth is underpinned by the development of specialized excipients for emerging drug modalities, personalized medicine, and advanced drug delivery systems that enhance therapeutic outcomes. Strategic collaborations between excipient providers and pharmaceutical innovators, alongside market expansion into burgeoning geographies, will be key to unlocking future growth potential. The industry's commitment to sustainability and the development of bio-based excipients will also shape market trends and create new avenues for expansion.
Excipients Segmentation
-
1. Application
- 1.1. Oral Formulations
- 1.2. Topical Formulations
- 1.3. Parenteral Formulations
- 1.4. Other Formulations
-
2. Types
- 2.1. Organic Excipients
- 2.2. Inorganic Excipients
Excipients Segmentation By Geography
-
1. North America
- 1.1. United States
- 1.2. Canada
- 1.3. Mexico
-
2. South America
- 2.1. Brazil
- 2.2. Argentina
- 2.3. Rest of South America
-
3. Europe
- 3.1. United Kingdom
- 3.2. Germany
- 3.3. France
- 3.4. Italy
- 3.5. Spain
- 3.6. Russia
- 3.7. Benelux
- 3.8. Nordics
- 3.9. Rest of Europe
-
4. Middle East & Africa
- 4.1. Turkey
- 4.2. Israel
- 4.3. GCC
- 4.4. North Africa
- 4.5. South Africa
- 4.6. Rest of Middle East & Africa
-
5. Asia Pacific
- 5.1. China
- 5.2. India
- 5.3. Japan
- 5.4. South Korea
- 5.5. ASEAN
- 5.6. Oceania
- 5.7. Rest of Asia Pacific
Excipients Regional Market Share
Geographic Coverage of Excipients
Excipients REPORT HIGHLIGHTS
| Aspects | Details |
|---|---|
| Study Period | 2020-2034 |
| Base Year | 2025 |
| Estimated Year | 2026 |
| Forecast Period | 2026-2034 |
| Historical Period | 2020-2025 |
| Growth Rate | CAGR of 7.56% from 2020-2034 |
| Segmentation |
|
Table of Contents
- 1. Introduction
- 1.1. Research Scope
- 1.2. Market Segmentation
- 1.3. Research Methodology
- 1.4. Definitions and Assumptions
- 2. Executive Summary
- 2.1. Introduction
- 3. Market Dynamics
- 3.1. Introduction
- 3.2. Market Drivers
- 3.3. Market Restrains
- 3.4. Market Trends
- 4. Market Factor Analysis
- 4.1. Porters Five Forces
- 4.2. Supply/Value Chain
- 4.3. PESTEL analysis
- 4.4. Market Entropy
- 4.5. Patent/Trademark Analysis
- 5. Global Excipients Analysis, Insights and Forecast, 2020-2032
- 5.1. Market Analysis, Insights and Forecast - by Application
- 5.1.1. Oral Formulations
- 5.1.2. Topical Formulations
- 5.1.3. Parenteral Formulations
- 5.1.4. Other Formulations
- 5.2. Market Analysis, Insights and Forecast - by Types
- 5.2.1. Organic Excipients
- 5.2.2. Inorganic Excipients
- 5.3. Market Analysis, Insights and Forecast - by Region
- 5.3.1. North America
- 5.3.2. South America
- 5.3.3. Europe
- 5.3.4. Middle East & Africa
- 5.3.5. Asia Pacific
- 5.1. Market Analysis, Insights and Forecast - by Application
- 6. North America Excipients Analysis, Insights and Forecast, 2020-2032
- 6.1. Market Analysis, Insights and Forecast - by Application
- 6.1.1. Oral Formulations
- 6.1.2. Topical Formulations
- 6.1.3. Parenteral Formulations
- 6.1.4. Other Formulations
- 6.2. Market Analysis, Insights and Forecast - by Types
- 6.2.1. Organic Excipients
- 6.2.2. Inorganic Excipients
- 6.1. Market Analysis, Insights and Forecast - by Application
- 7. South America Excipients Analysis, Insights and Forecast, 2020-2032
- 7.1. Market Analysis, Insights and Forecast - by Application
- 7.1.1. Oral Formulations
- 7.1.2. Topical Formulations
- 7.1.3. Parenteral Formulations
- 7.1.4. Other Formulations
- 7.2. Market Analysis, Insights and Forecast - by Types
- 7.2.1. Organic Excipients
- 7.2.2. Inorganic Excipients
- 7.1. Market Analysis, Insights and Forecast - by Application
- 8. Europe Excipients Analysis, Insights and Forecast, 2020-2032
- 8.1. Market Analysis, Insights and Forecast - by Application
- 8.1.1. Oral Formulations
- 8.1.2. Topical Formulations
- 8.1.3. Parenteral Formulations
- 8.1.4. Other Formulations
- 8.2. Market Analysis, Insights and Forecast - by Types
- 8.2.1. Organic Excipients
- 8.2.2. Inorganic Excipients
- 8.1. Market Analysis, Insights and Forecast - by Application
- 9. Middle East & Africa Excipients Analysis, Insights and Forecast, 2020-2032
- 9.1. Market Analysis, Insights and Forecast - by Application
- 9.1.1. Oral Formulations
- 9.1.2. Topical Formulations
- 9.1.3. Parenteral Formulations
- 9.1.4. Other Formulations
- 9.2. Market Analysis, Insights and Forecast - by Types
- 9.2.1. Organic Excipients
- 9.2.2. Inorganic Excipients
- 9.1. Market Analysis, Insights and Forecast - by Application
- 10. Asia Pacific Excipients Analysis, Insights and Forecast, 2020-2032
- 10.1. Market Analysis, Insights and Forecast - by Application
- 10.1.1. Oral Formulations
- 10.1.2. Topical Formulations
- 10.1.3. Parenteral Formulations
- 10.1.4. Other Formulations
- 10.2. Market Analysis, Insights and Forecast - by Types
- 10.2.1. Organic Excipients
- 10.2.2. Inorganic Excipients
- 10.1. Market Analysis, Insights and Forecast - by Application
- 11. Competitive Analysis
- 11.1. Global Market Share Analysis 2025
- 11.2. Company Profiles
- 11.2.1 DuPont
- 11.2.1.1. Overview
- 11.2.1.2. Products
- 11.2.1.3. SWOT Analysis
- 11.2.1.4. Recent Developments
- 11.2.1.5. Financials (Based on Availability)
- 11.2.2 Roquette
- 11.2.2.1. Overview
- 11.2.2.2. Products
- 11.2.2.3. SWOT Analysis
- 11.2.2.4. Recent Developments
- 11.2.2.5. Financials (Based on Availability)
- 11.2.3 Ashland
- 11.2.3.1. Overview
- 11.2.3.2. Products
- 11.2.3.3. SWOT Analysis
- 11.2.3.4. Recent Developments
- 11.2.3.5. Financials (Based on Availability)
- 11.2.4 BASF
- 11.2.4.1. Overview
- 11.2.4.2. Products
- 11.2.4.3. SWOT Analysis
- 11.2.4.4. Recent Developments
- 11.2.4.5. Financials (Based on Availability)
- 11.2.5 Evonik
- 11.2.5.1. Overview
- 11.2.5.2. Products
- 11.2.5.3. SWOT Analysis
- 11.2.5.4. Recent Developments
- 11.2.5.5. Financials (Based on Availability)
- 11.2.6 Associated British Foods
- 11.2.6.1. Overview
- 11.2.6.2. Products
- 11.2.6.3. SWOT Analysis
- 11.2.6.4. Recent Developments
- 11.2.6.5. Financials (Based on Availability)
- 11.2.7 Lubrizol
- 11.2.7.1. Overview
- 11.2.7.2. Products
- 11.2.7.3. SWOT Analysis
- 11.2.7.4. Recent Developments
- 11.2.7.5. Financials (Based on Availability)
- 11.2.8 DOW
- 11.2.8.1. Overview
- 11.2.8.2. Products
- 11.2.8.3. SWOT Analysis
- 11.2.8.4. Recent Developments
- 11.2.8.5. Financials (Based on Availability)
- 11.2.9 Croda International
- 11.2.9.1. Overview
- 11.2.9.2. Products
- 11.2.9.3. SWOT Analysis
- 11.2.9.4. Recent Developments
- 11.2.9.5. Financials (Based on Availability)
- 11.2.10 Archer Daniels Midland
- 11.2.10.1. Overview
- 11.2.10.2. Products
- 11.2.10.3. SWOT Analysis
- 11.2.10.4. Recent Developments
- 11.2.10.5. Financials (Based on Availability)
- 11.2.11 Innophos
- 11.2.11.1. Overview
- 11.2.11.2. Products
- 11.2.11.3. SWOT Analysis
- 11.2.11.4. Recent Developments
- 11.2.11.5. Financials (Based on Availability)
- 11.2.12 Kerry Group
- 11.2.12.1. Overview
- 11.2.12.2. Products
- 11.2.12.3. SWOT Analysis
- 11.2.12.4. Recent Developments
- 11.2.12.5. Financials (Based on Availability)
- 11.2.13 Wacker Chemie
- 11.2.13.1. Overview
- 11.2.13.2. Products
- 11.2.13.3. SWOT Analysis
- 11.2.13.4. Recent Developments
- 11.2.13.5. Financials (Based on Availability)
- 11.2.14 DFE Pharma
- 11.2.14.1. Overview
- 11.2.14.2. Products
- 11.2.14.3. SWOT Analysis
- 11.2.14.4. Recent Developments
- 11.2.14.5. Financials (Based on Availability)
- 11.2.15 Colorcon
- 11.2.15.1. Overview
- 11.2.15.2. Products
- 11.2.15.3. SWOT Analysis
- 11.2.15.4. Recent Developments
- 11.2.15.5. Financials (Based on Availability)
- 11.2.16 JRS Pharma
- 11.2.16.1. Overview
- 11.2.16.2. Products
- 11.2.16.3. SWOT Analysis
- 11.2.16.4. Recent Developments
- 11.2.16.5. Financials (Based on Availability)
- 11.2.17 Air Liquide
- 11.2.17.1. Overview
- 11.2.17.2. Products
- 11.2.17.3. SWOT Analysis
- 11.2.17.4. Recent Developments
- 11.2.17.5. Financials (Based on Availability)
- 11.2.18 Hunan ER-Kang pharmaceutical
- 11.2.18.1. Overview
- 11.2.18.2. Products
- 11.2.18.3. SWOT Analysis
- 11.2.18.4. Recent Developments
- 11.2.18.5. Financials (Based on Availability)
- 11.2.19 Anhui Sunhere Pharmaceutical Excipients
- 11.2.19.1. Overview
- 11.2.19.2. Products
- 11.2.19.3. SWOT Analysis
- 11.2.19.4. Recent Developments
- 11.2.19.5. Financials (Based on Availability)
- 11.2.20 Toudongbao Biotechnology
- 11.2.20.1. Overview
- 11.2.20.2. Products
- 11.2.20.3. SWOT Analysis
- 11.2.20.4. Recent Developments
- 11.2.20.5. Financials (Based on Availability)
- 11.2.21 Shandong Head Co.
- 11.2.21.1. Overview
- 11.2.21.2. Products
- 11.2.21.3. SWOT Analysis
- 11.2.21.4. Recent Developments
- 11.2.21.5. Financials (Based on Availability)
- 11.2.22 Ltd
- 11.2.22.1. Overview
- 11.2.22.2. Products
- 11.2.22.3. SWOT Analysis
- 11.2.22.4. Recent Developments
- 11.2.22.5. Financials (Based on Availability)
- 11.2.1 DuPont
List of Figures
- Figure 1: Global Excipients Revenue Breakdown (undefined, %) by Region 2025 & 2033
- Figure 2: Global Excipients Volume Breakdown (K, %) by Region 2025 & 2033
- Figure 3: North America Excipients Revenue (undefined), by Application 2025 & 2033
- Figure 4: North America Excipients Volume (K), by Application 2025 & 2033
- Figure 5: North America Excipients Revenue Share (%), by Application 2025 & 2033
- Figure 6: North America Excipients Volume Share (%), by Application 2025 & 2033
- Figure 7: North America Excipients Revenue (undefined), by Types 2025 & 2033
- Figure 8: North America Excipients Volume (K), by Types 2025 & 2033
- Figure 9: North America Excipients Revenue Share (%), by Types 2025 & 2033
- Figure 10: North America Excipients Volume Share (%), by Types 2025 & 2033
- Figure 11: North America Excipients Revenue (undefined), by Country 2025 & 2033
- Figure 12: North America Excipients Volume (K), by Country 2025 & 2033
- Figure 13: North America Excipients Revenue Share (%), by Country 2025 & 2033
- Figure 14: North America Excipients Volume Share (%), by Country 2025 & 2033
- Figure 15: South America Excipients Revenue (undefined), by Application 2025 & 2033
- Figure 16: South America Excipients Volume (K), by Application 2025 & 2033
- Figure 17: South America Excipients Revenue Share (%), by Application 2025 & 2033
- Figure 18: South America Excipients Volume Share (%), by Application 2025 & 2033
- Figure 19: South America Excipients Revenue (undefined), by Types 2025 & 2033
- Figure 20: South America Excipients Volume (K), by Types 2025 & 2033
- Figure 21: South America Excipients Revenue Share (%), by Types 2025 & 2033
- Figure 22: South America Excipients Volume Share (%), by Types 2025 & 2033
- Figure 23: South America Excipients Revenue (undefined), by Country 2025 & 2033
- Figure 24: South America Excipients Volume (K), by Country 2025 & 2033
- Figure 25: South America Excipients Revenue Share (%), by Country 2025 & 2033
- Figure 26: South America Excipients Volume Share (%), by Country 2025 & 2033
- Figure 27: Europe Excipients Revenue (undefined), by Application 2025 & 2033
- Figure 28: Europe Excipients Volume (K), by Application 2025 & 2033
- Figure 29: Europe Excipients Revenue Share (%), by Application 2025 & 2033
- Figure 30: Europe Excipients Volume Share (%), by Application 2025 & 2033
- Figure 31: Europe Excipients Revenue (undefined), by Types 2025 & 2033
- Figure 32: Europe Excipients Volume (K), by Types 2025 & 2033
- Figure 33: Europe Excipients Revenue Share (%), by Types 2025 & 2033
- Figure 34: Europe Excipients Volume Share (%), by Types 2025 & 2033
- Figure 35: Europe Excipients Revenue (undefined), by Country 2025 & 2033
- Figure 36: Europe Excipients Volume (K), by Country 2025 & 2033
- Figure 37: Europe Excipients Revenue Share (%), by Country 2025 & 2033
- Figure 38: Europe Excipients Volume Share (%), by Country 2025 & 2033
- Figure 39: Middle East & Africa Excipients Revenue (undefined), by Application 2025 & 2033
- Figure 40: Middle East & Africa Excipients Volume (K), by Application 2025 & 2033
- Figure 41: Middle East & Africa Excipients Revenue Share (%), by Application 2025 & 2033
- Figure 42: Middle East & Africa Excipients Volume Share (%), by Application 2025 & 2033
- Figure 43: Middle East & Africa Excipients Revenue (undefined), by Types 2025 & 2033
- Figure 44: Middle East & Africa Excipients Volume (K), by Types 2025 & 2033
- Figure 45: Middle East & Africa Excipients Revenue Share (%), by Types 2025 & 2033
- Figure 46: Middle East & Africa Excipients Volume Share (%), by Types 2025 & 2033
- Figure 47: Middle East & Africa Excipients Revenue (undefined), by Country 2025 & 2033
- Figure 48: Middle East & Africa Excipients Volume (K), by Country 2025 & 2033
- Figure 49: Middle East & Africa Excipients Revenue Share (%), by Country 2025 & 2033
- Figure 50: Middle East & Africa Excipients Volume Share (%), by Country 2025 & 2033
- Figure 51: Asia Pacific Excipients Revenue (undefined), by Application 2025 & 2033
- Figure 52: Asia Pacific Excipients Volume (K), by Application 2025 & 2033
- Figure 53: Asia Pacific Excipients Revenue Share (%), by Application 2025 & 2033
- Figure 54: Asia Pacific Excipients Volume Share (%), by Application 2025 & 2033
- Figure 55: Asia Pacific Excipients Revenue (undefined), by Types 2025 & 2033
- Figure 56: Asia Pacific Excipients Volume (K), by Types 2025 & 2033
- Figure 57: Asia Pacific Excipients Revenue Share (%), by Types 2025 & 2033
- Figure 58: Asia Pacific Excipients Volume Share (%), by Types 2025 & 2033
- Figure 59: Asia Pacific Excipients Revenue (undefined), by Country 2025 & 2033
- Figure 60: Asia Pacific Excipients Volume (K), by Country 2025 & 2033
- Figure 61: Asia Pacific Excipients Revenue Share (%), by Country 2025 & 2033
- Figure 62: Asia Pacific Excipients Volume Share (%), by Country 2025 & 2033
List of Tables
- Table 1: Global Excipients Revenue undefined Forecast, by Application 2020 & 2033
- Table 2: Global Excipients Volume K Forecast, by Application 2020 & 2033
- Table 3: Global Excipients Revenue undefined Forecast, by Types 2020 & 2033
- Table 4: Global Excipients Volume K Forecast, by Types 2020 & 2033
- Table 5: Global Excipients Revenue undefined Forecast, by Region 2020 & 2033
- Table 6: Global Excipients Volume K Forecast, by Region 2020 & 2033
- Table 7: Global Excipients Revenue undefined Forecast, by Application 2020 & 2033
- Table 8: Global Excipients Volume K Forecast, by Application 2020 & 2033
- Table 9: Global Excipients Revenue undefined Forecast, by Types 2020 & 2033
- Table 10: Global Excipients Volume K Forecast, by Types 2020 & 2033
- Table 11: Global Excipients Revenue undefined Forecast, by Country 2020 & 2033
- Table 12: Global Excipients Volume K Forecast, by Country 2020 & 2033
- Table 13: United States Excipients Revenue (undefined) Forecast, by Application 2020 & 2033
- Table 14: United States Excipients Volume (K) Forecast, by Application 2020 & 2033
- Table 15: Canada Excipients Revenue (undefined) Forecast, by Application 2020 & 2033
- Table 16: Canada Excipients Volume (K) Forecast, by Application 2020 & 2033
- Table 17: Mexico Excipients Revenue (undefined) Forecast, by Application 2020 & 2033
- Table 18: Mexico Excipients Volume (K) Forecast, by Application 2020 & 2033
- Table 19: Global Excipients Revenue undefined Forecast, by Application 2020 & 2033
- Table 20: Global Excipients Volume K Forecast, by Application 2020 & 2033
- Table 21: Global Excipients Revenue undefined Forecast, by Types 2020 & 2033
- Table 22: Global Excipients Volume K Forecast, by Types 2020 & 2033
- Table 23: Global Excipients Revenue undefined Forecast, by Country 2020 & 2033
- Table 24: Global Excipients Volume K Forecast, by Country 2020 & 2033
- Table 25: Brazil Excipients Revenue (undefined) Forecast, by Application 2020 & 2033
- Table 26: Brazil Excipients Volume (K) Forecast, by Application 2020 & 2033
- Table 27: Argentina Excipients Revenue (undefined) Forecast, by Application 2020 & 2033
- Table 28: Argentina Excipients Volume (K) Forecast, by Application 2020 & 2033
- Table 29: Rest of South America Excipients Revenue (undefined) Forecast, by Application 2020 & 2033
- Table 30: Rest of South America Excipients Volume (K) Forecast, by Application 2020 & 2033
- Table 31: Global Excipients Revenue undefined Forecast, by Application 2020 & 2033
- Table 32: Global Excipients Volume K Forecast, by Application 2020 & 2033
- Table 33: Global Excipients Revenue undefined Forecast, by Types 2020 & 2033
- Table 34: Global Excipients Volume K Forecast, by Types 2020 & 2033
- Table 35: Global Excipients Revenue undefined Forecast, by Country 2020 & 2033
- Table 36: Global Excipients Volume K Forecast, by Country 2020 & 2033
- Table 37: United Kingdom Excipients Revenue (undefined) Forecast, by Application 2020 & 2033
- Table 38: United Kingdom Excipients Volume (K) Forecast, by Application 2020 & 2033
- Table 39: Germany Excipients Revenue (undefined) Forecast, by Application 2020 & 2033
- Table 40: Germany Excipients Volume (K) Forecast, by Application 2020 & 2033
- Table 41: France Excipients Revenue (undefined) Forecast, by Application 2020 & 2033
- Table 42: France Excipients Volume (K) Forecast, by Application 2020 & 2033
- Table 43: Italy Excipients Revenue (undefined) Forecast, by Application 2020 & 2033
- Table 44: Italy Excipients Volume (K) Forecast, by Application 2020 & 2033
- Table 45: Spain Excipients Revenue (undefined) Forecast, by Application 2020 & 2033
- Table 46: Spain Excipients Volume (K) Forecast, by Application 2020 & 2033
- Table 47: Russia Excipients Revenue (undefined) Forecast, by Application 2020 & 2033
- Table 48: Russia Excipients Volume (K) Forecast, by Application 2020 & 2033
- Table 49: Benelux Excipients Revenue (undefined) Forecast, by Application 2020 & 2033
- Table 50: Benelux Excipients Volume (K) Forecast, by Application 2020 & 2033
- Table 51: Nordics Excipients Revenue (undefined) Forecast, by Application 2020 & 2033
- Table 52: Nordics Excipients Volume (K) Forecast, by Application 2020 & 2033
- Table 53: Rest of Europe Excipients Revenue (undefined) Forecast, by Application 2020 & 2033
- Table 54: Rest of Europe Excipients Volume (K) Forecast, by Application 2020 & 2033
- Table 55: Global Excipients Revenue undefined Forecast, by Application 2020 & 2033
- Table 56: Global Excipients Volume K Forecast, by Application 2020 & 2033
- Table 57: Global Excipients Revenue undefined Forecast, by Types 2020 & 2033
- Table 58: Global Excipients Volume K Forecast, by Types 2020 & 2033
- Table 59: Global Excipients Revenue undefined Forecast, by Country 2020 & 2033
- Table 60: Global Excipients Volume K Forecast, by Country 2020 & 2033
- Table 61: Turkey Excipients Revenue (undefined) Forecast, by Application 2020 & 2033
- Table 62: Turkey Excipients Volume (K) Forecast, by Application 2020 & 2033
- Table 63: Israel Excipients Revenue (undefined) Forecast, by Application 2020 & 2033
- Table 64: Israel Excipients Volume (K) Forecast, by Application 2020 & 2033
- Table 65: GCC Excipients Revenue (undefined) Forecast, by Application 2020 & 2033
- Table 66: GCC Excipients Volume (K) Forecast, by Application 2020 & 2033
- Table 67: North Africa Excipients Revenue (undefined) Forecast, by Application 2020 & 2033
- Table 68: North Africa Excipients Volume (K) Forecast, by Application 2020 & 2033
- Table 69: South Africa Excipients Revenue (undefined) Forecast, by Application 2020 & 2033
- Table 70: South Africa Excipients Volume (K) Forecast, by Application 2020 & 2033
- Table 71: Rest of Middle East & Africa Excipients Revenue (undefined) Forecast, by Application 2020 & 2033
- Table 72: Rest of Middle East & Africa Excipients Volume (K) Forecast, by Application 2020 & 2033
- Table 73: Global Excipients Revenue undefined Forecast, by Application 2020 & 2033
- Table 74: Global Excipients Volume K Forecast, by Application 2020 & 2033
- Table 75: Global Excipients Revenue undefined Forecast, by Types 2020 & 2033
- Table 76: Global Excipients Volume K Forecast, by Types 2020 & 2033
- Table 77: Global Excipients Revenue undefined Forecast, by Country 2020 & 2033
- Table 78: Global Excipients Volume K Forecast, by Country 2020 & 2033
- Table 79: China Excipients Revenue (undefined) Forecast, by Application 2020 & 2033
- Table 80: China Excipients Volume (K) Forecast, by Application 2020 & 2033
- Table 81: India Excipients Revenue (undefined) Forecast, by Application 2020 & 2033
- Table 82: India Excipients Volume (K) Forecast, by Application 2020 & 2033
- Table 83: Japan Excipients Revenue (undefined) Forecast, by Application 2020 & 2033
- Table 84: Japan Excipients Volume (K) Forecast, by Application 2020 & 2033
- Table 85: South Korea Excipients Revenue (undefined) Forecast, by Application 2020 & 2033
- Table 86: South Korea Excipients Volume (K) Forecast, by Application 2020 & 2033
- Table 87: ASEAN Excipients Revenue (undefined) Forecast, by Application 2020 & 2033
- Table 88: ASEAN Excipients Volume (K) Forecast, by Application 2020 & 2033
- Table 89: Oceania Excipients Revenue (undefined) Forecast, by Application 2020 & 2033
- Table 90: Oceania Excipients Volume (K) Forecast, by Application 2020 & 2033
- Table 91: Rest of Asia Pacific Excipients Revenue (undefined) Forecast, by Application 2020 & 2033
- Table 92: Rest of Asia Pacific Excipients Volume (K) Forecast, by Application 2020 & 2033
Frequently Asked Questions
1. What is the projected Compound Annual Growth Rate (CAGR) of the Excipients?
The projected CAGR is approximately 7.56%.
2. Which companies are prominent players in the Excipients?
Key companies in the market include DuPont, Roquette, Ashland, BASF, Evonik, Associated British Foods, Lubrizol, DOW, Croda International, Archer Daniels Midland, Innophos, Kerry Group, Wacker Chemie, DFE Pharma, Colorcon, JRS Pharma, Air Liquide, Hunan ER-Kang pharmaceutical, Anhui Sunhere Pharmaceutical Excipients, Toudongbao Biotechnology, Shandong Head Co., Ltd.
3. What are the main segments of the Excipients?
The market segments include Application, Types.
4. Can you provide details about the market size?
The market size is estimated to be USD XXX N/A as of 2022.
5. What are some drivers contributing to market growth?
N/A
6. What are the notable trends driving market growth?
N/A
7. Are there any restraints impacting market growth?
N/A
8. Can you provide examples of recent developments in the market?
N/A
9. What pricing options are available for accessing the report?
Pricing options include single-user, multi-user, and enterprise licenses priced at USD 3350.00, USD 5025.00, and USD 6700.00 respectively.
10. Is the market size provided in terms of value or volume?
The market size is provided in terms of value, measured in N/A and volume, measured in K.
11. Are there any specific market keywords associated with the report?
Yes, the market keyword associated with the report is "Excipients," which aids in identifying and referencing the specific market segment covered.
12. How do I determine which pricing option suits my needs best?
The pricing options vary based on user requirements and access needs. Individual users may opt for single-user licenses, while businesses requiring broader access may choose multi-user or enterprise licenses for cost-effective access to the report.
13. Are there any additional resources or data provided in the Excipients report?
While the report offers comprehensive insights, it's advisable to review the specific contents or supplementary materials provided to ascertain if additional resources or data are available.
14. How can I stay updated on further developments or reports in the Excipients?
To stay informed about further developments, trends, and reports in the Excipients, consider subscribing to industry newsletters, following relevant companies and organizations, or regularly checking reputable industry news sources and publications.
Methodology
Step 1 - Identification of Relevant Samples Size from Population Database


Step 2 - Approaches for Defining Global Market Size (Value, Volume* & Price*)

Note*: In applicable scenarios
Step 3 - Data Sources
Primary Research
- Web Analytics
- Survey Reports
- Research Institute
- Latest Research Reports
- Opinion Leaders
Secondary Research
- Annual Reports
- White Paper
- Latest Press Release
- Industry Association
- Paid Database
- Investor Presentations

Step 4 - Data Triangulation
Involves using different sources of information in order to increase the validity of a study
These sources are likely to be stakeholders in a program - participants, other researchers, program staff, other community members, and so on.
Then we put all data in single framework & apply various statistical tools to find out the dynamic on the market.
During the analysis stage, feedback from the stakeholder groups would be compared to determine areas of agreement as well as areas of divergence