

Key Insights
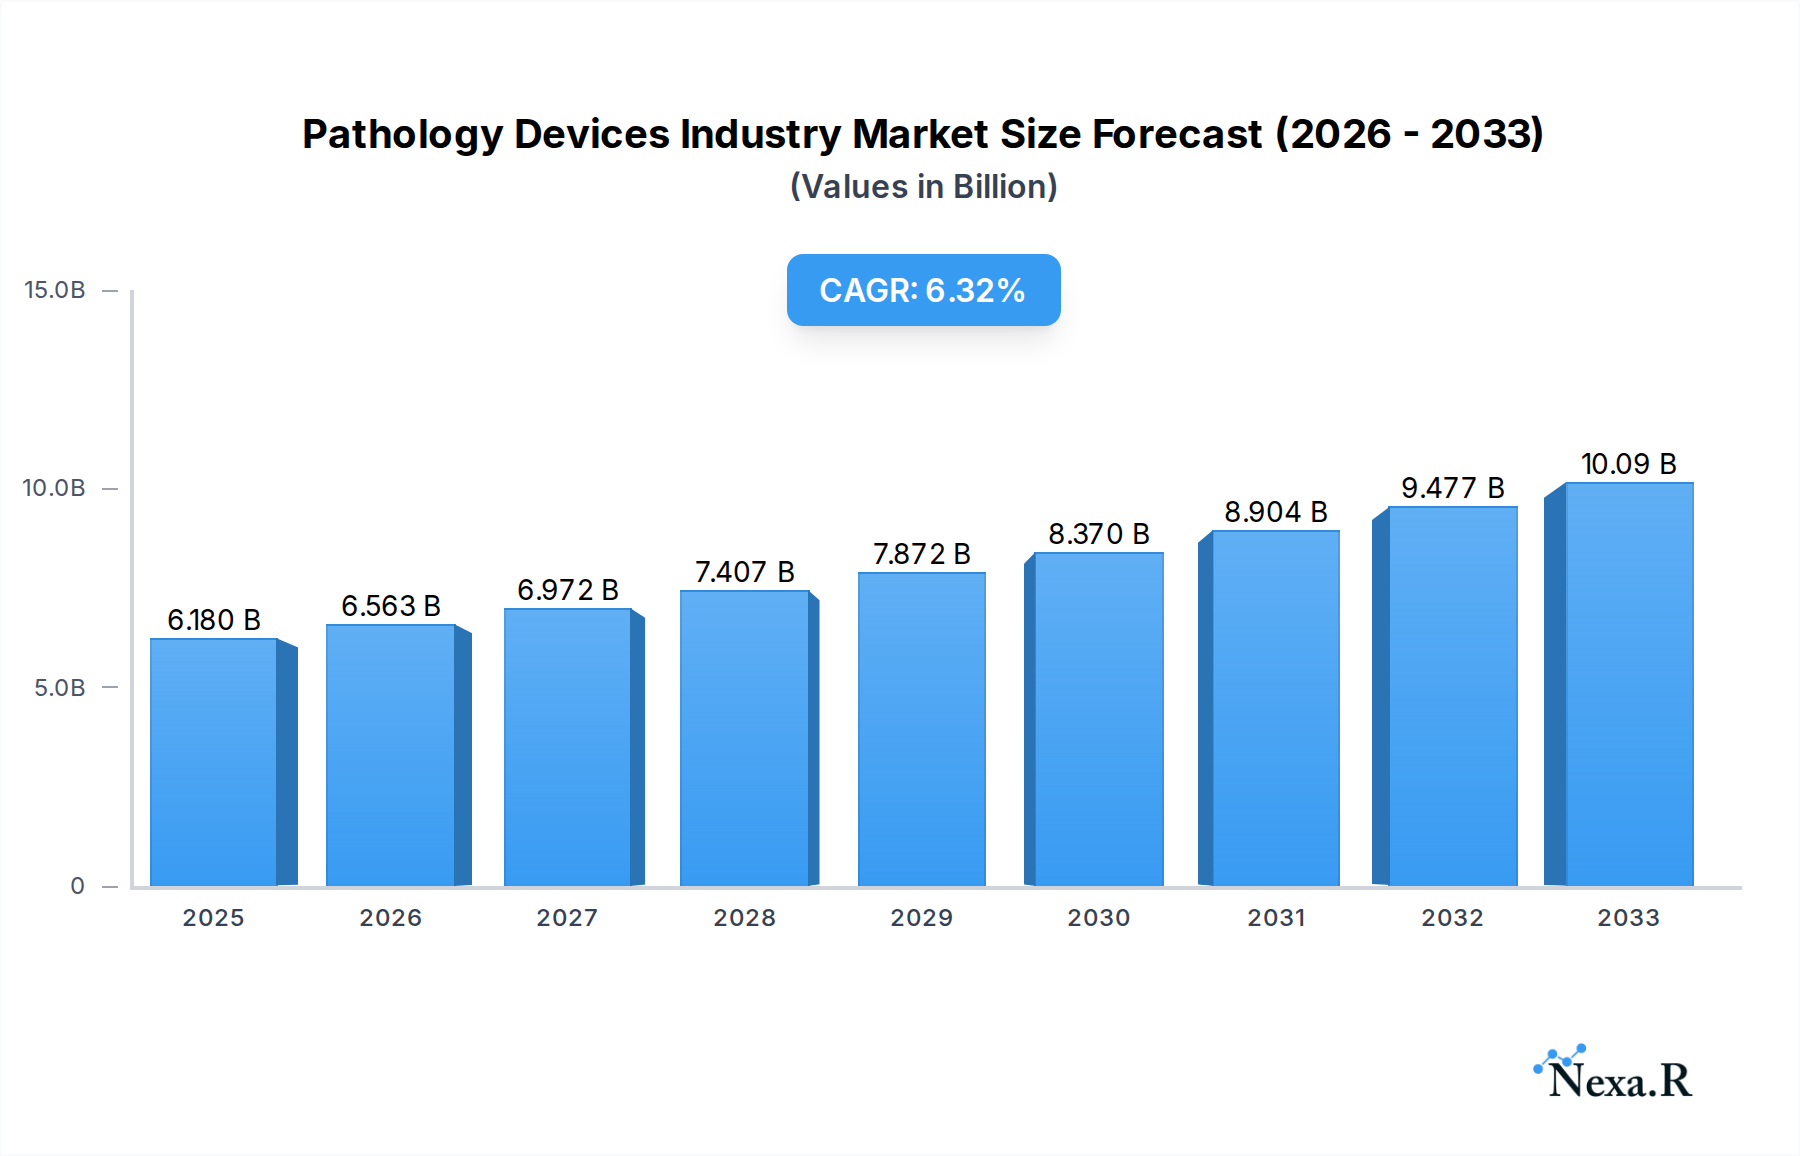
The global Pathology Devices Industry is poised for significant expansion, projecting a market size of USD 6.18 billion by 2025, with a robust Compound Annual Growth Rate (CAGR) of 6.12% anticipated to drive its trajectory through 2033. This substantial growth is underpinned by several critical drivers, including the increasing prevalence of chronic and infectious diseases, a growing demand for early disease detection and diagnosis, and continuous technological advancements in diagnostic instrumentation. The rising emphasis on personalized medicine and precision oncology further fuels the need for sophisticated pathology solutions. Furthermore, an aging global population, which is more susceptible to various diseases, contributes to the sustained demand for advanced pathology devices. Investment in research and development by key market players is also instrumental in introducing innovative products and expanding the application scope of pathology devices.

Pathology Devices Industry Market Size (In Billion)
The industry is characterized by a dynamic landscape of technological innovation and evolving application needs. Key technologies shaping the market include Clinical Chemistry, Immunoassays, Microbiology, and Molecular Diagnostics, each contributing unique capabilities to disease analysis. The applications span critical areas such as Drug Discovery and Development, Disease Diagnostics, and Forensic Diagnostics, reflecting the broad impact of pathology on healthcare and beyond. Major end-users like Pharmaceutical Companies, Hospitals, and Diagnostic Laboratories are driving market demand through their increasing adoption of advanced technologies. Geographically, North America and Europe currently dominate the market due to well-established healthcare infrastructures and high R&D spending, but the Asia Pacific region is emerging as a high-growth area, driven by increasing healthcare expenditure and a growing awareness of advanced diagnostic techniques. Restraints, such as high initial investment costs and regulatory hurdles in certain regions, are being mitigated by technological advancements and a growing understanding of the long-term cost-effectiveness of early and accurate diagnosis.
Pathology Devices Industry Company Market Share
Unlocking Insights: Pathology Devices Industry Report - Market Dynamics, Growth Trajectories, and Future Outlook (2019-2033)
This comprehensive report offers an in-depth analysis of the global Pathology Devices Industry, a critical sector underpinning advancements in disease diagnostics, drug discovery, and forensic science. The study provides a detailed market outlook from 2019 to 2033, with a base and estimated year of 2025, and a forecast period spanning 2025-2033. It delves into market dynamics, growth trends, regional dominance, product landscapes, key drivers, challenges, emerging opportunities, and the strategic initiatives of leading market players. With a focus on clinical chemistry, immunoassays technology, microbiology, and molecular diagnostics, and applications spanning drug discovery, disease diagnostics, and forensic diagnostics, this report is an essential resource for pharmaceutical companies, hospitals, diagnostic laboratories, and other stakeholders navigating this evolving industry. We present all values in Million units for clarity and actionable insights.
Pathology Devices Industry Market Dynamics & Structure
The global Pathology Devices Industry exhibits a moderately consolidated market structure, characterized by the presence of established multinational corporations and a growing number of specialized innovators. Technological innovation remains a primary driver, with ongoing research and development focused on enhancing accuracy, throughput, and automation in diagnostic processes. Molecular diagnostics and immunoassays technology are at the forefront of this innovation wave, enabling earlier and more precise disease detection. The stringent regulatory frameworks established by bodies like the FDA and EMA significantly influence market entry and product development, ensuring patient safety and data integrity. Competitive product substitutes, while present in some segments like traditional histology, are increasingly being overshadowed by advanced automated systems and AI-driven analytical tools. End-user demographics are shifting, with an increasing demand for point-of-care testing solutions and integrated diagnostic platforms from hospitals and diagnostic laboratories. Merger and acquisition (M&A) trends are indicative of strategic consolidation, with larger players acquiring smaller, innovative companies to expand their portfolios and market reach. For instance, the historical period (2019-2024) has seen approximately 15-20 M&A deals annually in the broader healthcare diagnostics space, with a notable percentage targeting pathology-specific technologies. Barriers to innovation include the high cost of R&D, the lengthy regulatory approval processes, and the need for specialized expertise in fields like bioinformatics and artificial intelligence.
- Market Concentration: Moderately consolidated, with key players holding significant market share.
- Technological Innovation Drivers: Automation, AI in diagnostics, miniaturization, multiplexing capabilities, liquid biopsy technologies.
- Regulatory Frameworks: FDA, EMA, WHO guidelines, IVDR (In Vitro Diagnostic Regulation) in Europe.
- Competitive Product Substitutes: Traditional manual methods versus automated systems, emerging point-of-care diagnostics.
- End-User Demographics: Growing demand for integrated platforms, remote diagnostics, and personalized medicine solutions.
- M&A Trends: Strategic acquisitions to gain market share, access new technologies, and expand geographical reach.
Pathology Devices Industry Growth Trends & Insights
The Pathology Devices Industry is poised for robust growth, driven by an escalating global burden of chronic and infectious diseases, an aging population, and increasing healthcare expenditure. The market size evolution is projected to witness a Compound Annual Growth Rate (CAGR) of approximately 7.5% over the forecast period (2025-2033). Adoption rates for advanced diagnostic technologies, particularly in molecular diagnostics and clinical chemistry, are accelerating due to their superior accuracy and efficiency compared to traditional methods. Technological disruptions, such as the integration of artificial intelligence and machine learning for image analysis and data interpretation, are revolutionizing diagnostic workflows, leading to faster and more reliable diagnoses. Consumer behavior shifts are also playing a crucial role, with a growing emphasis on preventative healthcare and early disease detection. Patients are increasingly proactive in seeking diagnostic tests, and healthcare providers are investing in technologies that can deliver faster turnaround times and personalized treatment insights. The Drug Discovery and Development application segment is experiencing significant expansion, as pharmaceutical companies leverage advanced pathology devices for target identification, biomarker discovery, and drug efficacy testing. Furthermore, the rising incidence of cancer, autoimmune disorders, and neurological conditions fuels the demand for sophisticated diagnostic tools. The global market is anticipated to reach an estimated value of USD 45,000 million units by 2033, up from an estimated USD 25,000 million units in 2025. This expansion is supported by ongoing technological advancements that enhance the sensitivity and specificity of diagnostic tests, as well as increased adoption of these technologies in emerging economies. The integration of digital pathology solutions, allowing for remote access and collaboration, is also contributing to market expansion by overcoming geographical barriers.
Dominant Regions, Countries, or Segments in Pathology Devices Industry
North America, particularly the United States, currently dominates the Pathology Devices Industry, driven by substantial investments in healthcare infrastructure, a high prevalence of chronic diseases, and a well-established reimbursement framework for diagnostic procedures. The region's dominance is further bolstered by the presence of leading global players and a robust ecosystem for research and development. The Molecular Diagnostics segment stands out as a key growth driver within the Technology classification. This segment's leadership is attributed to the increasing demand for genetic testing, companion diagnostics, and infectious disease screening. The Disease Diagnostics application segment is a major contributor to overall market growth, reflecting the universal need for accurate and timely identification of various ailments. Within the End-User category, Hospitals and Diagnostic Laboratories represent the largest and fastest-growing segment. Their pivotal role in patient care and the continuous need for advanced diagnostic capabilities solidify their position.
Dominant Region: North America (primarily the United States).
- Key Drivers: High healthcare spending, advanced technological adoption, strong regulatory support, significant R&D investment.
- Market Share: Estimated at over 35% of the global market.
- Growth Potential: Continued expansion driven by precision medicine and personalized healthcare initiatives.
Dominant Technology Segment: Molecular Diagnostics.
- Key Drivers: Advancements in PCR, NGS, CRISPR technology; demand for genetic testing, infectious disease diagnostics, and cancer profiling.
- Market Share: Expected to represent approximately 30% of the total technology segment value by 2028.
- Growth Potential: Driven by emerging infectious diseases and the growing field of personalized oncology.
Dominant Application Segment: Disease Diagnostics.
- Key Drivers: Rising prevalence of chronic diseases (cardiovascular, cancer, diabetes), infectious outbreaks, demand for early detection and screening.
- Market Share: Constituting over 40% of the application segment revenue.
- Growth Potential: Supported by population growth and increasing awareness of health monitoring.
Dominant End-User Segment: Hospitals and Diagnostic Laboratories.
- Key Drivers: Central role in healthcare delivery, increasing adoption of advanced diagnostic platforms, need for high-throughput and accurate testing.
- Market Share: Estimated to account for more than 50% of the end-user market.
- Growth Potential: Fueled by the expansion of healthcare services, particularly in emerging economies, and the shift towards centralized diagnostic hubs.
Pathology Devices Industry Product Landscape
The Pathology Devices Industry product landscape is characterized by a continuous stream of innovations aimed at enhancing diagnostic capabilities and operational efficiency. Key product developments include automated hematology analyzers, advanced immunoassay platforms offering multiplexing capabilities, high-throughput molecular diagnostic systems for infectious disease and oncology testing, and sophisticated digital pathology solutions for image analysis and archival. Performance metrics such as assay sensitivity, specificity, turnaround time, and cost-effectiveness are paramount. Unique selling propositions often revolve around superior analytical performance, user-friendly interfaces, seamless integration with laboratory information systems (LIS), and compliance with stringent regulatory standards. Technological advancements are pushing the boundaries of what is diagnostically possible, enabling earlier detection, more accurate prognostication, and personalized treatment strategies. For instance, the introduction of next-generation sequencing (NGS) platforms has revolutionized cancer diagnostics and research, while advancements in microfluidics are paving the way for smaller, more portable diagnostic devices. The estimated market size for key technologies in 2025 includes Clinical Chemistry (USD 7,500 million units), Immunoassays Technology (USD 9,000 million units), Microbiology (USD 3,000 million units), and Molecular Diagnostics (USD 5,500 million units).
Key Drivers, Barriers & Challenges in Pathology Devices Industry
The Pathology Devices Industry is propelled by several key drivers. Technological innovation in areas like automation, AI, and next-generation sequencing enhances diagnostic accuracy and efficiency. The increasing global prevalence of chronic and infectious diseases necessitates advanced diagnostic solutions. Favorable reimbursement policies in developed nations and growing healthcare expenditure worldwide also fuel market expansion. Furthermore, the rising demand for personalized medicine and targeted therapies is driving the adoption of advanced molecular diagnostics.
Conversely, the industry faces significant barriers and challenges. The high cost of research and development, coupled with lengthy and rigorous regulatory approval processes, can impede the timely market entry of new technologies. Supply chain disruptions, as witnessed during recent global events, pose a considerable risk to manufacturing and distribution. Intense competition among established players and emerging startups can lead to price pressures. Moreover, the need for highly skilled personnel to operate and interpret results from complex pathology devices presents a workforce challenge. The limited adoption of advanced diagnostics in low- and middle-income countries due to cost and infrastructure limitations also acts as a restraint.
Emerging Opportunities in Pathology Devices Industry
Emerging opportunities within the Pathology Devices Industry are abundant, driven by evolving healthcare needs and technological advancements. The burgeoning field of liquid biopsy presents a significant avenue for growth, offering less invasive methods for cancer detection and monitoring. The increasing focus on point-of-care diagnostics creates opportunities for developing portable and user-friendly pathology devices that can deliver rapid results in diverse settings. The integration of artificial intelligence (AI) and machine learning (ML) in pathology is poised to revolutionize image analysis, disease prediction, and drug development, opening new markets for AI-powered diagnostic software and platforms. The growing demand for companion diagnostics to guide targeted therapies, particularly in oncology, offers substantial growth potential. Furthermore, the expansion of healthcare infrastructure and diagnostic capabilities in emerging economies, such as in Asia Pacific and Latin America, represents a significant untapped market. The global market for AI in diagnostics is projected to grow at a CAGR of over 30% from 2025-2033.
Growth Accelerators in the Pathology Devices Industry Industry
Several catalysts are accelerating long-term growth within the Pathology Devices Industry. Technological breakthroughs, including advancements in gene sequencing, bioinformatics, and automation, are continuously expanding diagnostic capabilities and reducing testing costs. Strategic partnerships between diagnostic device manufacturers, pharmaceutical companies, and research institutions are fostering innovation and accelerating the development of new diagnostic solutions and companion diagnostics. Market expansion strategies, particularly targeting emerging economies with growing healthcare needs and improving infrastructure, are opening up new revenue streams. The increasing government initiatives focused on public health and disease surveillance further boost the demand for advanced pathology equipment. The growing adoption of digital pathology and integrated diagnostic platforms is also a key accelerator, enhancing workflow efficiency and enabling better data management and analysis, leading to improved patient outcomes.
Key Players Shaping the Pathology Devices Industry Market
- Becton Dickinson and Company
- Beckman Coulter Inc
- Ortho-Clinical Diagnostics
- Abbott Laboratories
- Danaher Corporation
- Hamamatsu Photonics
- F Hoffmann-La Roche AG
- Mikroscan Technologies
- Bio-Rad Laboratories
- Siemens Healthineers
- Thermo Fisher Scientific
- Definiens
Notable Milestones in Pathology Devices Industry Sector
- September 2022: Sysmex Corporation launched UF-1500 fully automated urine particle analyzer (UF-1500), a new product for use in urine sediment testing. This launch assists the company in expanding its product lineup and delivering a wide range of solutions to customers.
- May 2022: BD launched the BD COR MX instrument, a new, fully automated, high-throughput infectious disease molecular diagnostics platform that is used to detect the three most prevalent non-viral sexually transmitted infections (STIs) - Chlamydia trachomatis (CT), Neisseria gonorrhoeae (GC) and Trichomonas vaginalis (TV), in the United States.
In-Depth Pathology Devices Industry Market Outlook
The Pathology Devices Industry is set for continued expansion, driven by a confluence of technological advancements and increasing global healthcare demands. Growth accelerators, including the rapid development of molecular diagnostics, the integration of AI and machine learning in diagnostic workflows, and the burgeoning market for liquid biopsies, will shape the future landscape. Strategic partnerships and the expansion of existing players into emerging markets will further bolster growth. The industry's future potential lies in its ability to deliver more accurate, accessible, and personalized diagnostic solutions, playing a pivotal role in preventative healthcare, precision medicine, and the global fight against disease. Key opportunities for strategic investment and development include the enhancement of point-of-care testing capabilities and the continued advancement of digital pathology platforms for seamless data integration and analysis. The estimated market size for the Pathology Devices Industry is projected to reach USD 45,000 million units by 2033.
Pathology Devices Industry Segmentation
-
1. Technology
- 1.1. Clinical Chemistry
- 1.2. Immunoassays Technology
- 1.3. Microbiology
- 1.4. Molecular Diagnostics
- 1.5. Other Technologies
-
2. Application
- 2.1. Drug Discovery and Development
- 2.2. Disease Diagnostics
- 2.3. Forensic Diagnostics
- 2.4. Other Applications
-
3. End-User
- 3.1. Pharmaceutical Companies
- 3.2. Hospitals and Diagnostic Laboratories
- 3.3. Other End-Users
Pathology Devices Industry Segmentation By Geography
-
1. North America
- 1.1. United States
- 1.2. Canada
- 1.3. Mexico
-
2. Europe
- 2.1. Germany
- 2.2. United Kingdom
- 2.3. France
- 2.4. Italy
- 2.5. Spain
- 2.6. Rest of Europe
-
3. Asia Pacific
- 3.1. China
- 3.2. Japan
- 3.3. India
- 3.4. Australia
- 3.5. South Korea
- 3.6. Rest of Asia Pacific
-
4. Middle East and Africa
- 4.1. GCC
- 4.2. South Africa
- 4.3. Rest of Middle East and Africa
-
5. South America
- 5.1. Brazil
- 5.2. Argentina
- 5.3. Rest of South America

Pathology Devices Industry Regional Market Share
Geographic Coverage of Pathology Devices Industry
Pathology Devices Industry REPORT HIGHLIGHTS
| Aspects | Details |
|---|---|
| Study Period | 2020-2034 |
| Base Year | 2025 |
| Estimated Year | 2026 |
| Forecast Period | 2026-2034 |
| Historical Period | 2020-2025 |
| Growth Rate | CAGR of 6.12% from 2020-2034 |
| Segmentation |
|
Table of Contents
- 1. Introduction
- 1.1. Research Scope
- 1.2. Market Segmentation
- 1.3. Research Objective
- 1.4. Definitions and Assumptions
- 2. Executive Summary
- 2.1. Market Snapshot
- 3. Market Dynamics
- 3.1. Market Drivers
- 3.2. Market Restrains
- 3.3. Market Trends
- 3.4. Market Opportunities
- 4. Market Factor Analysis
- 4.1. Porters Five Forces
- 4.1.1. Bargaining Power of Suppliers
- 4.1.2. Bargaining Power of Buyers
- 4.1.3. Threat of New Entrants
- 4.1.4. Threat of Substitutes
- 4.1.5. Competitive Rivalry
- 4.2. PESTEL analysis
- 4.3. BCG Analysis
- 4.3.1. Stars (High Growth, High Market Share)
- 4.3.2. Cash Cows (Low Growth, High Market Share)
- 4.3.3. Question Mark (High Growth, Low Market Share)
- 4.3.4. Dogs (Low Growth, Low Market Share)
- 4.4. Ansoff Matrix Analysis
- 4.5. Supply Chain Analysis
- 4.6. Regulatory Landscape
- 4.7. Current Market Potential and Opportunity Assessment (TAM–SAM–SOM Framework)
- 4.8. NRP Analyst Note
- 4.1. Porters Five Forces
- 5. Market Analysis, Insights and Forecast 2021-2033
- 5.1. Market Analysis, Insights and Forecast - by Technology
- 5.1.1. Clinical Chemistry
- 5.1.2. Immunoassays Technology
- 5.1.3. Microbiology
- 5.1.4. Molecular Diagnostics
- 5.1.5. Other Technologies
- 5.2. Market Analysis, Insights and Forecast - by Application
- 5.2.1. Drug Discovery and Development
- 5.2.2. Disease Diagnostics
- 5.2.3. Forensic Diagnostics
- 5.2.4. Other Applications
- 5.3. Market Analysis, Insights and Forecast - by End-User
- 5.3.1. Pharmaceutical Companies
- 5.3.2. Hospitals and Diagnostic Laboratories
- 5.3.3. Other End-Users
- 5.4. Market Analysis, Insights and Forecast - by Region
- 5.4.1. North America
- 5.4.2. Europe
- 5.4.3. Asia Pacific
- 5.4.4. Middle East and Africa
- 5.4.5. South America
- 5.1. Market Analysis, Insights and Forecast - by Technology
- 6. Global Pathology Devices Industry Analysis, Insights and Forecast, 2021-2033
- 6.1. Market Analysis, Insights and Forecast - by Technology
- 6.1.1. Clinical Chemistry
- 6.1.2. Immunoassays Technology
- 6.1.3. Microbiology
- 6.1.4. Molecular Diagnostics
- 6.1.5. Other Technologies
- 6.2. Market Analysis, Insights and Forecast - by Application
- 6.2.1. Drug Discovery and Development
- 6.2.2. Disease Diagnostics
- 6.2.3. Forensic Diagnostics
- 6.2.4. Other Applications
- 6.3. Market Analysis, Insights and Forecast - by End-User
- 6.3.1. Pharmaceutical Companies
- 6.3.2. Hospitals and Diagnostic Laboratories
- 6.3.3. Other End-Users
- 6.1. Market Analysis, Insights and Forecast - by Technology
- 7. North America Pathology Devices Industry Analysis, Insights and Forecast, 2020-2032
- 7.1. Market Analysis, Insights and Forecast - by Technology
- 7.1.1. Clinical Chemistry
- 7.1.2. Immunoassays Technology
- 7.1.3. Microbiology
- 7.1.4. Molecular Diagnostics
- 7.1.5. Other Technologies
- 7.2. Market Analysis, Insights and Forecast - by Application
- 7.2.1. Drug Discovery and Development
- 7.2.2. Disease Diagnostics
- 7.2.3. Forensic Diagnostics
- 7.2.4. Other Applications
- 7.3. Market Analysis, Insights and Forecast - by End-User
- 7.3.1. Pharmaceutical Companies
- 7.3.2. Hospitals and Diagnostic Laboratories
- 7.3.3. Other End-Users
- 7.1. Market Analysis, Insights and Forecast - by Technology
- 8. Europe Pathology Devices Industry Analysis, Insights and Forecast, 2020-2032
- 8.1. Market Analysis, Insights and Forecast - by Technology
- 8.1.1. Clinical Chemistry
- 8.1.2. Immunoassays Technology
- 8.1.3. Microbiology
- 8.1.4. Molecular Diagnostics
- 8.1.5. Other Technologies
- 8.2. Market Analysis, Insights and Forecast - by Application
- 8.2.1. Drug Discovery and Development
- 8.2.2. Disease Diagnostics
- 8.2.3. Forensic Diagnostics
- 8.2.4. Other Applications
- 8.3. Market Analysis, Insights and Forecast - by End-User
- 8.3.1. Pharmaceutical Companies
- 8.3.2. Hospitals and Diagnostic Laboratories
- 8.3.3. Other End-Users
- 8.1. Market Analysis, Insights and Forecast - by Technology
- 9. Asia Pacific Pathology Devices Industry Analysis, Insights and Forecast, 2020-2032
- 9.1. Market Analysis, Insights and Forecast - by Technology
- 9.1.1. Clinical Chemistry
- 9.1.2. Immunoassays Technology
- 9.1.3. Microbiology
- 9.1.4. Molecular Diagnostics
- 9.1.5. Other Technologies
- 9.2. Market Analysis, Insights and Forecast - by Application
- 9.2.1. Drug Discovery and Development
- 9.2.2. Disease Diagnostics
- 9.2.3. Forensic Diagnostics
- 9.2.4. Other Applications
- 9.3. Market Analysis, Insights and Forecast - by End-User
- 9.3.1. Pharmaceutical Companies
- 9.3.2. Hospitals and Diagnostic Laboratories
- 9.3.3. Other End-Users
- 9.1. Market Analysis, Insights and Forecast - by Technology
- 10. Middle East and Africa Pathology Devices Industry Analysis, Insights and Forecast, 2020-2032
- 10.1. Market Analysis, Insights and Forecast - by Technology
- 10.1.1. Clinical Chemistry
- 10.1.2. Immunoassays Technology
- 10.1.3. Microbiology
- 10.1.4. Molecular Diagnostics
- 10.1.5. Other Technologies
- 10.2. Market Analysis, Insights and Forecast - by Application
- 10.2.1. Drug Discovery and Development
- 10.2.2. Disease Diagnostics
- 10.2.3. Forensic Diagnostics
- 10.2.4. Other Applications
- 10.3. Market Analysis, Insights and Forecast - by End-User
- 10.3.1. Pharmaceutical Companies
- 10.3.2. Hospitals and Diagnostic Laboratories
- 10.3.3. Other End-Users
- 10.1. Market Analysis, Insights and Forecast - by Technology
- 11. South America Pathology Devices Industry Analysis, Insights and Forecast, 2020-2032
- 11.1. Market Analysis, Insights and Forecast - by Technology
- 11.1.1. Clinical Chemistry
- 11.1.2. Immunoassays Technology
- 11.1.3. Microbiology
- 11.1.4. Molecular Diagnostics
- 11.1.5. Other Technologies
- 11.2. Market Analysis, Insights and Forecast - by Application
- 11.2.1. Drug Discovery and Development
- 11.2.2. Disease Diagnostics
- 11.2.3. Forensic Diagnostics
- 11.2.4. Other Applications
- 11.3. Market Analysis, Insights and Forecast - by End-User
- 11.3.1. Pharmaceutical Companies
- 11.3.2. Hospitals and Diagnostic Laboratories
- 11.3.3. Other End-Users
- 11.1. Market Analysis, Insights and Forecast - by Technology
- 12. Competitive Analysis
- 12.1. Company Profiles
- 12.1.1 Becton Dickinson and Company
- 12.1.1.1. Company Overview
- 12.1.1.2. Products
- 12.1.1.3. Company Financials
- 12.1.1.4. SWOT Analysis
- 12.1.2 Beckman Coulter Inc
- 12.1.2.1. Company Overview
- 12.1.2.2. Products
- 12.1.2.3. Company Financials
- 12.1.2.4. SWOT Analysis
- 12.1.3 Ortho-Clinical Diagnostics
- 12.1.3.1. Company Overview
- 12.1.3.2. Products
- 12.1.3.3. Company Financials
- 12.1.3.4. SWOT Analysis
- 12.1.4 Abbott Laboratories
- 12.1.4.1. Company Overview
- 12.1.4.2. Products
- 12.1.4.3. Company Financials
- 12.1.4.4. SWOT Analysis
- 12.1.5 Danaher Corporation
- 12.1.5.1. Company Overview
- 12.1.5.2. Products
- 12.1.5.3. Company Financials
- 12.1.5.4. SWOT Analysis
- 12.1.6 Hamamatsu Photonics
- 12.1.6.1. Company Overview
- 12.1.6.2. Products
- 12.1.6.3. Company Financials
- 12.1.6.4. SWOT Analysis
- 12.1.7 F Hoffmann-La Roche AG
- 12.1.7.1. Company Overview
- 12.1.7.2. Products
- 12.1.7.3. Company Financials
- 12.1.7.4. SWOT Analysis
- 12.1.8 Mikroscan Technologies
- 12.1.8.1. Company Overview
- 12.1.8.2. Products
- 12.1.8.3. Company Financials
- 12.1.8.4. SWOT Analysis
- 12.1.9 Bio-Rad Laboratories
- 12.1.9.1. Company Overview
- 12.1.9.2. Products
- 12.1.9.3. Company Financials
- 12.1.9.4. SWOT Analysis
- 12.1.10 Siemens Healthineers
- 12.1.10.1. Company Overview
- 12.1.10.2. Products
- 12.1.10.3. Company Financials
- 12.1.10.4. SWOT Analysis
- 12.1.11 Thermo Fisher Scientific
- 12.1.11.1. Company Overview
- 12.1.11.2. Products
- 12.1.11.3. Company Financials
- 12.1.11.4. SWOT Analysis
- 12.1.12 Definiens
- 12.1.12.1. Company Overview
- 12.1.12.2. Products
- 12.1.12.3. Company Financials
- 12.1.12.4. SWOT Analysis
- 12.1.1 Becton Dickinson and Company
- 12.2. Market Entropy
- 12.2.1 Company's Key Areas Served
- 12.2.2 Recent Developments
- 12.3. Company Market Share Analysis 2025
- 12.3.1 Top 5 Companies Market Share Analysis
- 12.3.2 Top 3 Companies Market Share Analysis
- 12.4. List of Potential Customers
- 13. Research Methodology
List of Figures
- Figure 1: Global Pathology Devices Industry Revenue Breakdown (Million, %) by Region 2025 & 2033
- Figure 2: Global Pathology Devices Industry Volume Breakdown (K Units, %) by Region 2025 & 2033
- Figure 3: North America Pathology Devices Industry Revenue (Million), by Technology 2025 & 2033
- Figure 4: North America Pathology Devices Industry Volume (K Units), by Technology 2025 & 2033
- Figure 5: North America Pathology Devices Industry Revenue Share (%), by Technology 2025 & 2033
- Figure 6: North America Pathology Devices Industry Volume Share (%), by Technology 2025 & 2033
- Figure 7: North America Pathology Devices Industry Revenue (Million), by Application 2025 & 2033
- Figure 8: North America Pathology Devices Industry Volume (K Units), by Application 2025 & 2033
- Figure 9: North America Pathology Devices Industry Revenue Share (%), by Application 2025 & 2033
- Figure 10: North America Pathology Devices Industry Volume Share (%), by Application 2025 & 2033
- Figure 11: North America Pathology Devices Industry Revenue (Million), by End-User 2025 & 2033
- Figure 12: North America Pathology Devices Industry Volume (K Units), by End-User 2025 & 2033
- Figure 13: North America Pathology Devices Industry Revenue Share (%), by End-User 2025 & 2033
- Figure 14: North America Pathology Devices Industry Volume Share (%), by End-User 2025 & 2033
- Figure 15: North America Pathology Devices Industry Revenue (Million), by Country 2025 & 2033
- Figure 16: North America Pathology Devices Industry Volume (K Units), by Country 2025 & 2033
- Figure 17: North America Pathology Devices Industry Revenue Share (%), by Country 2025 & 2033
- Figure 18: North America Pathology Devices Industry Volume Share (%), by Country 2025 & 2033
- Figure 19: Europe Pathology Devices Industry Revenue (Million), by Technology 2025 & 2033
- Figure 20: Europe Pathology Devices Industry Volume (K Units), by Technology 2025 & 2033
- Figure 21: Europe Pathology Devices Industry Revenue Share (%), by Technology 2025 & 2033
- Figure 22: Europe Pathology Devices Industry Volume Share (%), by Technology 2025 & 2033
- Figure 23: Europe Pathology Devices Industry Revenue (Million), by Application 2025 & 2033
- Figure 24: Europe Pathology Devices Industry Volume (K Units), by Application 2025 & 2033
- Figure 25: Europe Pathology Devices Industry Revenue Share (%), by Application 2025 & 2033
- Figure 26: Europe Pathology Devices Industry Volume Share (%), by Application 2025 & 2033
- Figure 27: Europe Pathology Devices Industry Revenue (Million), by End-User 2025 & 2033
- Figure 28: Europe Pathology Devices Industry Volume (K Units), by End-User 2025 & 2033
- Figure 29: Europe Pathology Devices Industry Revenue Share (%), by End-User 2025 & 2033
- Figure 30: Europe Pathology Devices Industry Volume Share (%), by End-User 2025 & 2033
- Figure 31: Europe Pathology Devices Industry Revenue (Million), by Country 2025 & 2033
- Figure 32: Europe Pathology Devices Industry Volume (K Units), by Country 2025 & 2033
- Figure 33: Europe Pathology Devices Industry Revenue Share (%), by Country 2025 & 2033
- Figure 34: Europe Pathology Devices Industry Volume Share (%), by Country 2025 & 2033
- Figure 35: Asia Pacific Pathology Devices Industry Revenue (Million), by Technology 2025 & 2033
- Figure 36: Asia Pacific Pathology Devices Industry Volume (K Units), by Technology 2025 & 2033
- Figure 37: Asia Pacific Pathology Devices Industry Revenue Share (%), by Technology 2025 & 2033
- Figure 38: Asia Pacific Pathology Devices Industry Volume Share (%), by Technology 2025 & 2033
- Figure 39: Asia Pacific Pathology Devices Industry Revenue (Million), by Application 2025 & 2033
- Figure 40: Asia Pacific Pathology Devices Industry Volume (K Units), by Application 2025 & 2033
- Figure 41: Asia Pacific Pathology Devices Industry Revenue Share (%), by Application 2025 & 2033
- Figure 42: Asia Pacific Pathology Devices Industry Volume Share (%), by Application 2025 & 2033
- Figure 43: Asia Pacific Pathology Devices Industry Revenue (Million), by End-User 2025 & 2033
- Figure 44: Asia Pacific Pathology Devices Industry Volume (K Units), by End-User 2025 & 2033
- Figure 45: Asia Pacific Pathology Devices Industry Revenue Share (%), by End-User 2025 & 2033
- Figure 46: Asia Pacific Pathology Devices Industry Volume Share (%), by End-User 2025 & 2033
- Figure 47: Asia Pacific Pathology Devices Industry Revenue (Million), by Country 2025 & 2033
- Figure 48: Asia Pacific Pathology Devices Industry Volume (K Units), by Country 2025 & 2033
- Figure 49: Asia Pacific Pathology Devices Industry Revenue Share (%), by Country 2025 & 2033
- Figure 50: Asia Pacific Pathology Devices Industry Volume Share (%), by Country 2025 & 2033
- Figure 51: Middle East and Africa Pathology Devices Industry Revenue (Million), by Technology 2025 & 2033
- Figure 52: Middle East and Africa Pathology Devices Industry Volume (K Units), by Technology 2025 & 2033
- Figure 53: Middle East and Africa Pathology Devices Industry Revenue Share (%), by Technology 2025 & 2033
- Figure 54: Middle East and Africa Pathology Devices Industry Volume Share (%), by Technology 2025 & 2033
- Figure 55: Middle East and Africa Pathology Devices Industry Revenue (Million), by Application 2025 & 2033
- Figure 56: Middle East and Africa Pathology Devices Industry Volume (K Units), by Application 2025 & 2033
- Figure 57: Middle East and Africa Pathology Devices Industry Revenue Share (%), by Application 2025 & 2033
- Figure 58: Middle East and Africa Pathology Devices Industry Volume Share (%), by Application 2025 & 2033
- Figure 59: Middle East and Africa Pathology Devices Industry Revenue (Million), by End-User 2025 & 2033
- Figure 60: Middle East and Africa Pathology Devices Industry Volume (K Units), by End-User 2025 & 2033
- Figure 61: Middle East and Africa Pathology Devices Industry Revenue Share (%), by End-User 2025 & 2033
- Figure 62: Middle East and Africa Pathology Devices Industry Volume Share (%), by End-User 2025 & 2033
- Figure 63: Middle East and Africa Pathology Devices Industry Revenue (Million), by Country 2025 & 2033
- Figure 64: Middle East and Africa Pathology Devices Industry Volume (K Units), by Country 2025 & 2033
- Figure 65: Middle East and Africa Pathology Devices Industry Revenue Share (%), by Country 2025 & 2033
- Figure 66: Middle East and Africa Pathology Devices Industry Volume Share (%), by Country 2025 & 2033
- Figure 67: South America Pathology Devices Industry Revenue (Million), by Technology 2025 & 2033
- Figure 68: South America Pathology Devices Industry Volume (K Units), by Technology 2025 & 2033
- Figure 69: South America Pathology Devices Industry Revenue Share (%), by Technology 2025 & 2033
- Figure 70: South America Pathology Devices Industry Volume Share (%), by Technology 2025 & 2033
- Figure 71: South America Pathology Devices Industry Revenue (Million), by Application 2025 & 2033
- Figure 72: South America Pathology Devices Industry Volume (K Units), by Application 2025 & 2033
- Figure 73: South America Pathology Devices Industry Revenue Share (%), by Application 2025 & 2033
- Figure 74: South America Pathology Devices Industry Volume Share (%), by Application 2025 & 2033
- Figure 75: South America Pathology Devices Industry Revenue (Million), by End-User 2025 & 2033
- Figure 76: South America Pathology Devices Industry Volume (K Units), by End-User 2025 & 2033
- Figure 77: South America Pathology Devices Industry Revenue Share (%), by End-User 2025 & 2033
- Figure 78: South America Pathology Devices Industry Volume Share (%), by End-User 2025 & 2033
- Figure 79: South America Pathology Devices Industry Revenue (Million), by Country 2025 & 2033
- Figure 80: South America Pathology Devices Industry Volume (K Units), by Country 2025 & 2033
- Figure 81: South America Pathology Devices Industry Revenue Share (%), by Country 2025 & 2033
- Figure 82: South America Pathology Devices Industry Volume Share (%), by Country 2025 & 2033
List of Tables
- Table 1: Global Pathology Devices Industry Revenue Million Forecast, by Technology 2020 & 2033
- Table 2: Global Pathology Devices Industry Volume K Units Forecast, by Technology 2020 & 2033
- Table 3: Global Pathology Devices Industry Revenue Million Forecast, by Application 2020 & 2033
- Table 4: Global Pathology Devices Industry Volume K Units Forecast, by Application 2020 & 2033
- Table 5: Global Pathology Devices Industry Revenue Million Forecast, by End-User 2020 & 2033
- Table 6: Global Pathology Devices Industry Volume K Units Forecast, by End-User 2020 & 2033
- Table 7: Global Pathology Devices Industry Revenue Million Forecast, by Region 2020 & 2033
- Table 8: Global Pathology Devices Industry Volume K Units Forecast, by Region 2020 & 2033
- Table 9: Global Pathology Devices Industry Revenue Million Forecast, by Technology 2020 & 2033
- Table 10: Global Pathology Devices Industry Volume K Units Forecast, by Technology 2020 & 2033
- Table 11: Global Pathology Devices Industry Revenue Million Forecast, by Application 2020 & 2033
- Table 12: Global Pathology Devices Industry Volume K Units Forecast, by Application 2020 & 2033
- Table 13: Global Pathology Devices Industry Revenue Million Forecast, by End-User 2020 & 2033
- Table 14: Global Pathology Devices Industry Volume K Units Forecast, by End-User 2020 & 2033
- Table 15: Global Pathology Devices Industry Revenue Million Forecast, by Country 2020 & 2033
- Table 16: Global Pathology Devices Industry Volume K Units Forecast, by Country 2020 & 2033
- Table 17: United States Pathology Devices Industry Revenue (Million) Forecast, by Application 2020 & 2033
- Table 18: United States Pathology Devices Industry Volume (K Units) Forecast, by Application 2020 & 2033
- Table 19: Canada Pathology Devices Industry Revenue (Million) Forecast, by Application 2020 & 2033
- Table 20: Canada Pathology Devices Industry Volume (K Units) Forecast, by Application 2020 & 2033
- Table 21: Mexico Pathology Devices Industry Revenue (Million) Forecast, by Application 2020 & 2033
- Table 22: Mexico Pathology Devices Industry Volume (K Units) Forecast, by Application 2020 & 2033
- Table 23: Global Pathology Devices Industry Revenue Million Forecast, by Technology 2020 & 2033
- Table 24: Global Pathology Devices Industry Volume K Units Forecast, by Technology 2020 & 2033
- Table 25: Global Pathology Devices Industry Revenue Million Forecast, by Application 2020 & 2033
- Table 26: Global Pathology Devices Industry Volume K Units Forecast, by Application 2020 & 2033
- Table 27: Global Pathology Devices Industry Revenue Million Forecast, by End-User 2020 & 2033
- Table 28: Global Pathology Devices Industry Volume K Units Forecast, by End-User 2020 & 2033
- Table 29: Global Pathology Devices Industry Revenue Million Forecast, by Country 2020 & 2033
- Table 30: Global Pathology Devices Industry Volume K Units Forecast, by Country 2020 & 2033
- Table 31: Germany Pathology Devices Industry Revenue (Million) Forecast, by Application 2020 & 2033
- Table 32: Germany Pathology Devices Industry Volume (K Units) Forecast, by Application 2020 & 2033
- Table 33: United Kingdom Pathology Devices Industry Revenue (Million) Forecast, by Application 2020 & 2033
- Table 34: United Kingdom Pathology Devices Industry Volume (K Units) Forecast, by Application 2020 & 2033
- Table 35: France Pathology Devices Industry Revenue (Million) Forecast, by Application 2020 & 2033
- Table 36: France Pathology Devices Industry Volume (K Units) Forecast, by Application 2020 & 2033
- Table 37: Italy Pathology Devices Industry Revenue (Million) Forecast, by Application 2020 & 2033
- Table 38: Italy Pathology Devices Industry Volume (K Units) Forecast, by Application 2020 & 2033
- Table 39: Spain Pathology Devices Industry Revenue (Million) Forecast, by Application 2020 & 2033
- Table 40: Spain Pathology Devices Industry Volume (K Units) Forecast, by Application 2020 & 2033
- Table 41: Rest of Europe Pathology Devices Industry Revenue (Million) Forecast, by Application 2020 & 2033
- Table 42: Rest of Europe Pathology Devices Industry Volume (K Units) Forecast, by Application 2020 & 2033
- Table 43: Global Pathology Devices Industry Revenue Million Forecast, by Technology 2020 & 2033
- Table 44: Global Pathology Devices Industry Volume K Units Forecast, by Technology 2020 & 2033
- Table 45: Global Pathology Devices Industry Revenue Million Forecast, by Application 2020 & 2033
- Table 46: Global Pathology Devices Industry Volume K Units Forecast, by Application 2020 & 2033
- Table 47: Global Pathology Devices Industry Revenue Million Forecast, by End-User 2020 & 2033
- Table 48: Global Pathology Devices Industry Volume K Units Forecast, by End-User 2020 & 2033
- Table 49: Global Pathology Devices Industry Revenue Million Forecast, by Country 2020 & 2033
- Table 50: Global Pathology Devices Industry Volume K Units Forecast, by Country 2020 & 2033
- Table 51: China Pathology Devices Industry Revenue (Million) Forecast, by Application 2020 & 2033
- Table 52: China Pathology Devices Industry Volume (K Units) Forecast, by Application 2020 & 2033
- Table 53: Japan Pathology Devices Industry Revenue (Million) Forecast, by Application 2020 & 2033
- Table 54: Japan Pathology Devices Industry Volume (K Units) Forecast, by Application 2020 & 2033
- Table 55: India Pathology Devices Industry Revenue (Million) Forecast, by Application 2020 & 2033
- Table 56: India Pathology Devices Industry Volume (K Units) Forecast, by Application 2020 & 2033
- Table 57: Australia Pathology Devices Industry Revenue (Million) Forecast, by Application 2020 & 2033
- Table 58: Australia Pathology Devices Industry Volume (K Units) Forecast, by Application 2020 & 2033
- Table 59: South Korea Pathology Devices Industry Revenue (Million) Forecast, by Application 2020 & 2033
- Table 60: South Korea Pathology Devices Industry Volume (K Units) Forecast, by Application 2020 & 2033
- Table 61: Rest of Asia Pacific Pathology Devices Industry Revenue (Million) Forecast, by Application 2020 & 2033
- Table 62: Rest of Asia Pacific Pathology Devices Industry Volume (K Units) Forecast, by Application 2020 & 2033
- Table 63: Global Pathology Devices Industry Revenue Million Forecast, by Technology 2020 & 2033
- Table 64: Global Pathology Devices Industry Volume K Units Forecast, by Technology 2020 & 2033
- Table 65: Global Pathology Devices Industry Revenue Million Forecast, by Application 2020 & 2033
- Table 66: Global Pathology Devices Industry Volume K Units Forecast, by Application 2020 & 2033
- Table 67: Global Pathology Devices Industry Revenue Million Forecast, by End-User 2020 & 2033
- Table 68: Global Pathology Devices Industry Volume K Units Forecast, by End-User 2020 & 2033
- Table 69: Global Pathology Devices Industry Revenue Million Forecast, by Country 2020 & 2033
- Table 70: Global Pathology Devices Industry Volume K Units Forecast, by Country 2020 & 2033
- Table 71: GCC Pathology Devices Industry Revenue (Million) Forecast, by Application 2020 & 2033
- Table 72: GCC Pathology Devices Industry Volume (K Units) Forecast, by Application 2020 & 2033
- Table 73: South Africa Pathology Devices Industry Revenue (Million) Forecast, by Application 2020 & 2033
- Table 74: South Africa Pathology Devices Industry Volume (K Units) Forecast, by Application 2020 & 2033
- Table 75: Rest of Middle East and Africa Pathology Devices Industry Revenue (Million) Forecast, by Application 2020 & 2033
- Table 76: Rest of Middle East and Africa Pathology Devices Industry Volume (K Units) Forecast, by Application 2020 & 2033
- Table 77: Global Pathology Devices Industry Revenue Million Forecast, by Technology 2020 & 2033
- Table 78: Global Pathology Devices Industry Volume K Units Forecast, by Technology 2020 & 2033
- Table 79: Global Pathology Devices Industry Revenue Million Forecast, by Application 2020 & 2033
- Table 80: Global Pathology Devices Industry Volume K Units Forecast, by Application 2020 & 2033
- Table 81: Global Pathology Devices Industry Revenue Million Forecast, by End-User 2020 & 2033
- Table 82: Global Pathology Devices Industry Volume K Units Forecast, by End-User 2020 & 2033
- Table 83: Global Pathology Devices Industry Revenue Million Forecast, by Country 2020 & 2033
- Table 84: Global Pathology Devices Industry Volume K Units Forecast, by Country 2020 & 2033
- Table 85: Brazil Pathology Devices Industry Revenue (Million) Forecast, by Application 2020 & 2033
- Table 86: Brazil Pathology Devices Industry Volume (K Units) Forecast, by Application 2020 & 2033
- Table 87: Argentina Pathology Devices Industry Revenue (Million) Forecast, by Application 2020 & 2033
- Table 88: Argentina Pathology Devices Industry Volume (K Units) Forecast, by Application 2020 & 2033
- Table 89: Rest of South America Pathology Devices Industry Revenue (Million) Forecast, by Application 2020 & 2033
- Table 90: Rest of South America Pathology Devices Industry Volume (K Units) Forecast, by Application 2020 & 2033
Frequently Asked Questions
1. What is the projected Compound Annual Growth Rate (CAGR) of the Pathology Devices Industry?
The projected CAGR is approximately 6.12%.
2. Which companies are prominent players in the Pathology Devices Industry?
Key companies in the market include Becton Dickinson and Company, Beckman Coulter Inc, Ortho-Clinical Diagnostics, Abbott Laboratories, Danaher Corporation, Hamamatsu Photonics, F Hoffmann-La Roche AG, Mikroscan Technologies, Bio-Rad Laboratories, Siemens Healthineers, Thermo Fisher Scientific, Definiens.
3. What are the main segments of the Pathology Devices Industry?
The market segments include Technology, Application, End-User.
4. Can you provide details about the market size?
The market size is estimated to be USD 6.18 Million as of 2022.
5. What are some drivers contributing to market growth?
Increasing Prevalence of Chronic and Infectious Diseases; Technological Advancements in Pathology Devices; Increasing Investment in Healthcare Infrastructure in Developing Countries.
6. What are the notable trends driving market growth?
Molecular Diagnostics Segment is Expected to Hold Significant Market Share Over the Forecast Period.
7. Are there any restraints impacting market growth?
High Cost of Devices; Stringent Regulations and Lack of Skilled Professionals.
8. Can you provide examples of recent developments in the market?
September 2022: Sysmex Corporation launched UF-1500 fully automated urine particle analyzer (UF-1500), a new product for use in urine sediment testing. This launch assists the company in expanding its product lineup and delivering a wide range of solutions to customers.
9. What pricing options are available for accessing the report?
Pricing options include single-user, multi-user, and enterprise licenses priced at USD 4750, USD 5250, and USD 8750 respectively.
10. Is the market size provided in terms of value or volume?
The market size is provided in terms of value, measured in Million and volume, measured in K Units.
11. Are there any specific market keywords associated with the report?
Yes, the market keyword associated with the report is "Pathology Devices Industry," which aids in identifying and referencing the specific market segment covered.
12. How do I determine which pricing option suits my needs best?
The pricing options vary based on user requirements and access needs. Individual users may opt for single-user licenses, while businesses requiring broader access may choose multi-user or enterprise licenses for cost-effective access to the report.
13. Are there any additional resources or data provided in the Pathology Devices Industry report?
While the report offers comprehensive insights, it's advisable to review the specific contents or supplementary materials provided to ascertain if additional resources or data are available.
14. How can I stay updated on further developments or reports in the Pathology Devices Industry?
To stay informed about further developments, trends, and reports in the Pathology Devices Industry, consider subscribing to industry newsletters, following relevant companies and organizations, or regularly checking reputable industry news sources and publications.
Methodology
Step 1 - Identification of Relevant Samples Size from Population Database


Step 2 - Approaches for Defining Global Market Size (Value, Volume* & Price*)

Note*: In applicable scenarios
Step 3 - Data Sources
Primary Research
- Web Analytics
- Survey Reports
- Research Institute
- Latest Research Reports
- Opinion Leaders
Secondary Research
- Annual Reports
- White Paper
- Latest Press Release
- Industry Association
- Paid Database
- Investor Presentations

Step 4 - Data Triangulation
Involves using different sources of information in order to increase the validity of a study
These sources are likely to be stakeholders in a program - participants, other researchers, program staff, other community members, and so on.
Then we put all data in single framework & apply various statistical tools to find out the dynamic on the market.
During the analysis stage, feedback from the stakeholder groups would be compared to determine areas of agreement as well as areas of divergence