

Key Insights
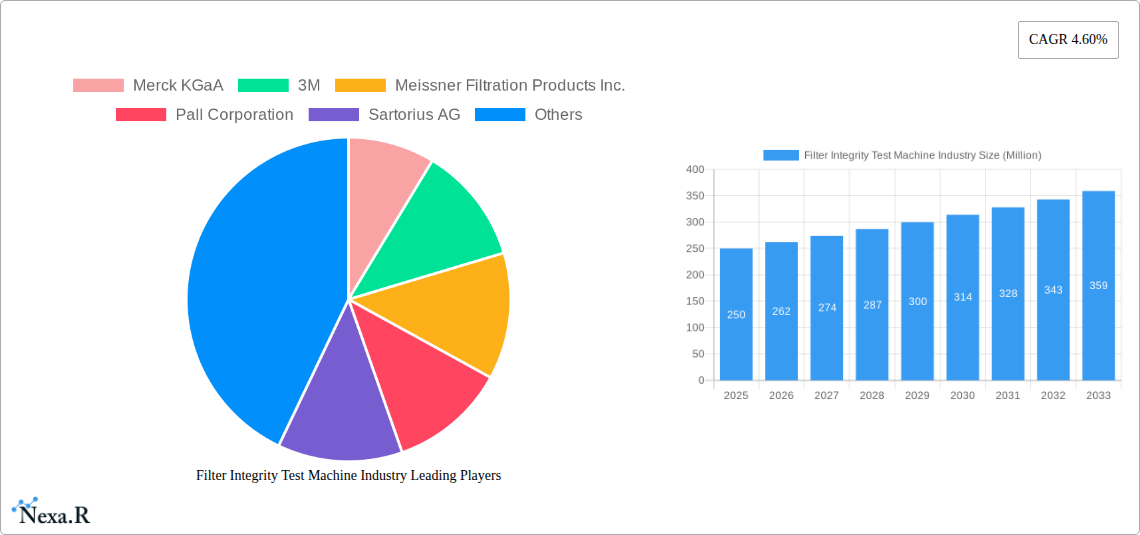
The Filter Integrity Test Machine market, valued at approximately $XX million in 2025, is projected to experience robust growth, exhibiting a Compound Annual Growth Rate (CAGR) of 4.60% from 2025 to 2033. This expansion is fueled by several key drivers. The increasing demand for high-quality filtration across diverse industries, including pharmaceuticals, biotechnology, and food & beverage, is a primary catalyst. Stringent regulatory requirements regarding product purity and safety are further propelling market growth. Advancements in filter technology, such as the development of more sophisticated and efficient filter integrity testing methods (diffusion, bubble point, and pressure tests), are also contributing factors. The market is segmented by application (air filters, liquid filters), product type (manual, automated), and test type, offering diverse opportunities for market players. The automated segment is expected to witness faster growth due to its increased efficiency and reduced manual error. Geographically, North America and Europe currently hold significant market shares due to established industries and stringent regulatory frameworks. However, the Asia-Pacific region is poised for rapid growth, driven by increasing industrialization and rising healthcare expenditure. While the market faces restraints such as the high initial investment cost of advanced testing machines, the long-term benefits in terms of quality control and regulatory compliance outweigh these challenges.
The competitive landscape is marked by the presence of several prominent players, including Merck KGaA, 3M, Meissner Filtration Products Inc., Pall Corporation, Sartorius AG, Eaton Corporation PLC, Filter Integrity Ltd., Parker Hannifin Corp., ThermoFisher Scientific, and Donaldson Company. These companies are continuously striving to enhance their product portfolios through innovation and strategic acquisitions to maintain their competitive edge. Future growth will likely be shaped by technological advancements in filter integrity testing techniques, increasing demand for automated solutions, and the expansion of the market into emerging economies. The continued emphasis on quality assurance across various industries will further solidify the market's positive outlook. The strategic partnerships and collaborations among key players will also influence the market's trajectory in the coming years.
Filter Integrity Test Machine Industry Market Report: 2019-2033
This comprehensive report provides a detailed analysis of the Filter Integrity Test Machine industry, encompassing market dynamics, growth trends, regional segmentation, product landscape, key players, and future outlook. The report covers the parent market of filtration equipment and the child market of filter integrity testing, offering invaluable insights for industry professionals, investors, and stakeholders. The study period spans from 2019 to 2033, with a base year of 2025 and a forecast period from 2025 to 2033. The market size is presented in Million units.
Filter Integrity Test Machine Industry Market Dynamics & Structure
The Filter Integrity Test Machine market is characterized by moderate concentration, with key players holding significant market share. Technological innovation, particularly in automation and advanced testing methods, is a primary growth driver. Stringent regulatory frameworks, particularly within pharmaceutical and healthcare sectors, heavily influence market dynamics. Competitive pressure stems from substitutes such as traditional testing methods, but the demand for accurate, efficient, and validated testing increasingly favors automated solutions. The end-user demographics are diverse, spanning pharmaceutical, biotechnology, food & beverage, and water treatment industries. M&A activity has been moderate, with strategic acquisitions aimed at enhancing technological capabilities and expanding market reach.
- Market Concentration: Moderately Concentrated (xx%)
- Technological Innovation Drivers: Automation, AI-driven analysis, miniaturization.
- Regulatory Frameworks: GMP compliance (Pharmaceutical), FDA regulations (USA).
- Competitive Product Substitutes: Traditional manual testing methods.
- End-User Demographics: Pharmaceutical (xx%), Biotechnology (xx%), Food & Beverage (xx%), Water Treatment (xx%).
- M&A Deal Volume (2019-2024): xx deals
Filter Integrity Test Machine Industry Growth Trends & Insights
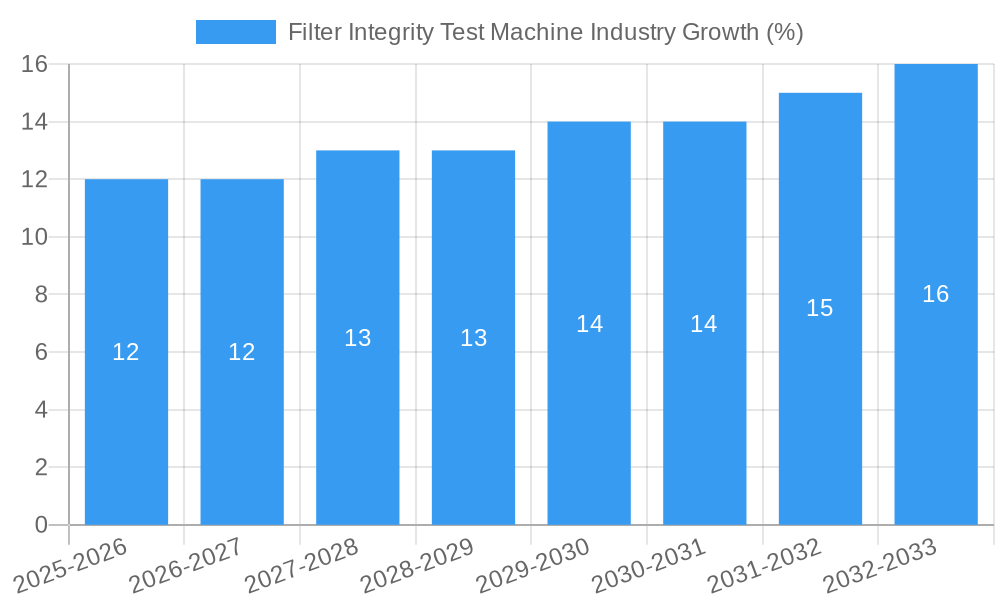
The Filter Integrity Test Machine market experienced steady growth during the historical period (2019-2024), driven by increasing demand for higher quality control and stringent regulatory compliance. The market size is estimated at xx Million units in 2025, with a projected CAGR of xx% during the forecast period (2025-2033). This growth is fuelled by the adoption of automated systems, advancements in testing technologies, and expanding applications across various industries. The market penetration of automated filter integrity testers is increasing, replacing traditional manual methods. Consumer behavior shifts toward greater emphasis on product safety and quality are driving market expansion. Technological disruptions, particularly the integration of AI and advanced data analytics, will further propel market growth in the coming years.
Dominant Regions, Countries, or Segments in Filter Integrity Test Machine Industry
The North American region currently holds the largest market share in the Filter Integrity Test Machine industry, driven by strong regulatory compliance mandates and significant investments in pharmaceutical and biotech sectors. Europe follows as a significant market, with a robust pharmaceutical industry and stringent quality standards. Within applications, Liquid Filters command the highest market share, owing to their widespread use in pharmaceutical manufacturing and water treatment. Automated Product Types are experiencing the fastest growth rate, reflecting the industry's increasing emphasis on efficiency and accuracy. The Bubble Point Test remains a dominant testing type, but the demand for diffusion and pressure testing is growing steadily.
- Key Drivers (North America): Stringent regulations, high pharmaceutical R&D spending, advanced technologies.
- Key Drivers (Europe): Stringent EU regulations, established pharmaceutical industry.
- Key Drivers (Asia-Pacific): Emerging economies, rising pharmaceutical manufacturing, increased healthcare spending.
- Dominant Application Segment: Liquid Filters (xx%)
- Fastest Growing Product Type: Automated (xx% CAGR)
- Dominant Test Type: Bubble Point Test (xx%)
Filter Integrity Test Machine Industry Product Landscape
The Filter Integrity Test Machine market offers a diverse range of products, encompassing manual and automated systems for various test types (Bubble Point, Diffusion, Pressure, and other specialized tests). Automated systems are characterized by enhanced speed, accuracy, and data management capabilities. Key features include integrated software for data analysis and reporting, simplified user interfaces, and compatibility with diverse filter types. Technological advancements are focused on improved sensitivity, reduced testing time, and enhanced data reliability. Unique selling propositions often include superior data integrity features, ease of use, and compliance with regulatory standards.
Key Drivers, Barriers & Challenges in Filter Integrity Test Machine Industry
Key Drivers:
- Increasing demand for efficient and accurate filter testing.
- Stringent regulatory compliance requirements in various industries.
- Growing adoption of automated testing systems for improved productivity.
Challenges & Restraints:
- High initial investment costs for advanced testing equipment.
- Complexity of implementing and validating new technologies.
- Competition from established players and emerging market entrants.
- Supply chain disruptions impacting the availability of components.
Emerging Opportunities in Filter Integrity Test Machine Industry
Emerging opportunities include the expansion into untapped markets such as emerging economies with growing pharmaceutical industries. Innovative applications in areas like nanofiltration and biopharmaceutical manufacturing are also creating new demand. Evolving consumer preferences towards superior product quality and safety standards drive the adoption of advanced filter integrity testing methods. The development of integrated solutions that combine multiple testing functionalities offers significant potential for market expansion.
Growth Accelerators in the Filter Integrity Test Machine Industry
Technological breakthroughs, specifically in areas of automation and AI-driven analysis, are significant growth accelerators. Strategic partnerships between equipment manufacturers and filter suppliers further fuel market expansion. Market expansion strategies focusing on emerging economies and underserved applications create long-term growth potential. The development of advanced software solutions for data management and analysis enhance the value proposition of Filter Integrity Test Machines.
Key Players Shaping the Filter Integrity Test Machine Market
- Merck KGaA
- 3M
- Meissner Filtration Products Inc.
- Pall Corporation
- Sartorius AG
- Eaton Corporation PLC
- Filter Integrity Ltd.
- Parker Hannifin Corp.
- ThermoFisher Scientific
- Donaldson Company
Notable Milestones in Filter Integrity Test Machine Industry Sector
- July 2022: Syntegon launches Versynta FFP, featuring integrated automated HEPA filter scans, improving filter integrity test reliability and speed.
- December 2021: Pall Corporation and Express Pharma introduce Palltronic Flowstar V filter integrity test instrument in India, addressing GMP manufacturing demands.
In-Depth Filter Integrity Test Machine Industry Market Outlook
The Filter Integrity Test Machine market is poised for robust growth over the forecast period, driven by sustained demand for advanced testing technologies, expanding applications, and increasing regulatory pressure. Strategic opportunities exist in developing innovative testing solutions tailored to specific industry needs, forging strategic partnerships to expand market reach, and focusing on emerging economies with high growth potential. The continued focus on automation, data analytics, and improved ease-of-use will be key differentiators for success in this competitive yet expanding market.
Filter Integrity Test Machine Industry Segmentation
-
1. Product Type
- 1.1. Manual
- 1.2. Automated
-
2. Test Type
- 2.1. Diffusion Test
- 2.2. Bubble Point Test
- 2.3. Pressure Test
- 2.4. Other Test Types
-
3. Application
- 3.1. Air Filters
- 3.2. Liquid Filters
Filter Integrity Test Machine Industry Segmentation By Geography
-
1. North America
- 1.1. United States
- 1.2. Canada
- 1.3. Mexico
-
2. Europe
- 2.1. Germany
- 2.2. United Kingdom
- 2.3. France
- 2.4. Italy
- 2.5. Spain
- 2.6. Rest of Europe
-
3. Asia Pacific
- 3.1. China
- 3.2. Japan
- 3.3. India
- 3.4. Australia
- 3.5. South Korea
- 3.6. Rest of Asia Pacific
-
4. Middle East and Africa
- 4.1. GCC
- 4.2. South Africa
- 4.3. Rest of Middle East and Africa
-
5. South America
- 5.1. Brazil
- 5.2. Argentina
- 5.3. Rest of South America

Filter Integrity Test Machine Industry REPORT HIGHLIGHTS
| Aspects | Details |
|---|---|
| Study Period | 2019-2033 |
| Base Year | 2024 |
| Estimated Year | 2025 |
| Forecast Period | 2025-2033 |
| Historical Period | 2019-2024 |
| Growth Rate | CAGR of 4.60% from 2019-2033 |
| Segmentation |
|
Table of Contents
- 1. Introduction
- 1.1. Research Scope
- 1.2. Market Segmentation
- 1.3. Research Methodology
- 1.4. Definitions and Assumptions
- 2. Executive Summary
- 2.1. Introduction
- 3. Market Dynamics
- 3.1. Introduction
- 3.2. Market Drivers
- 3.2.1. Increasing Demand for Biopharmaceuticals; Higher Spending in R&D Activities
- 3.3. Market Restrains
- 3.3.1. High Cost of Testing
- 3.4. Market Trends
- 3.4.1. Automated Segment is Expected to Witness Growth Over the Forecast Period
- 4. Market Factor Analysis
- 4.1. Porters Five Forces
- 4.2. Supply/Value Chain
- 4.3. PESTEL analysis
- 4.4. Market Entropy
- 4.5. Patent/Trademark Analysis
- 5. Global Filter Integrity Test Machine Industry Analysis, Insights and Forecast, 2019-2031
- 5.1. Market Analysis, Insights and Forecast - by Product Type
- 5.1.1. Manual
- 5.1.2. Automated
- 5.2. Market Analysis, Insights and Forecast - by Test Type
- 5.2.1. Diffusion Test
- 5.2.2. Bubble Point Test
- 5.2.3. Pressure Test
- 5.2.4. Other Test Types
- 5.3. Market Analysis, Insights and Forecast - by Application
- 5.3.1. Air Filters
- 5.3.2. Liquid Filters
- 5.4. Market Analysis, Insights and Forecast - by Region
- 5.4.1. North America
- 5.4.2. Europe
- 5.4.3. Asia Pacific
- 5.4.4. Middle East and Africa
- 5.4.5. South America
- 5.1. Market Analysis, Insights and Forecast - by Product Type
- 6. North America Filter Integrity Test Machine Industry Analysis, Insights and Forecast, 2019-2031
- 6.1. Market Analysis, Insights and Forecast - by Product Type
- 6.1.1. Manual
- 6.1.2. Automated
- 6.2. Market Analysis, Insights and Forecast - by Test Type
- 6.2.1. Diffusion Test
- 6.2.2. Bubble Point Test
- 6.2.3. Pressure Test
- 6.2.4. Other Test Types
- 6.3. Market Analysis, Insights and Forecast - by Application
- 6.3.1. Air Filters
- 6.3.2. Liquid Filters
- 6.1. Market Analysis, Insights and Forecast - by Product Type
- 7. Europe Filter Integrity Test Machine Industry Analysis, Insights and Forecast, 2019-2031
- 7.1. Market Analysis, Insights and Forecast - by Product Type
- 7.1.1. Manual
- 7.1.2. Automated
- 7.2. Market Analysis, Insights and Forecast - by Test Type
- 7.2.1. Diffusion Test
- 7.2.2. Bubble Point Test
- 7.2.3. Pressure Test
- 7.2.4. Other Test Types
- 7.3. Market Analysis, Insights and Forecast - by Application
- 7.3.1. Air Filters
- 7.3.2. Liquid Filters
- 7.1. Market Analysis, Insights and Forecast - by Product Type
- 8. Asia Pacific Filter Integrity Test Machine Industry Analysis, Insights and Forecast, 2019-2031
- 8.1. Market Analysis, Insights and Forecast - by Product Type
- 8.1.1. Manual
- 8.1.2. Automated
- 8.2. Market Analysis, Insights and Forecast - by Test Type
- 8.2.1. Diffusion Test
- 8.2.2. Bubble Point Test
- 8.2.3. Pressure Test
- 8.2.4. Other Test Types
- 8.3. Market Analysis, Insights and Forecast - by Application
- 8.3.1. Air Filters
- 8.3.2. Liquid Filters
- 8.1. Market Analysis, Insights and Forecast - by Product Type
- 9. Middle East and Africa Filter Integrity Test Machine Industry Analysis, Insights and Forecast, 2019-2031
- 9.1. Market Analysis, Insights and Forecast - by Product Type
- 9.1.1. Manual
- 9.1.2. Automated
- 9.2. Market Analysis, Insights and Forecast - by Test Type
- 9.2.1. Diffusion Test
- 9.2.2. Bubble Point Test
- 9.2.3. Pressure Test
- 9.2.4. Other Test Types
- 9.3. Market Analysis, Insights and Forecast - by Application
- 9.3.1. Air Filters
- 9.3.2. Liquid Filters
- 9.1. Market Analysis, Insights and Forecast - by Product Type
- 10. South America Filter Integrity Test Machine Industry Analysis, Insights and Forecast, 2019-2031
- 10.1. Market Analysis, Insights and Forecast - by Product Type
- 10.1.1. Manual
- 10.1.2. Automated
- 10.2. Market Analysis, Insights and Forecast - by Test Type
- 10.2.1. Diffusion Test
- 10.2.2. Bubble Point Test
- 10.2.3. Pressure Test
- 10.2.4. Other Test Types
- 10.3. Market Analysis, Insights and Forecast - by Application
- 10.3.1. Air Filters
- 10.3.2. Liquid Filters
- 10.1. Market Analysis, Insights and Forecast - by Product Type
- 11. North Americ Filter Integrity Test Machine Industry Analysis, Insights and Forecast, 2019-2031
- 11.1. Market Analysis, Insights and Forecast - By Country/Sub-region
- 11.1.1 United States
- 11.1.2 Canada
- 11.1.3 Mexico
- 12. South America Filter Integrity Test Machine Industry Analysis, Insights and Forecast, 2019-2031
- 12.1. Market Analysis, Insights and Forecast - By Country/Sub-region
- 12.1.1 Brazil
- 12.1.2 Mexico
- 12.1.3 Rest of South America
- 13. Europe Filter Integrity Test Machine Industry Analysis, Insights and Forecast, 2019-2031
- 13.1. Market Analysis, Insights and Forecast - By Country/Sub-region
- 13.1.1 Germany
- 13.1.2 United Kingdom
- 13.1.3 France
- 13.1.4 Italy
- 13.1.5 Spain
- 13.1.6 Rest of Europe
- 14. Asia Pacific Filter Integrity Test Machine Industry Analysis, Insights and Forecast, 2019-2031
- 14.1. Market Analysis, Insights and Forecast - By Country/Sub-region
- 14.1.1 China
- 14.1.2 Japan
- 14.1.3 India
- 14.1.4 South Korea
- 14.1.5 Taiwan
- 14.1.6 Australia
- 14.1.7 Rest of Asia-Pacific
- 15. MEA Filter Integrity Test Machine Industry Analysis, Insights and Forecast, 2019-2031
- 15.1. Market Analysis, Insights and Forecast - By Country/Sub-region
- 15.1.1 Middle East
- 15.1.2 Africa
- 16. Competitive Analysis
- 16.1. Global Market Share Analysis 2024
- 16.2. Company Profiles
- 16.2.1 Merck KGaA
- 16.2.1.1. Overview
- 16.2.1.2. Products
- 16.2.1.3. SWOT Analysis
- 16.2.1.4. Recent Developments
- 16.2.1.5. Financials (Based on Availability)
- 16.2.2 3M
- 16.2.2.1. Overview
- 16.2.2.2. Products
- 16.2.2.3. SWOT Analysis
- 16.2.2.4. Recent Developments
- 16.2.2.5. Financials (Based on Availability)
- 16.2.3 Meissner Filtration Products Inc.
- 16.2.3.1. Overview
- 16.2.3.2. Products
- 16.2.3.3. SWOT Analysis
- 16.2.3.4. Recent Developments
- 16.2.3.5. Financials (Based on Availability)
- 16.2.4 Pall Corporation
- 16.2.4.1. Overview
- 16.2.4.2. Products
- 16.2.4.3. SWOT Analysis
- 16.2.4.4. Recent Developments
- 16.2.4.5. Financials (Based on Availability)
- 16.2.5 Sartorius AG
- 16.2.5.1. Overview
- 16.2.5.2. Products
- 16.2.5.3. SWOT Analysis
- 16.2.5.4. Recent Developments
- 16.2.5.5. Financials (Based on Availability)
- 16.2.6 Eaton Corporation PLC
- 16.2.6.1. Overview
- 16.2.6.2. Products
- 16.2.6.3. SWOT Analysis
- 16.2.6.4. Recent Developments
- 16.2.6.5. Financials (Based on Availability)
- 16.2.7 Filter Integrity Ltd.
- 16.2.7.1. Overview
- 16.2.7.2. Products
- 16.2.7.3. SWOT Analysis
- 16.2.7.4. Recent Developments
- 16.2.7.5. Financials (Based on Availability)
- 16.2.8 Parker Hannifin Corp.
- 16.2.8.1. Overview
- 16.2.8.2. Products
- 16.2.8.3. SWOT Analysis
- 16.2.8.4. Recent Developments
- 16.2.8.5. Financials (Based on Availability)
- 16.2.9 ThermoFisher Scientific
- 16.2.9.1. Overview
- 16.2.9.2. Products
- 16.2.9.3. SWOT Analysis
- 16.2.9.4. Recent Developments
- 16.2.9.5. Financials (Based on Availability)
- 16.2.10 Donaldson Company
- 16.2.10.1. Overview
- 16.2.10.2. Products
- 16.2.10.3. SWOT Analysis
- 16.2.10.4. Recent Developments
- 16.2.10.5. Financials (Based on Availability)
- 16.2.1 Merck KGaA
List of Figures
- Figure 1: Global Filter Integrity Test Machine Industry Revenue Breakdown (Million, %) by Region 2024 & 2032
- Figure 2: Global Filter Integrity Test Machine Industry Volume Breakdown (K Units, %) by Region 2024 & 2032
- Figure 3: North Americ Filter Integrity Test Machine Industry Revenue (Million), by Country 2024 & 2032
- Figure 4: North Americ Filter Integrity Test Machine Industry Volume (K Units), by Country 2024 & 2032
- Figure 5: North Americ Filter Integrity Test Machine Industry Revenue Share (%), by Country 2024 & 2032
- Figure 6: North Americ Filter Integrity Test Machine Industry Volume Share (%), by Country 2024 & 2032
- Figure 7: South America Filter Integrity Test Machine Industry Revenue (Million), by Country 2024 & 2032
- Figure 8: South America Filter Integrity Test Machine Industry Volume (K Units), by Country 2024 & 2032
- Figure 9: South America Filter Integrity Test Machine Industry Revenue Share (%), by Country 2024 & 2032
- Figure 10: South America Filter Integrity Test Machine Industry Volume Share (%), by Country 2024 & 2032
- Figure 11: Europe Filter Integrity Test Machine Industry Revenue (Million), by Country 2024 & 2032
- Figure 12: Europe Filter Integrity Test Machine Industry Volume (K Units), by Country 2024 & 2032
- Figure 13: Europe Filter Integrity Test Machine Industry Revenue Share (%), by Country 2024 & 2032
- Figure 14: Europe Filter Integrity Test Machine Industry Volume Share (%), by Country 2024 & 2032
- Figure 15: Asia Pacific Filter Integrity Test Machine Industry Revenue (Million), by Country 2024 & 2032
- Figure 16: Asia Pacific Filter Integrity Test Machine Industry Volume (K Units), by Country 2024 & 2032
- Figure 17: Asia Pacific Filter Integrity Test Machine Industry Revenue Share (%), by Country 2024 & 2032
- Figure 18: Asia Pacific Filter Integrity Test Machine Industry Volume Share (%), by Country 2024 & 2032
- Figure 19: MEA Filter Integrity Test Machine Industry Revenue (Million), by Country 2024 & 2032
- Figure 20: MEA Filter Integrity Test Machine Industry Volume (K Units), by Country 2024 & 2032
- Figure 21: MEA Filter Integrity Test Machine Industry Revenue Share (%), by Country 2024 & 2032
- Figure 22: MEA Filter Integrity Test Machine Industry Volume Share (%), by Country 2024 & 2032
- Figure 23: North America Filter Integrity Test Machine Industry Revenue (Million), by Product Type 2024 & 2032
- Figure 24: North America Filter Integrity Test Machine Industry Volume (K Units), by Product Type 2024 & 2032
- Figure 25: North America Filter Integrity Test Machine Industry Revenue Share (%), by Product Type 2024 & 2032
- Figure 26: North America Filter Integrity Test Machine Industry Volume Share (%), by Product Type 2024 & 2032
- Figure 27: North America Filter Integrity Test Machine Industry Revenue (Million), by Test Type 2024 & 2032
- Figure 28: North America Filter Integrity Test Machine Industry Volume (K Units), by Test Type 2024 & 2032
- Figure 29: North America Filter Integrity Test Machine Industry Revenue Share (%), by Test Type 2024 & 2032
- Figure 30: North America Filter Integrity Test Machine Industry Volume Share (%), by Test Type 2024 & 2032
- Figure 31: North America Filter Integrity Test Machine Industry Revenue (Million), by Application 2024 & 2032
- Figure 32: North America Filter Integrity Test Machine Industry Volume (K Units), by Application 2024 & 2032
- Figure 33: North America Filter Integrity Test Machine Industry Revenue Share (%), by Application 2024 & 2032
- Figure 34: North America Filter Integrity Test Machine Industry Volume Share (%), by Application 2024 & 2032
- Figure 35: North America Filter Integrity Test Machine Industry Revenue (Million), by Country 2024 & 2032
- Figure 36: North America Filter Integrity Test Machine Industry Volume (K Units), by Country 2024 & 2032
- Figure 37: North America Filter Integrity Test Machine Industry Revenue Share (%), by Country 2024 & 2032
- Figure 38: North America Filter Integrity Test Machine Industry Volume Share (%), by Country 2024 & 2032
- Figure 39: Europe Filter Integrity Test Machine Industry Revenue (Million), by Product Type 2024 & 2032
- Figure 40: Europe Filter Integrity Test Machine Industry Volume (K Units), by Product Type 2024 & 2032
- Figure 41: Europe Filter Integrity Test Machine Industry Revenue Share (%), by Product Type 2024 & 2032
- Figure 42: Europe Filter Integrity Test Machine Industry Volume Share (%), by Product Type 2024 & 2032
- Figure 43: Europe Filter Integrity Test Machine Industry Revenue (Million), by Test Type 2024 & 2032
- Figure 44: Europe Filter Integrity Test Machine Industry Volume (K Units), by Test Type 2024 & 2032
- Figure 45: Europe Filter Integrity Test Machine Industry Revenue Share (%), by Test Type 2024 & 2032
- Figure 46: Europe Filter Integrity Test Machine Industry Volume Share (%), by Test Type 2024 & 2032
- Figure 47: Europe Filter Integrity Test Machine Industry Revenue (Million), by Application 2024 & 2032
- Figure 48: Europe Filter Integrity Test Machine Industry Volume (K Units), by Application 2024 & 2032
- Figure 49: Europe Filter Integrity Test Machine Industry Revenue Share (%), by Application 2024 & 2032
- Figure 50: Europe Filter Integrity Test Machine Industry Volume Share (%), by Application 2024 & 2032
- Figure 51: Europe Filter Integrity Test Machine Industry Revenue (Million), by Country 2024 & 2032
- Figure 52: Europe Filter Integrity Test Machine Industry Volume (K Units), by Country 2024 & 2032
- Figure 53: Europe Filter Integrity Test Machine Industry Revenue Share (%), by Country 2024 & 2032
- Figure 54: Europe Filter Integrity Test Machine Industry Volume Share (%), by Country 2024 & 2032
- Figure 55: Asia Pacific Filter Integrity Test Machine Industry Revenue (Million), by Product Type 2024 & 2032
- Figure 56: Asia Pacific Filter Integrity Test Machine Industry Volume (K Units), by Product Type 2024 & 2032
- Figure 57: Asia Pacific Filter Integrity Test Machine Industry Revenue Share (%), by Product Type 2024 & 2032
- Figure 58: Asia Pacific Filter Integrity Test Machine Industry Volume Share (%), by Product Type 2024 & 2032
- Figure 59: Asia Pacific Filter Integrity Test Machine Industry Revenue (Million), by Test Type 2024 & 2032
- Figure 60: Asia Pacific Filter Integrity Test Machine Industry Volume (K Units), by Test Type 2024 & 2032
- Figure 61: Asia Pacific Filter Integrity Test Machine Industry Revenue Share (%), by Test Type 2024 & 2032
- Figure 62: Asia Pacific Filter Integrity Test Machine Industry Volume Share (%), by Test Type 2024 & 2032
- Figure 63: Asia Pacific Filter Integrity Test Machine Industry Revenue (Million), by Application 2024 & 2032
- Figure 64: Asia Pacific Filter Integrity Test Machine Industry Volume (K Units), by Application 2024 & 2032
- Figure 65: Asia Pacific Filter Integrity Test Machine Industry Revenue Share (%), by Application 2024 & 2032
- Figure 66: Asia Pacific Filter Integrity Test Machine Industry Volume Share (%), by Application 2024 & 2032
- Figure 67: Asia Pacific Filter Integrity Test Machine Industry Revenue (Million), by Country 2024 & 2032
- Figure 68: Asia Pacific Filter Integrity Test Machine Industry Volume (K Units), by Country 2024 & 2032
- Figure 69: Asia Pacific Filter Integrity Test Machine Industry Revenue Share (%), by Country 2024 & 2032
- Figure 70: Asia Pacific Filter Integrity Test Machine Industry Volume Share (%), by Country 2024 & 2032
- Figure 71: Middle East and Africa Filter Integrity Test Machine Industry Revenue (Million), by Product Type 2024 & 2032
- Figure 72: Middle East and Africa Filter Integrity Test Machine Industry Volume (K Units), by Product Type 2024 & 2032
- Figure 73: Middle East and Africa Filter Integrity Test Machine Industry Revenue Share (%), by Product Type 2024 & 2032
- Figure 74: Middle East and Africa Filter Integrity Test Machine Industry Volume Share (%), by Product Type 2024 & 2032
- Figure 75: Middle East and Africa Filter Integrity Test Machine Industry Revenue (Million), by Test Type 2024 & 2032
- Figure 76: Middle East and Africa Filter Integrity Test Machine Industry Volume (K Units), by Test Type 2024 & 2032
- Figure 77: Middle East and Africa Filter Integrity Test Machine Industry Revenue Share (%), by Test Type 2024 & 2032
- Figure 78: Middle East and Africa Filter Integrity Test Machine Industry Volume Share (%), by Test Type 2024 & 2032
- Figure 79: Middle East and Africa Filter Integrity Test Machine Industry Revenue (Million), by Application 2024 & 2032
- Figure 80: Middle East and Africa Filter Integrity Test Machine Industry Volume (K Units), by Application 2024 & 2032
- Figure 81: Middle East and Africa Filter Integrity Test Machine Industry Revenue Share (%), by Application 2024 & 2032
- Figure 82: Middle East and Africa Filter Integrity Test Machine Industry Volume Share (%), by Application 2024 & 2032
- Figure 83: Middle East and Africa Filter Integrity Test Machine Industry Revenue (Million), by Country 2024 & 2032
- Figure 84: Middle East and Africa Filter Integrity Test Machine Industry Volume (K Units), by Country 2024 & 2032
- Figure 85: Middle East and Africa Filter Integrity Test Machine Industry Revenue Share (%), by Country 2024 & 2032
- Figure 86: Middle East and Africa Filter Integrity Test Machine Industry Volume Share (%), by Country 2024 & 2032
- Figure 87: South America Filter Integrity Test Machine Industry Revenue (Million), by Product Type 2024 & 2032
- Figure 88: South America Filter Integrity Test Machine Industry Volume (K Units), by Product Type 2024 & 2032
- Figure 89: South America Filter Integrity Test Machine Industry Revenue Share (%), by Product Type 2024 & 2032
- Figure 90: South America Filter Integrity Test Machine Industry Volume Share (%), by Product Type 2024 & 2032
- Figure 91: South America Filter Integrity Test Machine Industry Revenue (Million), by Test Type 2024 & 2032
- Figure 92: South America Filter Integrity Test Machine Industry Volume (K Units), by Test Type 2024 & 2032
- Figure 93: South America Filter Integrity Test Machine Industry Revenue Share (%), by Test Type 2024 & 2032
- Figure 94: South America Filter Integrity Test Machine Industry Volume Share (%), by Test Type 2024 & 2032
- Figure 95: South America Filter Integrity Test Machine Industry Revenue (Million), by Application 2024 & 2032
- Figure 96: South America Filter Integrity Test Machine Industry Volume (K Units), by Application 2024 & 2032
- Figure 97: South America Filter Integrity Test Machine Industry Revenue Share (%), by Application 2024 & 2032
- Figure 98: South America Filter Integrity Test Machine Industry Volume Share (%), by Application 2024 & 2032
- Figure 99: South America Filter Integrity Test Machine Industry Revenue (Million), by Country 2024 & 2032
- Figure 100: South America Filter Integrity Test Machine Industry Volume (K Units), by Country 2024 & 2032
- Figure 101: South America Filter Integrity Test Machine Industry Revenue Share (%), by Country 2024 & 2032
- Figure 102: South America Filter Integrity Test Machine Industry Volume Share (%), by Country 2024 & 2032
List of Tables
- Table 1: Global Filter Integrity Test Machine Industry Revenue Million Forecast, by Region 2019 & 2032
- Table 2: Global Filter Integrity Test Machine Industry Volume K Units Forecast, by Region 2019 & 2032
- Table 3: Global Filter Integrity Test Machine Industry Revenue Million Forecast, by Product Type 2019 & 2032
- Table 4: Global Filter Integrity Test Machine Industry Volume K Units Forecast, by Product Type 2019 & 2032
- Table 5: Global Filter Integrity Test Machine Industry Revenue Million Forecast, by Test Type 2019 & 2032
- Table 6: Global Filter Integrity Test Machine Industry Volume K Units Forecast, by Test Type 2019 & 2032
- Table 7: Global Filter Integrity Test Machine Industry Revenue Million Forecast, by Application 2019 & 2032
- Table 8: Global Filter Integrity Test Machine Industry Volume K Units Forecast, by Application 2019 & 2032
- Table 9: Global Filter Integrity Test Machine Industry Revenue Million Forecast, by Region 2019 & 2032
- Table 10: Global Filter Integrity Test Machine Industry Volume K Units Forecast, by Region 2019 & 2032
- Table 11: Global Filter Integrity Test Machine Industry Revenue Million Forecast, by Country 2019 & 2032
- Table 12: Global Filter Integrity Test Machine Industry Volume K Units Forecast, by Country 2019 & 2032
- Table 13: United States Filter Integrity Test Machine Industry Revenue (Million) Forecast, by Application 2019 & 2032
- Table 14: United States Filter Integrity Test Machine Industry Volume (K Units) Forecast, by Application 2019 & 2032
- Table 15: Canada Filter Integrity Test Machine Industry Revenue (Million) Forecast, by Application 2019 & 2032
- Table 16: Canada Filter Integrity Test Machine Industry Volume (K Units) Forecast, by Application 2019 & 2032
- Table 17: Mexico Filter Integrity Test Machine Industry Revenue (Million) Forecast, by Application 2019 & 2032
- Table 18: Mexico Filter Integrity Test Machine Industry Volume (K Units) Forecast, by Application 2019 & 2032
- Table 19: Global Filter Integrity Test Machine Industry Revenue Million Forecast, by Country 2019 & 2032
- Table 20: Global Filter Integrity Test Machine Industry Volume K Units Forecast, by Country 2019 & 2032
- Table 21: Brazil Filter Integrity Test Machine Industry Revenue (Million) Forecast, by Application 2019 & 2032
- Table 22: Brazil Filter Integrity Test Machine Industry Volume (K Units) Forecast, by Application 2019 & 2032
- Table 23: Mexico Filter Integrity Test Machine Industry Revenue (Million) Forecast, by Application 2019 & 2032
- Table 24: Mexico Filter Integrity Test Machine Industry Volume (K Units) Forecast, by Application 2019 & 2032
- Table 25: Rest of South America Filter Integrity Test Machine Industry Revenue (Million) Forecast, by Application 2019 & 2032
- Table 26: Rest of South America Filter Integrity Test Machine Industry Volume (K Units) Forecast, by Application 2019 & 2032
- Table 27: Global Filter Integrity Test Machine Industry Revenue Million Forecast, by Country 2019 & 2032
- Table 28: Global Filter Integrity Test Machine Industry Volume K Units Forecast, by Country 2019 & 2032
- Table 29: Germany Filter Integrity Test Machine Industry Revenue (Million) Forecast, by Application 2019 & 2032
- Table 30: Germany Filter Integrity Test Machine Industry Volume (K Units) Forecast, by Application 2019 & 2032
- Table 31: United Kingdom Filter Integrity Test Machine Industry Revenue (Million) Forecast, by Application 2019 & 2032
- Table 32: United Kingdom Filter Integrity Test Machine Industry Volume (K Units) Forecast, by Application 2019 & 2032
- Table 33: France Filter Integrity Test Machine Industry Revenue (Million) Forecast, by Application 2019 & 2032
- Table 34: France Filter Integrity Test Machine Industry Volume (K Units) Forecast, by Application 2019 & 2032
- Table 35: Italy Filter Integrity Test Machine Industry Revenue (Million) Forecast, by Application 2019 & 2032
- Table 36: Italy Filter Integrity Test Machine Industry Volume (K Units) Forecast, by Application 2019 & 2032
- Table 37: Spain Filter Integrity Test Machine Industry Revenue (Million) Forecast, by Application 2019 & 2032
- Table 38: Spain Filter Integrity Test Machine Industry Volume (K Units) Forecast, by Application 2019 & 2032
- Table 39: Rest of Europe Filter Integrity Test Machine Industry Revenue (Million) Forecast, by Application 2019 & 2032
- Table 40: Rest of Europe Filter Integrity Test Machine Industry Volume (K Units) Forecast, by Application 2019 & 2032
- Table 41: Global Filter Integrity Test Machine Industry Revenue Million Forecast, by Country 2019 & 2032
- Table 42: Global Filter Integrity Test Machine Industry Volume K Units Forecast, by Country 2019 & 2032
- Table 43: China Filter Integrity Test Machine Industry Revenue (Million) Forecast, by Application 2019 & 2032
- Table 44: China Filter Integrity Test Machine Industry Volume (K Units) Forecast, by Application 2019 & 2032
- Table 45: Japan Filter Integrity Test Machine Industry Revenue (Million) Forecast, by Application 2019 & 2032
- Table 46: Japan Filter Integrity Test Machine Industry Volume (K Units) Forecast, by Application 2019 & 2032
- Table 47: India Filter Integrity Test Machine Industry Revenue (Million) Forecast, by Application 2019 & 2032
- Table 48: India Filter Integrity Test Machine Industry Volume (K Units) Forecast, by Application 2019 & 2032
- Table 49: South Korea Filter Integrity Test Machine Industry Revenue (Million) Forecast, by Application 2019 & 2032
- Table 50: South Korea Filter Integrity Test Machine Industry Volume (K Units) Forecast, by Application 2019 & 2032
- Table 51: Taiwan Filter Integrity Test Machine Industry Revenue (Million) Forecast, by Application 2019 & 2032
- Table 52: Taiwan Filter Integrity Test Machine Industry Volume (K Units) Forecast, by Application 2019 & 2032
- Table 53: Australia Filter Integrity Test Machine Industry Revenue (Million) Forecast, by Application 2019 & 2032
- Table 54: Australia Filter Integrity Test Machine Industry Volume (K Units) Forecast, by Application 2019 & 2032
- Table 55: Rest of Asia-Pacific Filter Integrity Test Machine Industry Revenue (Million) Forecast, by Application 2019 & 2032
- Table 56: Rest of Asia-Pacific Filter Integrity Test Machine Industry Volume (K Units) Forecast, by Application 2019 & 2032
- Table 57: Global Filter Integrity Test Machine Industry Revenue Million Forecast, by Country 2019 & 2032
- Table 58: Global Filter Integrity Test Machine Industry Volume K Units Forecast, by Country 2019 & 2032
- Table 59: Middle East Filter Integrity Test Machine Industry Revenue (Million) Forecast, by Application 2019 & 2032
- Table 60: Middle East Filter Integrity Test Machine Industry Volume (K Units) Forecast, by Application 2019 & 2032
- Table 61: Africa Filter Integrity Test Machine Industry Revenue (Million) Forecast, by Application 2019 & 2032
- Table 62: Africa Filter Integrity Test Machine Industry Volume (K Units) Forecast, by Application 2019 & 2032
- Table 63: Global Filter Integrity Test Machine Industry Revenue Million Forecast, by Product Type 2019 & 2032
- Table 64: Global Filter Integrity Test Machine Industry Volume K Units Forecast, by Product Type 2019 & 2032
- Table 65: Global Filter Integrity Test Machine Industry Revenue Million Forecast, by Test Type 2019 & 2032
- Table 66: Global Filter Integrity Test Machine Industry Volume K Units Forecast, by Test Type 2019 & 2032
- Table 67: Global Filter Integrity Test Machine Industry Revenue Million Forecast, by Application 2019 & 2032
- Table 68: Global Filter Integrity Test Machine Industry Volume K Units Forecast, by Application 2019 & 2032
- Table 69: Global Filter Integrity Test Machine Industry Revenue Million Forecast, by Country 2019 & 2032
- Table 70: Global Filter Integrity Test Machine Industry Volume K Units Forecast, by Country 2019 & 2032
- Table 71: United States Filter Integrity Test Machine Industry Revenue (Million) Forecast, by Application 2019 & 2032
- Table 72: United States Filter Integrity Test Machine Industry Volume (K Units) Forecast, by Application 2019 & 2032
- Table 73: Canada Filter Integrity Test Machine Industry Revenue (Million) Forecast, by Application 2019 & 2032
- Table 74: Canada Filter Integrity Test Machine Industry Volume (K Units) Forecast, by Application 2019 & 2032
- Table 75: Mexico Filter Integrity Test Machine Industry Revenue (Million) Forecast, by Application 2019 & 2032
- Table 76: Mexico Filter Integrity Test Machine Industry Volume (K Units) Forecast, by Application 2019 & 2032
- Table 77: Global Filter Integrity Test Machine Industry Revenue Million Forecast, by Product Type 2019 & 2032
- Table 78: Global Filter Integrity Test Machine Industry Volume K Units Forecast, by Product Type 2019 & 2032
- Table 79: Global Filter Integrity Test Machine Industry Revenue Million Forecast, by Test Type 2019 & 2032
- Table 80: Global Filter Integrity Test Machine Industry Volume K Units Forecast, by Test Type 2019 & 2032
- Table 81: Global Filter Integrity Test Machine Industry Revenue Million Forecast, by Application 2019 & 2032
- Table 82: Global Filter Integrity Test Machine Industry Volume K Units Forecast, by Application 2019 & 2032
- Table 83: Global Filter Integrity Test Machine Industry Revenue Million Forecast, by Country 2019 & 2032
- Table 84: Global Filter Integrity Test Machine Industry Volume K Units Forecast, by Country 2019 & 2032
- Table 85: Germany Filter Integrity Test Machine Industry Revenue (Million) Forecast, by Application 2019 & 2032
- Table 86: Germany Filter Integrity Test Machine Industry Volume (K Units) Forecast, by Application 2019 & 2032
- Table 87: United Kingdom Filter Integrity Test Machine Industry Revenue (Million) Forecast, by Application 2019 & 2032
- Table 88: United Kingdom Filter Integrity Test Machine Industry Volume (K Units) Forecast, by Application 2019 & 2032
- Table 89: France Filter Integrity Test Machine Industry Revenue (Million) Forecast, by Application 2019 & 2032
- Table 90: France Filter Integrity Test Machine Industry Volume (K Units) Forecast, by Application 2019 & 2032
- Table 91: Italy Filter Integrity Test Machine Industry Revenue (Million) Forecast, by Application 2019 & 2032
- Table 92: Italy Filter Integrity Test Machine Industry Volume (K Units) Forecast, by Application 2019 & 2032
- Table 93: Spain Filter Integrity Test Machine Industry Revenue (Million) Forecast, by Application 2019 & 2032
- Table 94: Spain Filter Integrity Test Machine Industry Volume (K Units) Forecast, by Application 2019 & 2032
- Table 95: Rest of Europe Filter Integrity Test Machine Industry Revenue (Million) Forecast, by Application 2019 & 2032
- Table 96: Rest of Europe Filter Integrity Test Machine Industry Volume (K Units) Forecast, by Application 2019 & 2032
- Table 97: Global Filter Integrity Test Machine Industry Revenue Million Forecast, by Product Type 2019 & 2032
- Table 98: Global Filter Integrity Test Machine Industry Volume K Units Forecast, by Product Type 2019 & 2032
- Table 99: Global Filter Integrity Test Machine Industry Revenue Million Forecast, by Test Type 2019 & 2032
- Table 100: Global Filter Integrity Test Machine Industry Volume K Units Forecast, by Test Type 2019 & 2032
- Table 101: Global Filter Integrity Test Machine Industry Revenue Million Forecast, by Application 2019 & 2032
- Table 102: Global Filter Integrity Test Machine Industry Volume K Units Forecast, by Application 2019 & 2032
- Table 103: Global Filter Integrity Test Machine Industry Revenue Million Forecast, by Country 2019 & 2032
- Table 104: Global Filter Integrity Test Machine Industry Volume K Units Forecast, by Country 2019 & 2032
- Table 105: China Filter Integrity Test Machine Industry Revenue (Million) Forecast, by Application 2019 & 2032
- Table 106: China Filter Integrity Test Machine Industry Volume (K Units) Forecast, by Application 2019 & 2032
- Table 107: Japan Filter Integrity Test Machine Industry Revenue (Million) Forecast, by Application 2019 & 2032
- Table 108: Japan Filter Integrity Test Machine Industry Volume (K Units) Forecast, by Application 2019 & 2032
- Table 109: India Filter Integrity Test Machine Industry Revenue (Million) Forecast, by Application 2019 & 2032
- Table 110: India Filter Integrity Test Machine Industry Volume (K Units) Forecast, by Application 2019 & 2032
- Table 111: Australia Filter Integrity Test Machine Industry Revenue (Million) Forecast, by Application 2019 & 2032
- Table 112: Australia Filter Integrity Test Machine Industry Volume (K Units) Forecast, by Application 2019 & 2032
- Table 113: South Korea Filter Integrity Test Machine Industry Revenue (Million) Forecast, by Application 2019 & 2032
- Table 114: South Korea Filter Integrity Test Machine Industry Volume (K Units) Forecast, by Application 2019 & 2032
- Table 115: Rest of Asia Pacific Filter Integrity Test Machine Industry Revenue (Million) Forecast, by Application 2019 & 2032
- Table 116: Rest of Asia Pacific Filter Integrity Test Machine Industry Volume (K Units) Forecast, by Application 2019 & 2032
- Table 117: Global Filter Integrity Test Machine Industry Revenue Million Forecast, by Product Type 2019 & 2032
- Table 118: Global Filter Integrity Test Machine Industry Volume K Units Forecast, by Product Type 2019 & 2032
- Table 119: Global Filter Integrity Test Machine Industry Revenue Million Forecast, by Test Type 2019 & 2032
- Table 120: Global Filter Integrity Test Machine Industry Volume K Units Forecast, by Test Type 2019 & 2032
- Table 121: Global Filter Integrity Test Machine Industry Revenue Million Forecast, by Application 2019 & 2032
- Table 122: Global Filter Integrity Test Machine Industry Volume K Units Forecast, by Application 2019 & 2032
- Table 123: Global Filter Integrity Test Machine Industry Revenue Million Forecast, by Country 2019 & 2032
- Table 124: Global Filter Integrity Test Machine Industry Volume K Units Forecast, by Country 2019 & 2032
- Table 125: GCC Filter Integrity Test Machine Industry Revenue (Million) Forecast, by Application 2019 & 2032
- Table 126: GCC Filter Integrity Test Machine Industry Volume (K Units) Forecast, by Application 2019 & 2032
- Table 127: South Africa Filter Integrity Test Machine Industry Revenue (Million) Forecast, by Application 2019 & 2032
- Table 128: South Africa Filter Integrity Test Machine Industry Volume (K Units) Forecast, by Application 2019 & 2032
- Table 129: Rest of Middle East and Africa Filter Integrity Test Machine Industry Revenue (Million) Forecast, by Application 2019 & 2032
- Table 130: Rest of Middle East and Africa Filter Integrity Test Machine Industry Volume (K Units) Forecast, by Application 2019 & 2032
- Table 131: Global Filter Integrity Test Machine Industry Revenue Million Forecast, by Product Type 2019 & 2032
- Table 132: Global Filter Integrity Test Machine Industry Volume K Units Forecast, by Product Type 2019 & 2032
- Table 133: Global Filter Integrity Test Machine Industry Revenue Million Forecast, by Test Type 2019 & 2032
- Table 134: Global Filter Integrity Test Machine Industry Volume K Units Forecast, by Test Type 2019 & 2032
- Table 135: Global Filter Integrity Test Machine Industry Revenue Million Forecast, by Application 2019 & 2032
- Table 136: Global Filter Integrity Test Machine Industry Volume K Units Forecast, by Application 2019 & 2032
- Table 137: Global Filter Integrity Test Machine Industry Revenue Million Forecast, by Country 2019 & 2032
- Table 138: Global Filter Integrity Test Machine Industry Volume K Units Forecast, by Country 2019 & 2032
- Table 139: Brazil Filter Integrity Test Machine Industry Revenue (Million) Forecast, by Application 2019 & 2032
- Table 140: Brazil Filter Integrity Test Machine Industry Volume (K Units) Forecast, by Application 2019 & 2032
- Table 141: Argentina Filter Integrity Test Machine Industry Revenue (Million) Forecast, by Application 2019 & 2032
- Table 142: Argentina Filter Integrity Test Machine Industry Volume (K Units) Forecast, by Application 2019 & 2032
- Table 143: Rest of South America Filter Integrity Test Machine Industry Revenue (Million) Forecast, by Application 2019 & 2032
- Table 144: Rest of South America Filter Integrity Test Machine Industry Volume (K Units) Forecast, by Application 2019 & 2032
Frequently Asked Questions
1. What is the projected Compound Annual Growth Rate (CAGR) of the Filter Integrity Test Machine Industry?
The projected CAGR is approximately 4.60%.
2. Which companies are prominent players in the Filter Integrity Test Machine Industry?
Key companies in the market include Merck KGaA, 3M, Meissner Filtration Products Inc., Pall Corporation, Sartorius AG, Eaton Corporation PLC, Filter Integrity Ltd., Parker Hannifin Corp., ThermoFisher Scientific, Donaldson Company.
3. What are the main segments of the Filter Integrity Test Machine Industry?
The market segments include Product Type, Test Type, Application.
4. Can you provide details about the market size?
The market size is estimated to be USD XX Million as of 2022.
5. What are some drivers contributing to market growth?
Increasing Demand for Biopharmaceuticals; Higher Spending in R&D Activities.
6. What are the notable trends driving market growth?
Automated Segment is Expected to Witness Growth Over the Forecast Period.
7. Are there any restraints impacting market growth?
High Cost of Testing.
8. Can you provide examples of recent developments in the market?
In July 2022, Syntegon presented new solutions for filling liquid pharmaceuticals, promoting the Versynta FFP (Flexible Filling Platform). As the first filling platform of its kind worldwide, the Versynta FFP also features an integrated system for automated HEPA filter scans for RABS and isolators. Manufacturers can achieve significantly faster, reproducible results in real-time and can increase the reliability of their filter integrity tests.
9. What pricing options are available for accessing the report?
Pricing options include single-user, multi-user, and enterprise licenses priced at USD 4750, USD 5250, and USD 8750 respectively.
10. Is the market size provided in terms of value or volume?
The market size is provided in terms of value, measured in Million and volume, measured in K Units.
11. Are there any specific market keywords associated with the report?
Yes, the market keyword associated with the report is "Filter Integrity Test Machine Industry," which aids in identifying and referencing the specific market segment covered.
12. How do I determine which pricing option suits my needs best?
The pricing options vary based on user requirements and access needs. Individual users may opt for single-user licenses, while businesses requiring broader access may choose multi-user or enterprise licenses for cost-effective access to the report.
13. Are there any additional resources or data provided in the Filter Integrity Test Machine Industry report?
While the report offers comprehensive insights, it's advisable to review the specific contents or supplementary materials provided to ascertain if additional resources or data are available.
14. How can I stay updated on further developments or reports in the Filter Integrity Test Machine Industry?
To stay informed about further developments, trends, and reports in the Filter Integrity Test Machine Industry, consider subscribing to industry newsletters, following relevant companies and organizations, or regularly checking reputable industry news sources and publications.
Methodology
Step 1 - Identification of Relevant Samples Size from Population Database


Step 2 - Approaches for Defining Global Market Size (Value, Volume* & Price*)

Note*: In applicable scenarios
Step 3 - Data Sources
Primary Research
- Web Analytics
- Survey Reports
- Research Institute
- Latest Research Reports
- Opinion Leaders
Secondary Research
- Annual Reports
- White Paper
- Latest Press Release
- Industry Association
- Paid Database
- Investor Presentations

Step 4 - Data Triangulation
Involves using different sources of information in order to increase the validity of a study
These sources are likely to be stakeholders in a program - participants, other researchers, program staff, other community members, and so on.
Then we put all data in single framework & apply various statistical tools to find out the dynamic on the market.
During the analysis stage, feedback from the stakeholder groups would be compared to determine areas of agreement as well as areas of divergence
