

Key Insights
The global Flotation Dispersant market is projected to reach USD 193.3 million by 2025, exhibiting a robust Compound Annual Growth Rate (CAGR) of 3.6% throughout the forecast period of 2025-2033. This steady expansion is underpinned by several key drivers, including the increasing demand for efficient mineral processing in the mining industry, driven by the growing global need for base metals, precious metals, and other essential minerals. Technological advancements in flotation reagents, leading to enhanced selectivity and recovery rates, also play a crucial role in market growth. Furthermore, the rising adoption of advanced mining techniques and the continuous exploration for new mineral reserves globally are expected to fuel the demand for effective flotation dispersants. The market's segmentation reveals a significant contribution from the Non-ferrous Metal and Precious Metals applications, reflecting their importance in various industrial and economic sectors.

Flotation Dispersant Market Size (In Million)
The market dynamics are further shaped by emerging trends such as the development of eco-friendly and sustainable flotation dispersants, addressing environmental concerns associated with traditional chemicals. The focus on optimizing operational efficiency and reducing costs in mineral beneficiation processes also encourages the adoption of specialized dispersant formulations. However, certain restraints may temper the growth trajectory, including the volatile prices of raw materials used in dispersant production and stringent environmental regulations in some regions, which could increase operational costs for manufacturers. Despite these challenges, the broad application spectrum across various mining operations, coupled with ongoing research and development to create more effective and sustainable solutions, positions the Flotation Dispersant market for continued growth and innovation. Key players like AkzoNobel, Chevron Phillips Chemical, and Clariant are at the forefront, driving market advancements and catering to the diverse needs of the global mining sector.

Flotation Dispersant Company Market Share
This in-depth report provides a complete analysis of the global flotation dispersant market, covering historical trends, current dynamics, and future projections. It examines market segmentation by application and type, identifies key growth drivers and challenges, and profiles leading industry players. Essential for mining, mineral processing, and chemical industry professionals seeking strategic insights and competitive intelligence.
Study Period: 2019–2033 | Base Year: 2025 | Estimated Year: 2025 | Forecast Period: 2025–2033 | Historical Period: 2019–2024
Flotation Dispersant Market Dynamics & Structure
The flotation dispersant market is characterized by moderate to high concentration, with a mix of large multinational corporations and specialized regional players. Technological innovation is a significant driver, particularly in developing more efficient and environmentally friendly dispersants that enhance mineral recovery rates and reduce reagent consumption. Regulatory frameworks, primarily focused on environmental impact and worker safety, influence product development and adoption. Competitive product substitutes include alternative separation techniques and process optimizations. End-user demographics reveal a strong reliance on the mining and mineral processing industries, with evolving demands for sustainable solutions. Mergers and acquisitions (M&A) activity, while not excessively high, is present as larger companies seek to consolidate their market position and acquire innovative technologies. For instance, the global flotation dispersant market size is projected to reach an estimated USD 2,500 million in 2025, with M&A deals totaling approximately 12 transactions annually during the historical period.
- Market Concentration: Dominated by key players, but with room for niche specialists.
- Technological Innovation Drivers: Focus on enhanced selectivity, reduced environmental footprint, and cost-effectiveness.
- Regulatory Frameworks: Stringent environmental regulations in major mining regions driving demand for eco-friendly dispersants.
- Competitive Product Substitutes: Advances in magnetic separation and advanced sensor-based sorting technologies present long-term competition.
- End-User Demographics: Primarily driven by the demand for non-ferrous metals, precious metals, and fossil fuels.
- M&A Trends: Strategic acquisitions to broaden product portfolios and expand geographical reach.
Flotation Dispersant Growth Trends & Insights
The flotation dispersant market is poised for robust growth, projected to expand from an estimated USD 2,100 million in 2019 to USD 2,500 million by 2025 and further to USD 3,500 million by 2033. This upward trajectory is fueled by increasing global demand for minerals and metals essential for infrastructure development, renewable energy technologies, and consumer goods. The compound annual growth rate (CAGR) for the forecast period (2025–2033) is anticipated to be approximately 4.8%. Adoption rates are steadily increasing as mining operations worldwide recognize the critical role of effective dispersants in optimizing froth flotation processes, leading to higher concentrate grades and improved recovery rates. Technological disruptions are emerging in the form of bio-based and biodegradable dispersants, addressing growing environmental concerns and sustainability initiatives. Consumer behavior shifts, driven by increased awareness of responsible sourcing and the circular economy, are compelling mining companies to invest in greener chemical solutions. Market penetration is highest in established mining regions with advanced technological infrastructure. The estimated market size in 2025 is USD 2,500 million, with a projected CAGR of 4.8% from 2025 to 2033.
Dominant Regions, Countries, or Segments in Flotation Dispersant
The Non-ferrous Metal application segment is currently the dominant force in the global flotation dispersant market, accounting for an estimated 45% of the market share in 2025. This dominance is driven by the insatiable global demand for essential metals such as copper, aluminum, nickel, and zinc, which are foundational to modern economies, renewable energy infrastructure, and electronics manufacturing. Countries with significant mining operations for these metals, including China, Australia, Chile, Peru, and Canada, are major consumption hubs. China, in particular, is a critical market due to its vast industrial base and substantial domestic mining output, representing approximately 30% of the global market.
Key drivers behind the non-ferrous metal segment's growth include:
- Surging Demand for Electric Vehicles (EVs): EVs require significantly more copper, nickel, and aluminum compared to traditional vehicles, directly boosting demand for associated mineral processing chemicals.
- Renewable Energy Expansion: The development of solar panels, wind turbines, and energy storage systems relies heavily on metals like copper, aluminum, and lithium.
- Urbanization and Infrastructure Development: Growing populations and ongoing urbanization worldwide necessitate continuous investment in construction and infrastructure, all of which are metal-intensive.
- Technological Advancements in Extraction: Ongoing research and development in flotation technologies are leading to more efficient recovery of valuable minerals, even from lower-grade ores, thus increasing the application of dispersants.
Within the types of flotation dispersants, Others (encompassing a range of specialized synthetic polymers and proprietary formulations) holds a significant and growing market share, driven by their tailored performance characteristics for specific ore bodies and processing conditions. The forecast period will see continued growth in this category as companies invest in R&D to create highly effective and environmentally compliant dispersants.
Flotation Dispersant Product Landscape
The flotation dispersant product landscape is dynamic, with continuous innovation aimed at enhancing selectivity, improving recovery rates, and reducing environmental impact. Key product developments include advanced polymeric dispersants offering superior performance in complex ore bodies and harsh conditions. These innovations often focus on achieving better particle dispersion, preventing the agglomeration of gangue minerals, and optimizing froth stability. Application areas are expanding beyond traditional mining to include wastewater treatment and industrial mineral processing. Unique selling propositions revolve around increased mineral recovery (often by 2-5% more than conventional dispersants), reduced chemical consumption, and biodegradability. Technological advancements are also seen in the development of dispersants that are effective across a wider pH range and temperature spectrum, offering greater operational flexibility.
Key Drivers, Barriers & Challenges in Flotation Dispersant
Key Drivers:
- Growing Global Demand for Minerals: The escalating need for metals and minerals for infrastructure, renewable energy, and technology fuels the demand for efficient mineral processing.
- Technological Advancements in Mining: Innovations in extraction and processing techniques enhance the effectiveness and necessity of flotation dispersants.
- Environmental Regulations and Sustainability Initiatives: Increasing pressure for eco-friendly mining practices drives the development and adoption of biodegradable and low-toxicity dispersants.
- Focus on Operational Efficiency: Mining companies seek to maximize resource recovery and minimize waste, making advanced dispersants crucial for process optimization.
Key Barriers & Challenges:
- High Cost of Specialized Dispersants: Advanced, high-performance dispersants can incur higher initial costs, posing a barrier for some operations.
- Environmental Concerns Regarding Certain Chemicals: Historical use of some dispersants with environmental drawbacks leads to scrutiny and a demand for greener alternatives, requiring significant R&D investment.
- Supply Chain Volatility: Geopolitical factors and raw material availability can impact the consistent supply and pricing of key dispersant components, leading to market fluctuations.
- Complexity of Ore Bodies: The diverse and often complex nature of mineral ores requires tailored dispersant solutions, making a one-size-fits-all approach difficult and increasing R&D challenges.
Emerging Opportunities in Flotation Dispersant
Emerging opportunities in the flotation dispersant market lie in the development of novel bio-based and biodegradable dispersants, aligning with the growing emphasis on sustainable mining practices. The untapped potential of extracting critical minerals from unconventional sources, such as mine tailings and wastewater, presents a significant growth avenue. Furthermore, advancements in digital technologies, including AI and machine learning, offer opportunities for developing smart dispersant formulations that can adapt to real-time changes in ore characteristics and processing conditions. The increasing focus on resource recovery from e-waste also represents a nascent but promising application area for specialized dispersants.
Growth Accelerators in the Flotation Dispersant Industry
The flotation dispersant industry's long-term growth is being accelerated by substantial investments in research and development by major chemical manufacturers, leading to breakthroughs in high-performance and environmentally conscious dispersant formulations. Strategic partnerships between dispersant suppliers and mining companies are facilitating the co-development and adoption of tailor-made solutions for specific extraction challenges. Market expansion strategies, particularly in emerging mining regions with developing infrastructure, are also contributing significantly to growth. The increasing adoption of automation and process optimization in mining operations further amplifies the need for advanced chemical reagents like flotation dispersants.
Key Players Shaping the Flotation Dispersant Market
- AkzoNobel
- Chevron Phillips Chemical
- Clariant
- Cytec Solvay Group
- FMC Corporation (Cheminova)
- Orica
- Kao Chemicals
- Huntsman
- Arkema
- Air Products
- Sellwell Group
- FloMin
- Nalco Water (Ecolab)
- Ekofole Reagents
- Senmin
- Nasaco
- Tieling Flotation Reagent
- QiXia TongDa Flotation Reagent
- Hunan Mingzhu Flotation Reagent
- Forbon Technology
- Humon
- Qingquan Ecological
Notable Milestones in Flotation Dispersant Sector
- 2019: Launch of a new generation of biodegradable dispersants by Orica, addressing growing environmental concerns.
- 2020: Cytec Solvay Group (now Solvay) acquired by and integrated into Cytec Industries, enhancing its specialty chemical portfolio.
- 2021: Development of AI-driven dispersant optimization algorithms by Nalco Water (Ecolab), enabling real-time process adjustments.
- 2022: Arkema announces significant investment in expanding its flocculants and coagulants production capacity, indirectly impacting dispersant synergies.
- 2023: Increased M&A activity with smaller specialty chemical firms being acquired by larger players to gain access to innovative dispersant technologies.
- 2024: Introduction of novel bio-based dispersants derived from renewable resources, demonstrating a commitment to circular economy principles.
In-Depth Flotation Dispersant Market Outlook
The future outlook for the flotation dispersant market is exceptionally positive, driven by the confluence of increasing global demand for critical minerals and a strong push towards sustainable mining practices. Growth accelerators, including continuous technological innovation in reagent formulation and application, coupled with strategic partnerships between chemical suppliers and mining enterprises, will propel market expansion. The increasing adoption of advanced digital solutions for process optimization will further solidify the indispensable role of high-performance dispersants. Companies focusing on developing eco-friendly, biodegradable, and highly selective dispersants are well-positioned to capitalize on emerging opportunities and capture significant market share. The estimated market size of USD 2,500 million in 2025 is projected to witness sustained growth, with ample opportunities for both established players and innovative entrants.
Flotation Dispersant Segmentation
-
1. Application
- 1.1. Non-ferrous Metal
- 1.2. Fossil Fuels
- 1.3. Non-metallic
- 1.4. Precious Metals
- 1.5. Others
-
2. Types
- 2.1. Sodium Silicate
- 2.2. Lime
- 2.3. Starch (dextrin)
- 2.4. Others
Flotation Dispersant Segmentation By Geography
-
1. North America
- 1.1. United States
- 1.2. Canada
- 1.3. Mexico
-
2. South America
- 2.1. Brazil
- 2.2. Argentina
- 2.3. Rest of South America
-
3. Europe
- 3.1. United Kingdom
- 3.2. Germany
- 3.3. France
- 3.4. Italy
- 3.5. Spain
- 3.6. Russia
- 3.7. Benelux
- 3.8. Nordics
- 3.9. Rest of Europe
-
4. Middle East & Africa
- 4.1. Turkey
- 4.2. Israel
- 4.3. GCC
- 4.4. North Africa
- 4.5. South Africa
- 4.6. Rest of Middle East & Africa
-
5. Asia Pacific
- 5.1. China
- 5.2. India
- 5.3. Japan
- 5.4. South Korea
- 5.5. ASEAN
- 5.6. Oceania
- 5.7. Rest of Asia Pacific
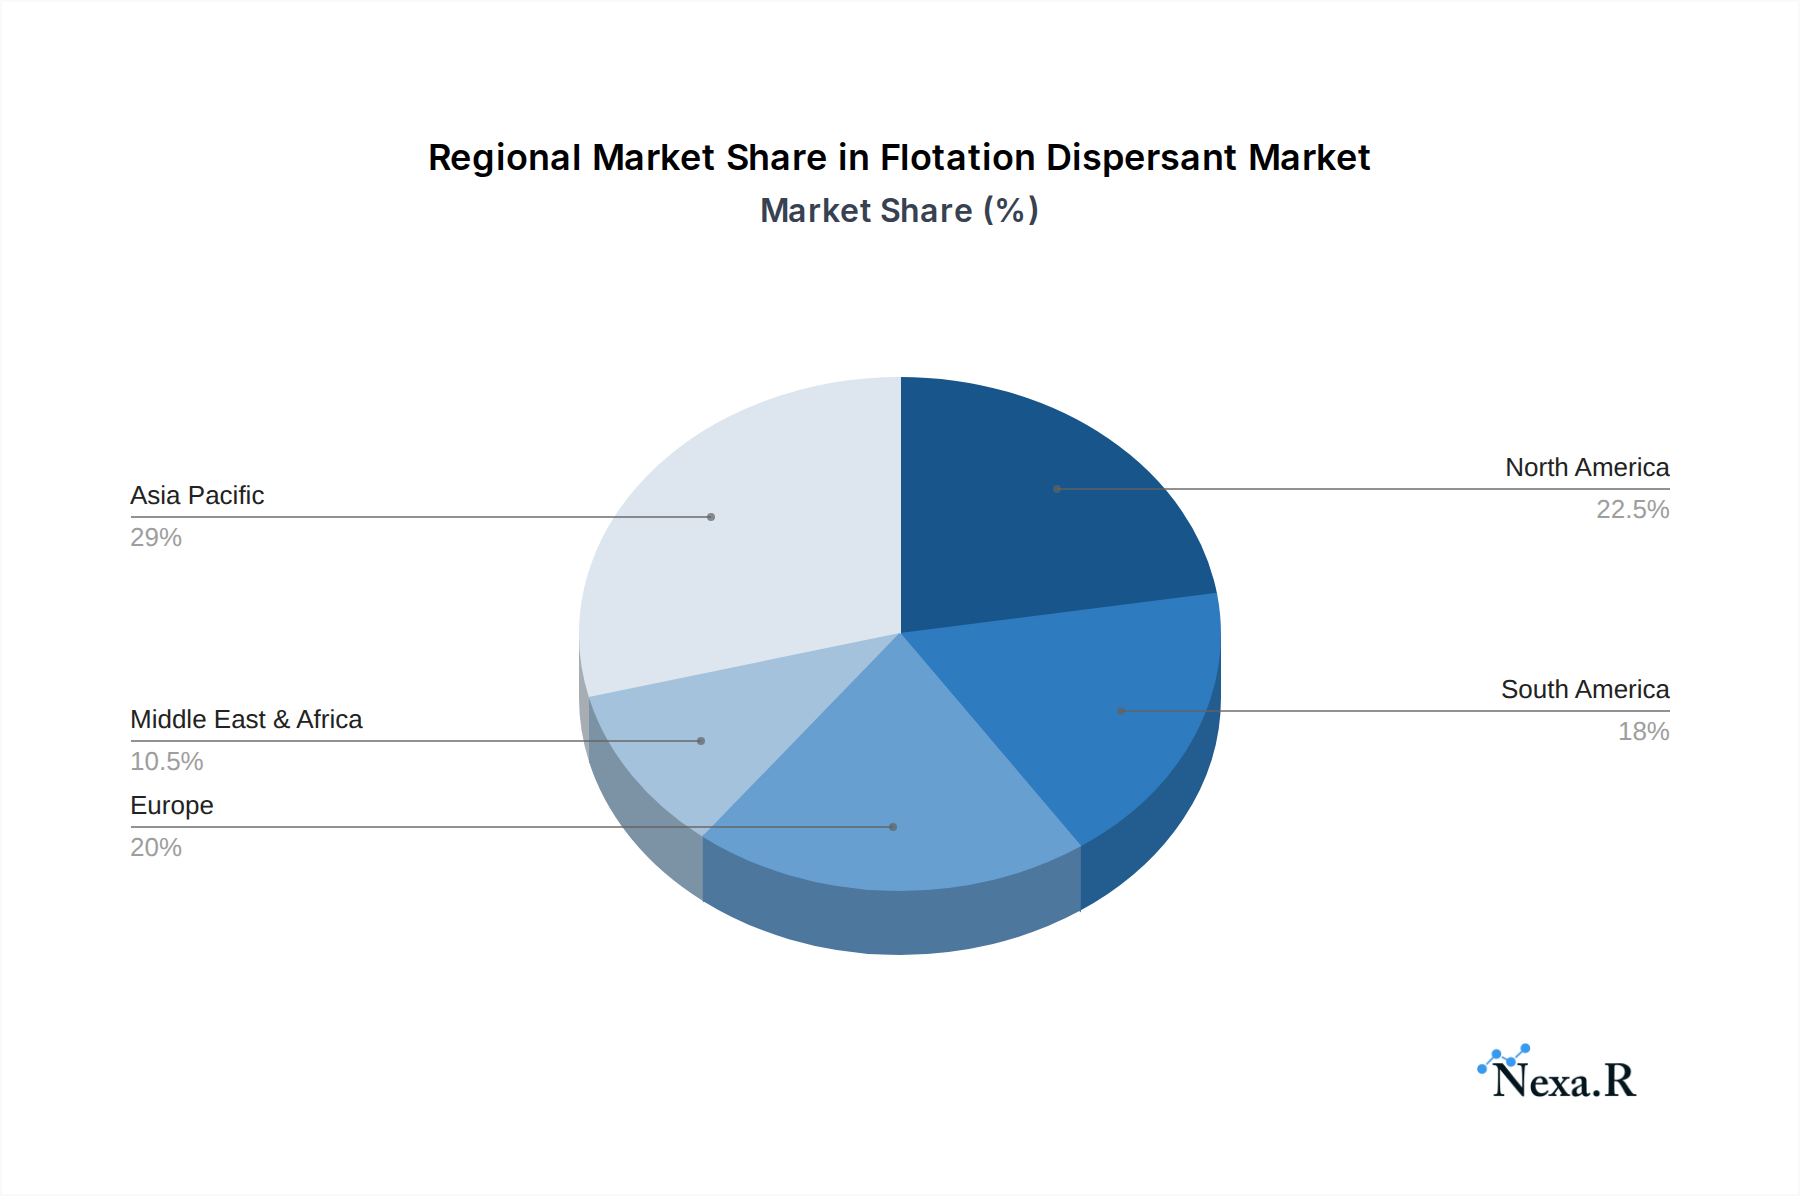
Flotation Dispersant Regional Market Share
Geographic Coverage of Flotation Dispersant
Flotation Dispersant REPORT HIGHLIGHTS
| Aspects | Details |
|---|---|
| Study Period | 2020-2034 |
| Base Year | 2025 |
| Estimated Year | 2026 |
| Forecast Period | 2026-2034 |
| Historical Period | 2020-2025 |
| Growth Rate | CAGR of 3.6% from 2020-2034 |
| Segmentation |
|
Table of Contents
- 1. Introduction
- 1.1. Research Scope
- 1.2. Market Segmentation
- 1.3. Research Methodology
- 1.4. Definitions and Assumptions
- 2. Executive Summary
- 2.1. Introduction
- 3. Market Dynamics
- 3.1. Introduction
- 3.2. Market Drivers
- 3.3. Market Restrains
- 3.4. Market Trends
- 4. Market Factor Analysis
- 4.1. Porters Five Forces
- 4.2. Supply/Value Chain
- 4.3. PESTEL analysis
- 4.4. Market Entropy
- 4.5. Patent/Trademark Analysis
- 5. Global Flotation Dispersant Analysis, Insights and Forecast, 2020-2032
- 5.1. Market Analysis, Insights and Forecast - by Application
- 5.1.1. Non-ferrous Metal
- 5.1.2. Fossil Fuels
- 5.1.3. Non-metallic
- 5.1.4. Precious Metals
- 5.1.5. Others
- 5.2. Market Analysis, Insights and Forecast - by Types
- 5.2.1. Sodium Silicate
- 5.2.2. Lime
- 5.2.3. Starch (dextrin)
- 5.2.4. Others
- 5.3. Market Analysis, Insights and Forecast - by Region
- 5.3.1. North America
- 5.3.2. South America
- 5.3.3. Europe
- 5.3.4. Middle East & Africa
- 5.3.5. Asia Pacific
- 5.1. Market Analysis, Insights and Forecast - by Application
- 6. North America Flotation Dispersant Analysis, Insights and Forecast, 2020-2032
- 6.1. Market Analysis, Insights and Forecast - by Application
- 6.1.1. Non-ferrous Metal
- 6.1.2. Fossil Fuels
- 6.1.3. Non-metallic
- 6.1.4. Precious Metals
- 6.1.5. Others
- 6.2. Market Analysis, Insights and Forecast - by Types
- 6.2.1. Sodium Silicate
- 6.2.2. Lime
- 6.2.3. Starch (dextrin)
- 6.2.4. Others
- 6.1. Market Analysis, Insights and Forecast - by Application
- 7. South America Flotation Dispersant Analysis, Insights and Forecast, 2020-2032
- 7.1. Market Analysis, Insights and Forecast - by Application
- 7.1.1. Non-ferrous Metal
- 7.1.2. Fossil Fuels
- 7.1.3. Non-metallic
- 7.1.4. Precious Metals
- 7.1.5. Others
- 7.2. Market Analysis, Insights and Forecast - by Types
- 7.2.1. Sodium Silicate
- 7.2.2. Lime
- 7.2.3. Starch (dextrin)
- 7.2.4. Others
- 7.1. Market Analysis, Insights and Forecast - by Application
- 8. Europe Flotation Dispersant Analysis, Insights and Forecast, 2020-2032
- 8.1. Market Analysis, Insights and Forecast - by Application
- 8.1.1. Non-ferrous Metal
- 8.1.2. Fossil Fuels
- 8.1.3. Non-metallic
- 8.1.4. Precious Metals
- 8.1.5. Others
- 8.2. Market Analysis, Insights and Forecast - by Types
- 8.2.1. Sodium Silicate
- 8.2.2. Lime
- 8.2.3. Starch (dextrin)
- 8.2.4. Others
- 8.1. Market Analysis, Insights and Forecast - by Application
- 9. Middle East & Africa Flotation Dispersant Analysis, Insights and Forecast, 2020-2032
- 9.1. Market Analysis, Insights and Forecast - by Application
- 9.1.1. Non-ferrous Metal
- 9.1.2. Fossil Fuels
- 9.1.3. Non-metallic
- 9.1.4. Precious Metals
- 9.1.5. Others
- 9.2. Market Analysis, Insights and Forecast - by Types
- 9.2.1. Sodium Silicate
- 9.2.2. Lime
- 9.2.3. Starch (dextrin)
- 9.2.4. Others
- 9.1. Market Analysis, Insights and Forecast - by Application
- 10. Asia Pacific Flotation Dispersant Analysis, Insights and Forecast, 2020-2032
- 10.1. Market Analysis, Insights and Forecast - by Application
- 10.1.1. Non-ferrous Metal
- 10.1.2. Fossil Fuels
- 10.1.3. Non-metallic
- 10.1.4. Precious Metals
- 10.1.5. Others
- 10.2. Market Analysis, Insights and Forecast - by Types
- 10.2.1. Sodium Silicate
- 10.2.2. Lime
- 10.2.3. Starch (dextrin)
- 10.2.4. Others
- 10.1. Market Analysis, Insights and Forecast - by Application
- 11. Competitive Analysis
- 11.1. Global Market Share Analysis 2025
- 11.2. Company Profiles
- 11.2.1 AkzoNobel
- 11.2.1.1. Overview
- 11.2.1.2. Products
- 11.2.1.3. SWOT Analysis
- 11.2.1.4. Recent Developments
- 11.2.1.5. Financials (Based on Availability)
- 11.2.2 Chevron Phillips Chemical
- 11.2.2.1. Overview
- 11.2.2.2. Products
- 11.2.2.3. SWOT Analysis
- 11.2.2.4. Recent Developments
- 11.2.2.5. Financials (Based on Availability)
- 11.2.3 Clariant
- 11.2.3.1. Overview
- 11.2.3.2. Products
- 11.2.3.3. SWOT Analysis
- 11.2.3.4. Recent Developments
- 11.2.3.5. Financials (Based on Availability)
- 11.2.4 Cytec Solvay Group
- 11.2.4.1. Overview
- 11.2.4.2. Products
- 11.2.4.3. SWOT Analysis
- 11.2.4.4. Recent Developments
- 11.2.4.5. Financials (Based on Availability)
- 11.2.5 FMC Corporation (Cheminova)
- 11.2.5.1. Overview
- 11.2.5.2. Products
- 11.2.5.3. SWOT Analysis
- 11.2.5.4. Recent Developments
- 11.2.5.5. Financials (Based on Availability)
- 11.2.6 Orica
- 11.2.6.1. Overview
- 11.2.6.2. Products
- 11.2.6.3. SWOT Analysis
- 11.2.6.4. Recent Developments
- 11.2.6.5. Financials (Based on Availability)
- 11.2.7 Kao Chemicals
- 11.2.7.1. Overview
- 11.2.7.2. Products
- 11.2.7.3. SWOT Analysis
- 11.2.7.4. Recent Developments
- 11.2.7.5. Financials (Based on Availability)
- 11.2.8 Huntsman
- 11.2.8.1. Overview
- 11.2.8.2. Products
- 11.2.8.3. SWOT Analysis
- 11.2.8.4. Recent Developments
- 11.2.8.5. Financials (Based on Availability)
- 11.2.9 Arkema
- 11.2.9.1. Overview
- 11.2.9.2. Products
- 11.2.9.3. SWOT Analysis
- 11.2.9.4. Recent Developments
- 11.2.9.5. Financials (Based on Availability)
- 11.2.10 Air Products
- 11.2.10.1. Overview
- 11.2.10.2. Products
- 11.2.10.3. SWOT Analysis
- 11.2.10.4. Recent Developments
- 11.2.10.5. Financials (Based on Availability)
- 11.2.11 Sellwell Group
- 11.2.11.1. Overview
- 11.2.11.2. Products
- 11.2.11.3. SWOT Analysis
- 11.2.11.4. Recent Developments
- 11.2.11.5. Financials (Based on Availability)
- 11.2.12 FloMin
- 11.2.12.1. Overview
- 11.2.12.2. Products
- 11.2.12.3. SWOT Analysis
- 11.2.12.4. Recent Developments
- 11.2.12.5. Financials (Based on Availability)
- 11.2.13 Nalco Water (Ecolab)
- 11.2.13.1. Overview
- 11.2.13.2. Products
- 11.2.13.3. SWOT Analysis
- 11.2.13.4. Recent Developments
- 11.2.13.5. Financials (Based on Availability)
- 11.2.14 Ekofole Reagents
- 11.2.14.1. Overview
- 11.2.14.2. Products
- 11.2.14.3. SWOT Analysis
- 11.2.14.4. Recent Developments
- 11.2.14.5. Financials (Based on Availability)
- 11.2.15 Senmin
- 11.2.15.1. Overview
- 11.2.15.2. Products
- 11.2.15.3. SWOT Analysis
- 11.2.15.4. Recent Developments
- 11.2.15.5. Financials (Based on Availability)
- 11.2.16 Nasaco
- 11.2.16.1. Overview
- 11.2.16.2. Products
- 11.2.16.3. SWOT Analysis
- 11.2.16.4. Recent Developments
- 11.2.16.5. Financials (Based on Availability)
- 11.2.17 Tieling Flotation Reagent
- 11.2.17.1. Overview
- 11.2.17.2. Products
- 11.2.17.3. SWOT Analysis
- 11.2.17.4. Recent Developments
- 11.2.17.5. Financials (Based on Availability)
- 11.2.18 QiXia TongDa Flotation Reagent
- 11.2.18.1. Overview
- 11.2.18.2. Products
- 11.2.18.3. SWOT Analysis
- 11.2.18.4. Recent Developments
- 11.2.18.5. Financials (Based on Availability)
- 11.2.19 Hunan Mingzhu Flotation Reagent
- 11.2.19.1. Overview
- 11.2.19.2. Products
- 11.2.19.3. SWOT Analysis
- 11.2.19.4. Recent Developments
- 11.2.19.5. Financials (Based on Availability)
- 11.2.20 Forbon Technology
- 11.2.20.1. Overview
- 11.2.20.2. Products
- 11.2.20.3. SWOT Analysis
- 11.2.20.4. Recent Developments
- 11.2.20.5. Financials (Based on Availability)
- 11.2.21 Humon
- 11.2.21.1. Overview
- 11.2.21.2. Products
- 11.2.21.3. SWOT Analysis
- 11.2.21.4. Recent Developments
- 11.2.21.5. Financials (Based on Availability)
- 11.2.22 Qingquan Ecological
- 11.2.22.1. Overview
- 11.2.22.2. Products
- 11.2.22.3. SWOT Analysis
- 11.2.22.4. Recent Developments
- 11.2.22.5. Financials (Based on Availability)
- 11.2.1 AkzoNobel
List of Figures
- Figure 1: Global Flotation Dispersant Revenue Breakdown (million, %) by Region 2025 & 2033
- Figure 2: North America Flotation Dispersant Revenue (million), by Application 2025 & 2033
- Figure 3: North America Flotation Dispersant Revenue Share (%), by Application 2025 & 2033
- Figure 4: North America Flotation Dispersant Revenue (million), by Types 2025 & 2033
- Figure 5: North America Flotation Dispersant Revenue Share (%), by Types 2025 & 2033
- Figure 6: North America Flotation Dispersant Revenue (million), by Country 2025 & 2033
- Figure 7: North America Flotation Dispersant Revenue Share (%), by Country 2025 & 2033
- Figure 8: South America Flotation Dispersant Revenue (million), by Application 2025 & 2033
- Figure 9: South America Flotation Dispersant Revenue Share (%), by Application 2025 & 2033
- Figure 10: South America Flotation Dispersant Revenue (million), by Types 2025 & 2033
- Figure 11: South America Flotation Dispersant Revenue Share (%), by Types 2025 & 2033
- Figure 12: South America Flotation Dispersant Revenue (million), by Country 2025 & 2033
- Figure 13: South America Flotation Dispersant Revenue Share (%), by Country 2025 & 2033
- Figure 14: Europe Flotation Dispersant Revenue (million), by Application 2025 & 2033
- Figure 15: Europe Flotation Dispersant Revenue Share (%), by Application 2025 & 2033
- Figure 16: Europe Flotation Dispersant Revenue (million), by Types 2025 & 2033
- Figure 17: Europe Flotation Dispersant Revenue Share (%), by Types 2025 & 2033
- Figure 18: Europe Flotation Dispersant Revenue (million), by Country 2025 & 2033
- Figure 19: Europe Flotation Dispersant Revenue Share (%), by Country 2025 & 2033
- Figure 20: Middle East & Africa Flotation Dispersant Revenue (million), by Application 2025 & 2033
- Figure 21: Middle East & Africa Flotation Dispersant Revenue Share (%), by Application 2025 & 2033
- Figure 22: Middle East & Africa Flotation Dispersant Revenue (million), by Types 2025 & 2033
- Figure 23: Middle East & Africa Flotation Dispersant Revenue Share (%), by Types 2025 & 2033
- Figure 24: Middle East & Africa Flotation Dispersant Revenue (million), by Country 2025 & 2033
- Figure 25: Middle East & Africa Flotation Dispersant Revenue Share (%), by Country 2025 & 2033
- Figure 26: Asia Pacific Flotation Dispersant Revenue (million), by Application 2025 & 2033
- Figure 27: Asia Pacific Flotation Dispersant Revenue Share (%), by Application 2025 & 2033
- Figure 28: Asia Pacific Flotation Dispersant Revenue (million), by Types 2025 & 2033
- Figure 29: Asia Pacific Flotation Dispersant Revenue Share (%), by Types 2025 & 2033
- Figure 30: Asia Pacific Flotation Dispersant Revenue (million), by Country 2025 & 2033
- Figure 31: Asia Pacific Flotation Dispersant Revenue Share (%), by Country 2025 & 2033
List of Tables
- Table 1: Global Flotation Dispersant Revenue million Forecast, by Application 2020 & 2033
- Table 2: Global Flotation Dispersant Revenue million Forecast, by Types 2020 & 2033
- Table 3: Global Flotation Dispersant Revenue million Forecast, by Region 2020 & 2033
- Table 4: Global Flotation Dispersant Revenue million Forecast, by Application 2020 & 2033
- Table 5: Global Flotation Dispersant Revenue million Forecast, by Types 2020 & 2033
- Table 6: Global Flotation Dispersant Revenue million Forecast, by Country 2020 & 2033
- Table 7: United States Flotation Dispersant Revenue (million) Forecast, by Application 2020 & 2033
- Table 8: Canada Flotation Dispersant Revenue (million) Forecast, by Application 2020 & 2033
- Table 9: Mexico Flotation Dispersant Revenue (million) Forecast, by Application 2020 & 2033
- Table 10: Global Flotation Dispersant Revenue million Forecast, by Application 2020 & 2033
- Table 11: Global Flotation Dispersant Revenue million Forecast, by Types 2020 & 2033
- Table 12: Global Flotation Dispersant Revenue million Forecast, by Country 2020 & 2033
- Table 13: Brazil Flotation Dispersant Revenue (million) Forecast, by Application 2020 & 2033
- Table 14: Argentina Flotation Dispersant Revenue (million) Forecast, by Application 2020 & 2033
- Table 15: Rest of South America Flotation Dispersant Revenue (million) Forecast, by Application 2020 & 2033
- Table 16: Global Flotation Dispersant Revenue million Forecast, by Application 2020 & 2033
- Table 17: Global Flotation Dispersant Revenue million Forecast, by Types 2020 & 2033
- Table 18: Global Flotation Dispersant Revenue million Forecast, by Country 2020 & 2033
- Table 19: United Kingdom Flotation Dispersant Revenue (million) Forecast, by Application 2020 & 2033
- Table 20: Germany Flotation Dispersant Revenue (million) Forecast, by Application 2020 & 2033
- Table 21: France Flotation Dispersant Revenue (million) Forecast, by Application 2020 & 2033
- Table 22: Italy Flotation Dispersant Revenue (million) Forecast, by Application 2020 & 2033
- Table 23: Spain Flotation Dispersant Revenue (million) Forecast, by Application 2020 & 2033
- Table 24: Russia Flotation Dispersant Revenue (million) Forecast, by Application 2020 & 2033
- Table 25: Benelux Flotation Dispersant Revenue (million) Forecast, by Application 2020 & 2033
- Table 26: Nordics Flotation Dispersant Revenue (million) Forecast, by Application 2020 & 2033
- Table 27: Rest of Europe Flotation Dispersant Revenue (million) Forecast, by Application 2020 & 2033
- Table 28: Global Flotation Dispersant Revenue million Forecast, by Application 2020 & 2033
- Table 29: Global Flotation Dispersant Revenue million Forecast, by Types 2020 & 2033
- Table 30: Global Flotation Dispersant Revenue million Forecast, by Country 2020 & 2033
- Table 31: Turkey Flotation Dispersant Revenue (million) Forecast, by Application 2020 & 2033
- Table 32: Israel Flotation Dispersant Revenue (million) Forecast, by Application 2020 & 2033
- Table 33: GCC Flotation Dispersant Revenue (million) Forecast, by Application 2020 & 2033
- Table 34: North Africa Flotation Dispersant Revenue (million) Forecast, by Application 2020 & 2033
- Table 35: South Africa Flotation Dispersant Revenue (million) Forecast, by Application 2020 & 2033
- Table 36: Rest of Middle East & Africa Flotation Dispersant Revenue (million) Forecast, by Application 2020 & 2033
- Table 37: Global Flotation Dispersant Revenue million Forecast, by Application 2020 & 2033
- Table 38: Global Flotation Dispersant Revenue million Forecast, by Types 2020 & 2033
- Table 39: Global Flotation Dispersant Revenue million Forecast, by Country 2020 & 2033
- Table 40: China Flotation Dispersant Revenue (million) Forecast, by Application 2020 & 2033
- Table 41: India Flotation Dispersant Revenue (million) Forecast, by Application 2020 & 2033
- Table 42: Japan Flotation Dispersant Revenue (million) Forecast, by Application 2020 & 2033
- Table 43: South Korea Flotation Dispersant Revenue (million) Forecast, by Application 2020 & 2033
- Table 44: ASEAN Flotation Dispersant Revenue (million) Forecast, by Application 2020 & 2033
- Table 45: Oceania Flotation Dispersant Revenue (million) Forecast, by Application 2020 & 2033
- Table 46: Rest of Asia Pacific Flotation Dispersant Revenue (million) Forecast, by Application 2020 & 2033
Frequently Asked Questions
1. What is the projected Compound Annual Growth Rate (CAGR) of the Flotation Dispersant?
The projected CAGR is approximately 3.6%.
2. Which companies are prominent players in the Flotation Dispersant?
Key companies in the market include AkzoNobel, Chevron Phillips Chemical, Clariant, Cytec Solvay Group, FMC Corporation (Cheminova), Orica, Kao Chemicals, Huntsman, Arkema, Air Products, Sellwell Group, FloMin, Nalco Water (Ecolab), Ekofole Reagents, Senmin, Nasaco, Tieling Flotation Reagent, QiXia TongDa Flotation Reagent, Hunan Mingzhu Flotation Reagent, Forbon Technology, Humon, Qingquan Ecological.
3. What are the main segments of the Flotation Dispersant?
The market segments include Application, Types.
4. Can you provide details about the market size?
The market size is estimated to be USD 193.3 million as of 2022.
5. What are some drivers contributing to market growth?
N/A
6. What are the notable trends driving market growth?
N/A
7. Are there any restraints impacting market growth?
N/A
8. Can you provide examples of recent developments in the market?
N/A
9. What pricing options are available for accessing the report?
Pricing options include single-user, multi-user, and enterprise licenses priced at USD 4900.00, USD 7350.00, and USD 9800.00 respectively.
10. Is the market size provided in terms of value or volume?
The market size is provided in terms of value, measured in million.
11. Are there any specific market keywords associated with the report?
Yes, the market keyword associated with the report is "Flotation Dispersant," which aids in identifying and referencing the specific market segment covered.
12. How do I determine which pricing option suits my needs best?
The pricing options vary based on user requirements and access needs. Individual users may opt for single-user licenses, while businesses requiring broader access may choose multi-user or enterprise licenses for cost-effective access to the report.
13. Are there any additional resources or data provided in the Flotation Dispersant report?
While the report offers comprehensive insights, it's advisable to review the specific contents or supplementary materials provided to ascertain if additional resources or data are available.
14. How can I stay updated on further developments or reports in the Flotation Dispersant?
To stay informed about further developments, trends, and reports in the Flotation Dispersant, consider subscribing to industry newsletters, following relevant companies and organizations, or regularly checking reputable industry news sources and publications.
Methodology
Step 1 - Identification of Relevant Samples Size from Population Database


Step 2 - Approaches for Defining Global Market Size (Value, Volume* & Price*)

Note*: In applicable scenarios
Step 3 - Data Sources
Primary Research
- Web Analytics
- Survey Reports
- Research Institute
- Latest Research Reports
- Opinion Leaders
Secondary Research
- Annual Reports
- White Paper
- Latest Press Release
- Industry Association
- Paid Database
- Investor Presentations

Step 4 - Data Triangulation
Involves using different sources of information in order to increase the validity of a study
These sources are likely to be stakeholders in a program - participants, other researchers, program staff, other community members, and so on.
Then we put all data in single framework & apply various statistical tools to find out the dynamic on the market.
During the analysis stage, feedback from the stakeholder groups would be compared to determine areas of agreement as well as areas of divergence